Design and Performance of an Adaptable Aircraft
Manufacturing Concept
Tony S. Tao1 and R. John Hansman2
Massachusetts Institute of Technology, Cambridge, MA, 02139
In conventional “vehicle-focused” aircraft design and manufacturing, aircraft are optimized for a given mission and then manufactured using custom-built tooling. This strategy ensures the highest vehicle performance for any given mission but is inflexible in that accommodating new missions requires the production of new tooling, a time-consuming and expensive process. An alternative, “Adaptable Aircraft Manufacturing” concept, is explored in which a structural bus, interconnect system, and subsection molding allows the production of a series of composite aircraft from a single set of molds which are compatible with vacuum-autoclave construction techniques. To design common molds, airfoils and planform taper angle must be designed across multiple vehicles’ performance spaces. Performance of any individual design is reduced due to inherent aerodynamic and structural inefficiencies of the adaptably-manufactured airframe, but molding costs and production time are greatly reduced. By molding a subsection, the designer is free to choose aspect ratio and wing area within the molding envelope for new aircraft designed after mold fabrication. In applications where development time and robustness to changes in mission specification is more important than individual aircraft performance, this concept provides significant advantages. To demonstrate the feasibility of the concept, three UAVs of differing sizes (a hand-launched UAV, a reconnaissance UAV, and a multi-payload UAV) were constructed from a single set of molds. The aircraft were constructed, flight-tested, and their performance evaluated to determine the benefits and penalties of this approach as compared to three virtual, equivalent, conventionally-manufactured aircraft. The adaptably-manufactured aircraft are estimated to suffer an average of 8% increase in weight and a reduction of 17% in endurance. The benefit is a reduction of 58% of tooling material and labor and a reduction of 56% in build time as compared to the manufacturing of three individual, conventionally-built aircraft.
I. Introduction
Traditionally, aircraft design and manufacturing has employed a “vehicle-focused” scheme. In this scheme, a mission is identified, a set of specifications (requirements, objectives, etc.) is established, and the aircraft is then designed for the mission specifications. Once the aircraft structure has been designed, tooling and support architecture is then designed, constructed, and then used to produce the aircraft. The non-recurring costs (vehicle design, tooling design, tooling fabrication) which far exceeds the per-aircraft recurring costs (materials, labor, etc.), can then be amortized over the entire fleet. The reason for this approach is that the aircraft can be optimized for the mission specifications and would therefore be the most competitive vehicle possible.
There are, however, several weaknesses in a vehicle-focused production method. First, producing new tooling for every new mission results in a slow rate of mission satisfaction. Even for well-proven conventional vehicles, such as conventional tube-and-wing transport aircraft, the typical development time is around 6 years [1]. Of that development time, approximately half is dominated by tooling design and fabrication as shown in Figure 1. As shown in Figure 2, tooling design and fabrication is approximately as costly as the engineering of the vehicle itself.
1 PhD Candidate, MIT Aero Astro, 77 Massachusetts Ave 33-115, AIAA Student Member.
Figure 1: Non-recurring hours in development of a commercial aircraft (normalized) [2]
Figure 2: Cost breakdown by work category for a typical aircraft: data from [2]
Second, changes in mission specification partway through a design are extremely expensive to both non-recurring cost and schedule because aircraft components are highly coupled. If a major requirement such as payload size, endurance, or speed changes, much of the vehicle must be redesigned and retooled from scratch if it is to remain optimal. Any tooling previously produced is likely wasted.
A third and indirect effect of the vehicle-focused scheme is result of the previous two. Due to the knowledge that expanding performance is both time-consuming and expensive, vehicles are often designed with greater operational capacity than is necessary so that it may achieve sufficient performance even if driving requirements change. Unfortunately, increasing performance margins causes the vehicle to be larger, more expensive, and less efficient for the baseline mission.
One way in which manufacturers have addressed these issues through the use of vehicle product families. Airbus and Boeing jetliners are not designed as single vehicles; instead, vehicle families are designed with a dimension of scalability (length of the fuselage) while the wings and tails are reused. The reuse of components exploits economies of scale in their design, tooling, and production costs to accommodate a range of payload sizes. The product family strategy also allows the manufacturers to react to market demands more quickly as it is faster and cheaper to ramp up the production of one variant as opposed to designing new vehicles.
II. Adaptable Aircraft Manufacturing
The Adaptable Aircraft Manufacturing (AAM) concept was created to investigate the feasibility of a vehicle platform that would allow new missions to be satisfied with minimum production of new tooling, thereby reducing vehicle production time and non-recurring costs over an entire fleet. However, instead of scaling only the fuselage length as in the jetliner example above, the goal is to accommodate much greater changes in vehicle size and
performance spaces (though at a much smaller scale and lower speed in this UAV application). To accomplish this, AAM is composed of several two technologies: a structural bus and reusable molds.
A. Structural Bus
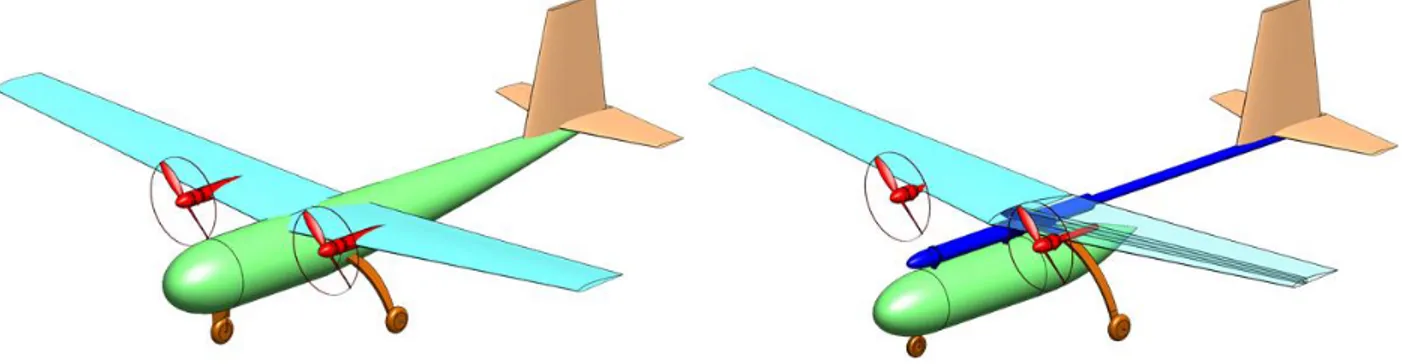
The structural bus (SB) is composed of two “spine” tubes which carry loads between the components (wing, fuselage, landing gear, and tail assembly) and collars that lock the components onto the spine. The SB is shown in dark blue on the right side of Figure 3.
Figure 3: Layout of typical UAV (left) and AAM implementation (right)
The two concentric spine tubes functionally replace longerons in a traditional design. The fore tube carries the fuselage pod, wings, and landing gear and is quasi-isentropic in its layup. The horizontal and vertical tails are attached to the aft tube which plugs into the rear of the fore tube via interface rings. The aft tube, carrying largely bending loads, has a largely unidirectional layup. The fuselage shell’s loads are then reduced and the shell becomes functionally an aerodynamic fairing. The fuselage houses the payloads, batteries, and avionics.
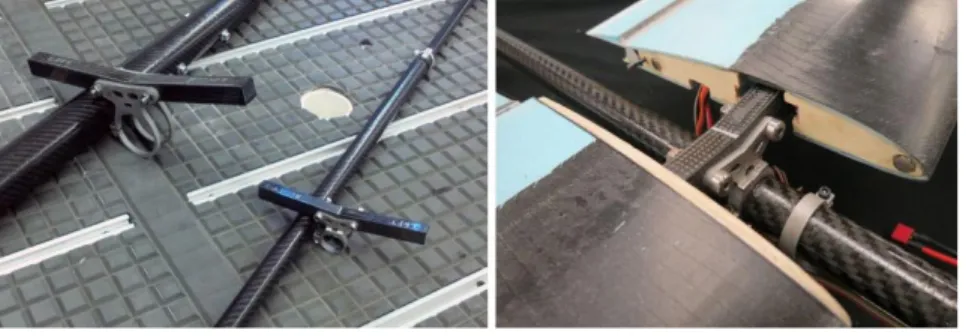
“Collar” connectors are used to connect bulkheads in the fuselage pod and wing spar to the tubes of the SB. The collars consist of a ring-clamp and fork or plate which are attached to bulkhead or spar hardpoints, respectively. The ring-clamp locks onto the spine to transfer loads. Example fuselage and wing collars are shown in Figure 4 below. Collars are designed to be simple to manufacture via water-jet and are made to provide minimum exposed frontal area to minimize their drag contribution.
Figure 4: Fuselage collars and wing collars for a small UAV (left) and large UAV (right)
1. Operational benefits of SB
Because collars attach to the SB using friction, the components may be added, removed, or repositioned along the structural bus during operation. Such a system makes it easy to replace components for maintenance and repairs or to allow the operator to swap out components to suit missions as necessary. This system enables the operator to switch differently-mounted payloads such as replacing a forward-facing camera with a rear-facing camera.
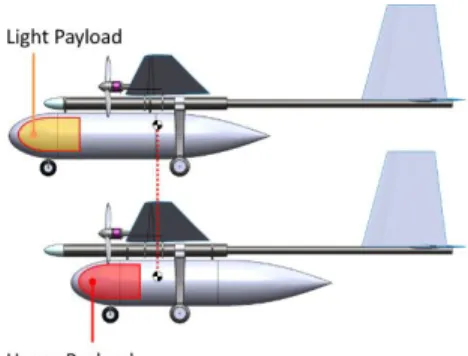
Sliding the fuselage along the SB provides greater compatibility to payloads that are not mounted on the center of gravity. For instance, if a forward camera increases in mass, the fuselage pod may be shifted back so that the CG of the aircraft can remain in place, as illustrated in Figure 5 below.
Figure 5: Shift of fuselage to maintain CG location
2. Drawbacks and scalability issues of SB
The first drawback of the SB is the weight of the collars, joiners, and other hardware necessary to attach the components to the spine. Second, the SB’s exposure to the air as shown in Figure 6 increases the drag of the aircraft. If the fuselage is placed underneath the spine, this arrangement also increases the length of the landing gear which increases drag and weight. This effect is diminished by the reduction of wetted area of the fuselage as it can taper to a point forward of the tail. Third, electrical wiring between aircraft components cannot be routed as efficiently as could be accomplished with a standard configuration.
The SB’s smaller cross-section results in a smaller area moment of inertia, necessitating a thicker wall compared with a conventional fuselage to provide the comparable strength and stiffness for the tail boom.
Figure 6: Front and side profiles of conventional vs AAM structures
At small scales and low speeds in which a conventional fuselage shell thickness is limited by minimum gauge and localized buckling, the spine tube is not a significant disadvantage. However, at large scales, the cube-square law’s effect on long, thin deflection-limited structures makes the SB a poor choice. Under the assumption that the tail scales directly with the wing, a beam-bending model may be defined with the following parameters:
𝑊𝑏𝑜𝑜𝑚 weight of the tail boom
𝑊 all-up weight of the aircraft 𝑁 maximum vehicle load factor 𝐾𝑇 tail size coefficient
𝑙𝑏𝑜𝑜𝑚 length of tail boom
𝛿 permissible deflection at end of boom 𝐴𝑅𝑏𝑜𝑜𝑚 aspect ratio of the boom = length/diameter
𝑔 gravitational constant
𝐸̅ specific modulus of boom material
As the vehicle size increases, a stiffness-constrained beam’s weight as a fraction of total aircraft weight scales quadratically with its slenderness ratio and linearly with its length as shown in Eq. (1). The direct relation between weight fraction and boom length (which scales with vehicle size) results in the thin tail boom’s extreme inefficiency at large sizes. This analysis follows the same methodology as used in [3].
𝑊𝑏𝑜𝑜𝑚 𝑊 = 8 3𝑁𝐾𝑇 𝑙𝑏𝑜𝑜𝑚 𝛿 𝑙𝑏𝑜𝑜𝑚𝐴𝑅𝑏𝑜𝑜𝑚 2 𝑔 𝐸̅ (1)
The friction-based collar attachment system also scales poorly to large applications. The maximum friction force that can be transferred in a collar scales as vehicle size squared and linearly with the maximum shear stress
allowable of the material while the weight the payload scales with the cube, resulting in the need to increase the relative width of the collars for a friction-limited collar design and therefore an increase in weight as a fraction of total airframe weight.
B. Scalable Molding
AAM wing and tail molds take advantage of the convergent optimization qualities of wing and tail geometries over a range of vehicle sizes. Conventional cantilever wing design have well-established design drivers. Wing area is set by takeoff and stall speed requirements. Aerodynamic efficiency (aspect ratio, taper ratio, airfoil thickness, and sweep) trades off against structural weight (spar and torsion box) as a function of scale (Reynolds and Mach number and cube-square laws) to determine the structure, planform, and airfoil thickness distribution.
While the design space and constraint space is complex, the results in planform optimization can be observed to be predictable and bounded on real vehicles. Wing geometries for similar mission types (endurance-driven, range-driven, maneuverability-driven etc.) and scaling numbers (Reynolds and Mach) optimize toward the same span, taper ratio, and similar airfoil thickness ratios as a function of span location. Figure 7 shows an overlay of the wing planforms of three endurance-centered UAVs that span over an order of magnitude in weight. Figure 8 shows the same wing taper angle and sweep effect for three jetliners that span almost a doubling of maximum takeoff weight.
Figure 7: Large endurance-focused UAVs have similar taper angles [4] [5] [6]
Figure 8: Jetliners (range and speed focused vehicles) have similar taper and sweep angle for similar cruise Mach
The intuitive explanation for the taper angle commonality is that the bending moment integrates from the wingtips inwards, which permits wings to grow inwards from the root until the wing is sufficiently large for the payload necessary as vehicles scale in payload mass and volume. Airfoil thickness ratios increase towards the root to contribute to increased bending-load carrying efficiency.
Figure 9 from [3] shows the optimum aspect ratio and wing loading for endurance-optimized UAVs as a function of size, showing that the aspect ratio is bounded within a fairly narrow window (between 11 and 19) across 5 orders of magnitude in mass.
Figure 9: Optimum Aspect Ratio and Wing Loading for endurance-driven UAVs [3]
AAM wing and tail molds (for both shell and spar) are over-length and tapered so that the span limits may be chosen freely during construction, as illustrated in Figure 10. By changing the location of the limits, the wing area and aspect ratio may be chosen freely while taper angle is fixed. Taper ratio is a dependent variable and can be set at some minimum to avoid tip stall issues arising from overly-aggressive tapering.
Figure 10: Wing mold and segmented usage
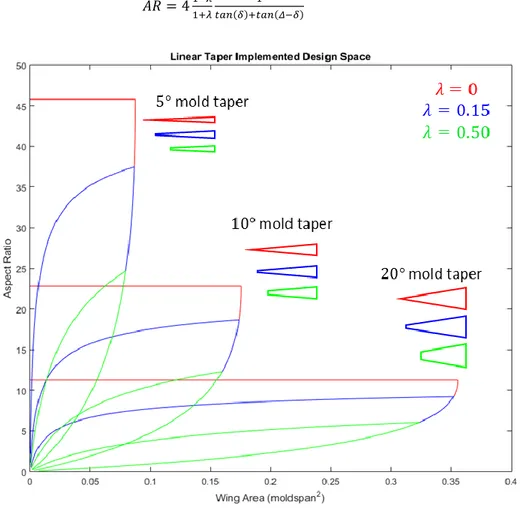
The amount of wing design space achievable by such a design is bounded as a function of the mold size, angle, and acceptable taper ratio. The variables shown below are illustrated in Figure 11:
Δ mold taper angle
𝛿 sweep angle
𝑐𝑡 tip chord
𝑐𝑟 root chord
𝜆 taper ratio, 𝑐𝑡⁄ 𝑐𝑟
Figure 11: Triangular mold geometry
Although the taper angle (Δ) is fixed, using this molding method allows each wing to vary in planform area and aspect ratio (within the design space covered by the mold). This relation is governed by Eq. (2). The amount of design space achievable (normalized by the moldspan squared) is shown in Figure 12.
𝐴𝑅 = 41−𝜆
1+𝜆 1
𝑡𝑎𝑛(𝛿)+𝑡𝑎𝑛(𝛥−𝛿) (2)
Figure 12: Achievable molding space of linear tapered mold
As is common for small composite aircraft, each wing or tail structure is constructed using three molds: one for the top skin, one for the bottom, and one for the spar. The upper and lower skin molds also act as alignment jigs for joining everything together. Shell thicknesses may be controlled freely as the number of composite layers is independent of the tooling and is held by the vacuum bag during curing. Figure 13 shows the layers of the wing and their molds. Figure 14 shows the wing structure of a single-seat sailplane constructed using this type of hollow construction.
Figure 13: Wing and tail molding schematic
Figure 14: Home-built aircraft wing during molding (left) and section (right) [7]
Because the molds produce the right and left wings separately, they must be joined together with a spar joiner which is molded separately. This component withstands the root bending loads of the wing spar and connects the wing to the wing collar, which in turn connects it to the rest of the aircraft through the SB, as shown in Figure 15 below.
Figure 15: two sizes of wing joiners (left) with wings (right)
1. Drawbacks of adaptable molding for wings and tails
Because the wings and tails are constructed using a common mold system, airfoil optimization to serve a single mission is not possible. Instead, the wing and tail mold airfoils must be designed to perform well over a relatively large range of operating conditions that any aircraft produced from these molds may experience. This necessarily results in airfoils that are slightly suboptimal for any given set of operating conditions.
III. Physical experiment
To demonstrate the feasibility and determine the performance tradeoffs of the AAM, an exercise was
conducted. First, two different aircraft missions with widely varying requirements were specified. A set of adaptable molds were designed and constructed to produce the vehicles to satisfy the missions. Then, a third set of mission requirements were introduced to demonstrate the AAM’s ability to respond to emergent requirements.
All three aircraft were constructed and flight-tested to obtain estimates on their performance. Lift-to-drag ratio was calculated using a glide test and endurance was estimated by analyzing battery drain rates. Their performance was compared to performance of three conventional baseline (CB) aircraft which are estimated using the weights of the components of the AAM aircraft and their drag estimates. Drag and structural penalties are subtracted from the
AAM aircraft which then allows the performance of the hypothetical CB aircraft to be estimated. Tooling cost for the CB aircraft is also calculated based on the production times measured from the construction of the AAM aircraft. A. Mission specifications of first two vehicles
1. “AAM 1”: Hand-launched, field-deployable UAV
The first mission requires a hand-launched, field-deployed UAV. The payload is specified to be a 0.25-lb sensor, such as a camera or atmospheric sensor. Endurance and dash speed were set as mission drivers. To demonstrate in-field deployability, this aircraft was required to be assembled without tools.
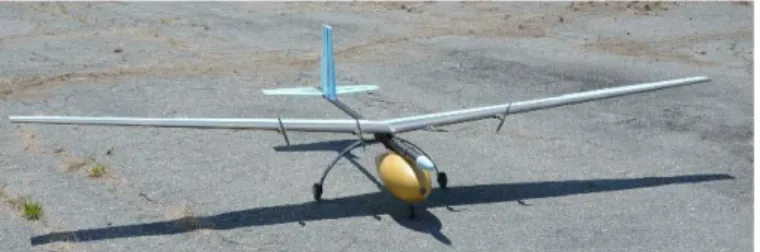
2. “AAM 2”: Ground-launched reconnaissance UAV
The second vehicle is designed to operate from a small airstrip and must take off in under 60 feet. The aircraft is designed to hold a larger, 2-lb payload, such as a communications relay or a high-definition reconnaissance camera. Maximizing endurance was set as the main mission driver. A wingspan limit of 130 inches was imposed to keep the aircraft within the size range of typical mid-size UAVs currently in production.
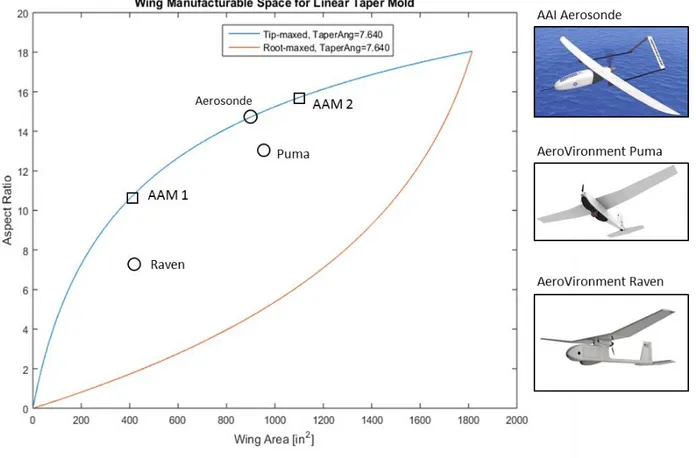
B. AAM mold
The molding space designed in response to the two mission requirements set above is shown in Figure 16 below. As the squares show, AAM 1 and AAM 2 are near the edge of the envelope. While the envelope could be tailored to higher aspect ratios, it was decided to keep the taper angle large to provide the ability to respond to missions requiring more wing area. Three commercial UAVs that are within this envelope are also plotted (circles).
Figure 16: Implemented wing mold space
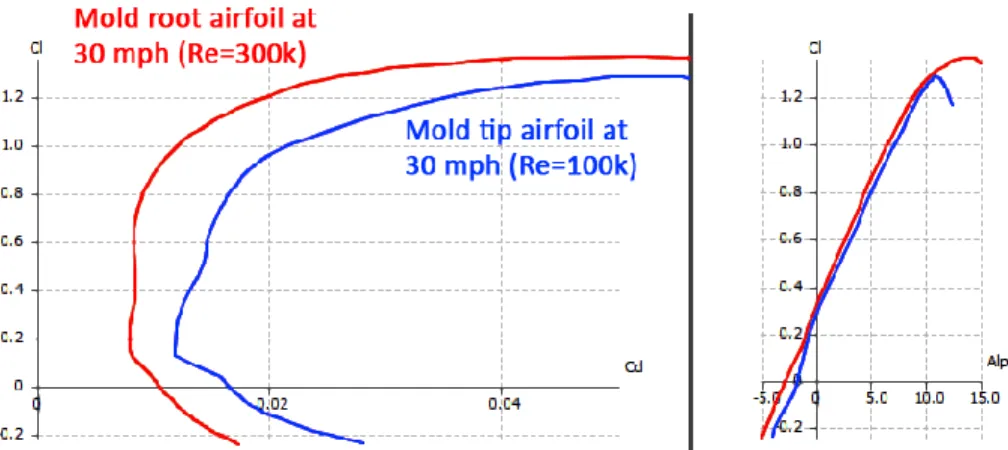
The airfoils built into the mold were selected for their broad performance range. The 𝐶𝑑 polar for the tip and
Figure 17: Cl-Cd polars for molded airfoils at 30 mph flight speed
Custom fuselage molds were constructed for each of the UAVs. COTS carbon fiber tubes were used to construct the spine tubes of the SB.
C. AAM 1 Physical Properties and Performance Results
In this instance, the modular construction complements the mission requirements, as the packing requirement was fulfilled easily by the splitting capability inherent to the AAM design. Figure 18 shows the component break-down of the UAV and Figure 19 shows the UAV in flight. The small UAV was produced using the tip-most section of the wing and tail molds, as shown in Figure 20. Table 1 below lists the key size and weight parameters of the AAM 1. Table 2 lists the estimated flight performance of the UAV.
Figure 18: CAD model showing disassembly of vehicle
Figure 19: Photograph of the small hand-launched UAV
Table 1: Key dimensions of AAM 1
Wingspan 72 𝑖𝑛
Length 44 𝑖𝑛
MAC 7.0 𝑖𝑛
Wing area 475 𝑖𝑛2
Wing aspect ratio 10.9
Full Weight 5.5 𝑙𝑏
Table 2: Performance of AAM 1
Max endurance 1.5 ℎ𝑜𝑢𝑟𝑠
Glide ratio 11.8
Climb rate 700 𝑓𝑡/𝑚𝑖𝑛
Stall speed 22 𝑚𝑝ℎ
Dash speed 70 𝑚𝑝ℎ
D. AAM 2 Physical Properties and Performance Results
AAM 2 was constructed using a larger segment of the mold, from the tip to 65” span. Larger tubes were used to create the SB. Table 3 lists the key size and weight parameters of AAM 2. The aircraft’s performance as calculated from flight test data is listed in Table 4.
Figure 21: AAM 2 UAV on runway
Figure 22: AAM 2 wing molding segment Table 3: Key dimensional parameters of AAM 2
Wingspan 130 𝑖𝑛
Length 67 𝑖𝑛
MAC 9.3 𝑖𝑛
Wing area 1111 𝑖𝑛2
Wing aspect ratio 15.2
Weight 16.1 𝑙𝑏
Table 4: Performance of AAM 2
Max endurance 2.6 ℎ𝑜𝑢𝑟𝑠
Glide ratio 12.4
Climb rate 760 𝑓𝑡/𝑚𝑖𝑛
Stall speed 27 𝑚𝑝ℎ
E. AAM 3: Multi-payload UAV Mission requirements
To demonstrate the ability of AAM to fulfill new missions, a third set of mission requirements was defined after tooling production was completed. The mission of the third aircraft was to carry two 1.lb payloads with at least 5-ft separation between them, with the goal of spacing the payloads out as far as possible. This payload scenario is analogous to a stereoscopic sensing mission. No dash speed requirement was set. No maximum span constraint was set. Maximizing endurance was the driving requirement.
F. AAM 3 Physical Properties and Performance Results
To maximize payload separation, the full mold span was used with the outboard payloads limited in span location by vehicle tipping when only a single payload is attached. To maximize production speed, no new molds were created. AAM 1’s fuselage pods were used to house the payloads near the wingtips, and the central pod from the AAM 2 was used as the central body to house the avionics and battery. Because no new tooling was created, the available battery capacity was set from AAM 2. To reduce weight, a new layup technique was used in which the internal fiberglass layer of the sandwich panel was replaced with a carbon fiber lattice, as shown in Figure 23. The aircraft’s performance was measured and projected using flight test data. The key metrics for flight with full battery and full payload are summarized in Table 5.
Figure 23: Vertical tail of AAM 3 showing carbon fiber lattice
Figure 24: AAM 3 in flight Table 5: Performance of AAM 3
Max endurance 1.9 ℎ𝑜𝑢𝑟𝑠
Glide ratio 12.2
Climb rate 570 𝑓𝑡/𝑚𝑖𝑛
Stall speed 28 𝑚𝑝ℎ
IV. Vehicle performance comparison
A. Penalty of AAM to Aircraft Performance
To determine the performance penalty caused by the AAM-design, the weight and performance of the three aircraft were compared against hypothetical “conventional baseline” (CB) aircraft that omit the SB components and instead uses conventional hollow-molding for all components.
To isolate the effect of the AAM, the CB aircraft is considered to have the same avionics, propulsion, landing gear, payload, wing, and tail as the AAM aircraft. Figure 25 illustrates the CB aircraft counterpart to an AAM aircraft. It is important to note that in this analysis, the same-geometry assumption means the CB aircraft is suboptimal and not completely independent of the AAM design. Therefore, this analysis should be considered to reflect a rough indication of the performance losses that can be expected, as the wings and tails in a conventional design are able to be optimized further than what is possible in the AAM.
Figure 25: CB aircraft (left) compared with AAM aircraft (right)
In this study, the metric of consideration for the comparison is vehicle endurance. To obtain an endurance estimate for the CB aircraft, first the weight of the AAM-enabling components are (SB, collars, joiners, landing gear, and rear fuselage shells) were removed from the weight calculation, and equivalently-performing conventional hollow-molded fuselages were designed to take their place. The CB rear fuselages were designed to provide the same stiffness as the tail booms of the AAM aircraft. The landing gear was scaled based on length, resulting in reduced weight for the landing gear. The result from the weight comparison is shown in Figure 26. On average, there is an 8% reduction in CB weight as compared with an AAM aircraft of the same wing and tail size.
The drag difference at cruise was calculated by starting with the drag of the AAM resulting from L/D
measurements, subtracting the SB’s frontal drag area and drag of excess landing gear length. Skin friction of the rear part of the fuselage beyond the length of the pod is then added. Changes in interference drag and differences in trim drag are not accounted for.
To calculate the endurance difference, a ratio in cruise speed was calculated based on the weight reduction presented in Figure 26 assuming the CB would fly at the same 𝐶𝐿. Then, the drag estimation as described above is
used with the new cruise speed to estimate a flight power requirement. Assuming the CB has the same propulsive efficiency and the same battery size of the AAM, the endurance of the CB aircraft is then calculated. The results are plotted in Figure 27.
Figure 27: Comparison of endurance of AAM and CB aircraft
It is estimated that, for the same aircraft geometry, an AAM vehicle can obtain approximately 83% of the endurance as its CB counterpart.
B. Effect on Manufacturing Cost of Fleet
To compare manufacturing cost between the set of AAM vehicles and the hypothetical CB vehicles, two metrics were considered – the volume of tooling material and the man-hours needed to machine and finalize the molds.
Mold material volume is used as a metric of comparison as the size of molds relates directly to their cost. The mold volume for the CB aircraft is calculated using the volume of a rectangular prism circumscribing the part the mold creates (with a mold wall margin of 0.5 inches).
The mold production time is composed of three stages – roughing (the phase in which the bulk of the material is removed from the mold stock), finishing (when the mill produces as smooth a surface as it is able), and detailing (when the mold is sanded, sealed, polished, and waxed). With this setup, the cost and time model captures the different production scaling trends of fuselages vs. wings and tails.
Mold roughing time is modeled to be directly proportional to the volume of material removed from the mold stock. Finishing and detailing are modeled as being proportional to the surface area of a mold. All scaling proportionality constants are derived from empirical production data. It is estimated that finishing and detailing requires 0.25 man-hours per square feet of mold surface area. It is assumed that other contributors to production cost (design, layup speed, integration, etc.) are constant between the two architectures. Because the CB production requires molds specific to each of the three aircraft, more material and production time is required, resulting in higher costs.
Table 6: AAM and CB manufacturing costs
AAM tooling CB tooling Ratio (AAM/CB)
Material volume (cubic inches) 17000 40000 42%
Man-hours 190 430 44%
From the cost analysis, we see that the AAM production strategy is much more economical, costing approximately 43% in both material and man-hours as compared to CB production for tooling production. It is important to note that this scaling ratio is only valid for the three aircraft produced. If additional missions were to be satisfied within the molding space of the AAM as-implemented, the AAM tooling cost would stay constant, and the CB tooling cost would increase in proportion to the number of new aircraft.
V. Conclusion and Discussion
This paper presents a study of an Adaptable Aircraft Manufacturing (AAM) concept that aims to reduce aircraft manufacturing cost and time while accepting some degradation in vehicle performance. The AAM is composed of two technologies: a structural bus on which components attach and a set of molds that can produce wings and tails of a range of areas and aspect ratios. While the structural bus does not scale well to larger vehicles, the adaptable molding does.
To demonstrate the feasibility of the AAM concept, three aircraft were built and flight-tested. Their
performance results were compared to the performance of hypothetical, conventional aircraft with the same wing and tail geometries. The tests revealed a decrease in performance of the AAM aircraft, but also a large decrease in the tooling cost and time of the AAM fleet as compared to conventional aircraft.
Due to the cost-scaling trends of the AAM aircraft, the strategy is extremely effective in a limited-budget, small-volume production environment where mission satisfaction time is more important than vehicle efficiency. If a large number of vehicles are to be produced, however, the performance penalty and slightly greater per-unit production cost will eventually outweigh the tooling cost reduction.
VI. Acknowledgements
This project was started as a part of the 2012-2013 undergraduate senior capstone design class in in the MIT Department of Aeronautics and Astronautics. The project was supported and advised by Daniel Patt of DARPA and various members of the MIT Lincoln Laboratory as part of the Beaver Works collaboration.
VII. References
[1] Willcox, K., 16.885 Aircraft Systems Engineering: Cost Analysis presentation, Cambridge, MA: MIT ACDL, 2004.
[2] Markish, J., "Valuation Techniques for Commercial Aircraft Program Design," Massachusetts Institute of Technology, Cambridge, MA, 2002.
[3] Drela, M. Protz, J.M., Epstein, A.H., "The Role of Size in the Future of Aeronautics," in AIAA International
Air and Space Symposium and Exposition: The Next 100 Years. , Dayton, Ohio, 2003.
[4] US Air Force, "MQ-1B Predator Fact Sheet," 23 September 2015. [Online]. Available:
http://www.af.mil/AboutUs/FactSheets/Display/tabid/224/Article/104469/mq-1b-predator.aspx. [Accessed 5 October 2015].
[5] US Air Force, "MQ-9 Reaper Fact Sheet," 23 September 2015. [Online]. Available:
http://www.af.mil/AboutUs/FactSheets/Display/tabid/224/Article/104470/mq-9-reaper.aspx. [Accessed 5 October 2015].
[6] US Air Force, "RQ-4 Global Hawk," 27 October 2014. [Online]. Available:
http://www.af.mil/AboutUs/FactSheets/Display/tabid/224/Article/104516/rq-4-global-hawk.aspx. [Accessed 5 October 2015].
[7] henryk, "Thread: Axel, Polish homebuilt glider," 30 March 2012. [Online]. Available:
http://www.homebuiltairplanes.com/forums/soaring/8565-axel-polish-homebuilt-glider-6.html. [Accessed 2 September 2015].
![Figure 1: Non-recurring hours in development of a commercial aircraft (normalized) [2]](https://thumb-eu.123doks.com/thumbv2/123doknet/14681181.559288/2.918.260.683.110.360/figure-non-recurring-hours-development-commercial-aircraft-normalized.webp)

![Figure 9: Optimum Aspect Ratio and Wing Loading for endurance-driven UAVs [3]](https://thumb-eu.123doks.com/thumbv2/123doknet/14681181.559288/6.918.201.718.491.801/figure-optimum-aspect-ratio-wing-loading-endurance-driven.webp)