Publisher’s version / Version de l'éditeur:
Electrophoresis, 26, March, pp. 1500-1512, 2005
READ THESE TERMS AND CONDITIONS CAREFULLY BEFORE USING THIS WEBSITE. https://nrc-publications.canada.ca/eng/copyright
Vous avez des questions? Nous pouvons vous aider. Pour communiquer directement avec un auteur, consultez la première page de la revue dans laquelle son article a été publié afin de trouver ses coordonnées. Si vous n’arrivez pas à les repérer, communiquez avec nous à PublicationsArchive-ArchivesPublications@nrc-cnrc.gc.ca.
Questions? Contact the NRC Publications Archive team at
PublicationsArchive-ArchivesPublications@nrc-cnrc.gc.ca. If you wish to email the authors directly, please see the first page of the publication for their contact information.
NRC Publications Archive
Archives des publications du CNRC
This publication could be one of several versions: author’s original, accepted manuscript or the publisher’s version. / La version de cette publication peut être l’une des suivantes : la version prépublication de l’auteur, la version acceptée du manuscrit ou la version de l’éditeur.
For the publisher’s version, please access the DOI link below./ Pour consulter la version de l’éditeur, utilisez le lien DOI ci-dessous.
https://doi.org/10.1002/elps.200410127
Access and use of this website and the material on it are subject to the Terms and Conditions set forth at
An automated, sheathless capillary electrophoresis-mass spectrometry
platform for discover of biomarkers in Human serum
Sassi, Alexander P.; Andel, Frank; Bitter, Hans-Marcus L.; Brown, Michael P.
S.; Chapman, Robert G.; Espiritu, Jeraldine; Greenquist, Alfred C.; Guyon,
Isabelle; Horchi-Alegre, Mariana; Stults, Kathy L.; Wainright, Ann; Heller,
Jonathan C.; Stults, John T.
https://publications-cnrc.canada.ca/fra/droits
L’accès à ce site Web et l’utilisation de son contenu sont assujettis aux conditions présentées dans le site LISEZ CES CONDITIONS ATTENTIVEMENT AVANT D’UTILISER CE SITE WEB.
NRC Publications Record / Notice d'Archives des publications de CNRC:
https://nrc-publications.canada.ca/eng/view/object/?id=49c1577d-d971-42fd-9946-74b1d1db33f9
https://publications-cnrc.canada.ca/fra/voir/objet/?id=49c1577d-d971-42fd-9946-74b1d1db33f9
Alexander P. Sassi1
Frank Andel III1
Hans-Marcus L. Bitter1 Michael P.S. Brown1 Robert G. Chapman1 Jeraldine Espiritu1 Alfred C. Greenquist1 Isabelle Guyon2 Mariana Horchi-Alegre1 Kathy L. Stults1 Ann Wainright1 Jonathan C. Heller1 John T. Stults1 1
Predicant Biosciences, Inc., South San Francisco, CA, USA
2Clopinet,
Berkeley, CA, USA
An automated, sheathless capillary
electrophoresis-mass spectrometry platform for
discovery of biomarkers in human serum
A capillary electrophoresis-mass spectrometry (CE-MS) method has been developed to perform routine, automated analysis of low-molecular-weight peptides in human serum. The method incorporates transient isotachophoresis for in-line preconcentra-tion and a sheathless electrospray interface. To evaluate the performance of the method and demonstrate the utility of the approach, an experiment was designed in which peptides were added to sera from individuals at each of two different con-centrations, artificially creating two groups of samples. The CE-MS data from the serum samples were divided into separate training and test sets. A pattern-recogni-tion/feature-selection algorithm based on support vector machines was used to select the mass-to-charge (m/z) values from the training set data that distinguished the two groups of samples from each other. The added peptides were identified correctly as the distinguishing features, and pattern recognition based on these peptides was used to assign each sample in the independent test set to its respective group. A twofold difference in peptide concentration could be detected with statistical significance (p-value , 0.0001). The accuracy of the assignment was 95%, demonstrating the utility of this technique for the discovery of patterns of biomarkers in serum.
Keywords: Biomarkers / Capillary electrophoresis / Serum / Sheathless electrospray / Time of
flight-mass spectrometry DOI 10.1002/elps.200410127
1 Introduction
As part of the quest to understand the complex mechan-isms that control and regulate the human body, scientists are studying the proteome – essentially the quantitative distribution of proteins in the human body. It is well-known that certain proteins change in concentration in response to specific diseases. Knowledge of these proteins’ con-centration changes may be used to detect the onset of disease prior to the observation of symptoms in a patient. A molecule used to determine a disease state is termed a biomarker. Single biomarkers have been used to diagnose disease for many years; however, as Anderson and Anderson [1] have noted, some widely used single-protein diagnostic tests have a specificity of only approximately 60%, and the rate of introduction of new FDA-approved
single-protein tests is declining. It is likely that sets or pat-terns of multiple biomarkers may exist for a specific dis-ease; these sets may then be used to differentiate popula-tions (for example, those with cancer and those without) with high sensitivity and high specificity. A biomarker is validated by demonstrating that it can be used to differ-entiate populations that were not used in its discovery. However, a biomarker needs not be causal or involved mechanistically in the disease process. Once discovered, these biomarkers can be used for many purposes, includ-ing diagnosinclud-ing disease and monitorinclud-ing treatment and recurrence. The challenge, then, is how to discover and validate these biomarkers in a relatively efficient manner. To meet this challenge, an analytical technique must separate and detect as many components as possible. It must be robust to the typical biological variation in physi-cochemical properties of the sample. It must perform in the same manner from analysis to analysis. It must be eco-nomical in time, effort, and expense.
Mass spectrometry has emerged as a key technology for biomarker analysis [2–6]. Capillary electrophoresis-elec-trospray ionization-mass spectrometry (CE-ESI-MS) is a particularly attractive approach for discovery of bio-markers; in fact, it has already been reported for the dis-covery of biomarkers in human urine and serum [7–10]. CE
Correspondence: Dr. Alexander P. Sassi, Predicant
Bio-sciences, Inc., 201 Gateway Boulevard, South San Francisco, CA 94080, USA
E-mail: asassi@predicant.com Fax: 1650-952-0911
Abbreviations: ACN, acetonitrile; LPC,
lysophosphatidylcho-line; MAPTAC, methacryloylaminopropyl trimethylammonium chloride; SVM, support vector machine; tITP, transient isotacho-phoresis; ZE, zone electrophoresis
can separate complex mixtures with high resolution in typically less than 1 h. Techniques are available to con-centrate the sample on-line in order to boost sensitivity [11–13]. It is easily automated, and its coupling to MS via ESI has been described by many authors [7, 14–22]. How-ever, the routine, automated use of CE-MS is not without challenges [17]. Foremost is the robust transfer of analytes from the separations (CE) capillary to the inlet of the mass spectrometer via electrospray. Many different types of ESI interfaces have been reported for the coupling of CE to MS [18, 22–35]. In general they fall into three classes: (i) sheathless interfaces, wherein the separations capillary is connected directly to an electrospray emitter (tip), (ii) junction interfaces, where there is a small liquid-filled gap between the separations capillary and the emitter, and (iii) sheath-flow interfaces, wherein the end of the separations capillary is enclosed within another capillary through which flows a constant supply of sheath liquid. In a sheath-flow interface, a conventional syringe pump drives the fluid flow, insuring a stable spray. As such, sheath-flow interfaces have been reported to operate more robustly than sheathless interfaces [17, 28, 36]. It is also reported, however, that sheath-flow interfaces are less sensitive than sheathless interfaces [16, 19, 28, 32, 33]. As the ana-lytes migrate into the sheath fluid, they are diluted, and the resulting loss of signal varies by component.
Here we report our use of a sheathless ESI interface to couple CE to a time-of-flight (TOF) mass spectrometer for the automated separation and detection of intact poly-peptides in human serum (see Sections 2–3.1). We choose to use a sheathless interface for its inherent sen-sitivity. To further increase the sensitivity of the technique, we employ transient isotachophoresis (tITP) to con-centrate the sample on-line. Our objective is to demon-strate the utility of our technique for the discovery of bio-markers in human serum in a model system. This demonstration will reveal the performance of the system and give us confidence in its ability to discover bio-markers in future clinical studies. In our model system, (see Sections 3.2–3.5), 13 polypeptides are added as mock ‘biomarkers’ at predetermined levels to each of two groups of human sera. To test the system’s performance, we use threefold cross-validation, where two-thirds of the resulting mass spectra from CE-MS analysis are used to train an algorithm to recognize (discover) a priori the pat-tern of polypeptides (‘biomarkers’) that distinguishes one group from the other. The trained algorithm is then used to classify the remaining data as belonging to one group or the other. Using this methodology, we were able to detect a twofold difference in the concentration of peptides added into human serum at the 100 nMlevel and could
detect other components present in serum at 10 nM(fmol/ mL). These concentration levels correspond to expected
molar concentrations of tissue leakage proteins in human plasma. Our algorithms correctly identified the pre-added polypeptides as the ‘biomarkers’ for the two groups of sera. Using the identified polypeptides, the algorithms classified samples with 95% accuracy.
2 Materials and methods
2.1 ReagentsGlacial acetic acid (991%), formic acid (96%), 5.02 N
ammonium hydroxide volumetric standard, ammonium persulfate (APS), 7-oct-1-enyltrimethoxysilane, 3-metha-cryloylaminopropyl trimethylammonium chloride (MAP-TAC), and TEMED were purchased from Sigma-Aldrich (St. Louis, MO, USA). Human angiotensin I, angiotensin II, [Val5] angiotensin II, angiotensin III, bovine lung aprotinin,
bradykinin, bovine heart cytochrome c, [D-Ala2,D-Met5] enkephalin, bovine pancreatic insulin b-chain (oxidized), bovine pancreatic insulin, chicken egg white lysozyme, luteinizing hormone releasing hormone fragment 1–6 amide (LHRH), melittin, equine skeletal myoglobin, neu-rotensin, oxytocin, porcine N-acetyl renin substrate tet-radecapeptide, Substance P, bovine erythrocyte ubiqui-tin, and [Arg8]-vasopressin were also obtained from
Sigma Chemicals. GC-MS-grade methanol, HPLC-grade acetonitrile (ACN), high-purity acetone, and HPLC-grade water were obtained from Honeywell Burdick and Jack-son (Muskegon, MI, USA). Sodium hydroxide (10M) was obtained from JT Baker (Phillipsburg, NJ, USA). eCAP
Neutral Marker was obtained from Beckman Coulter (Fullerton, CA, USA) and diluted 100-fold in ACN. Individ-ual human serum samples were obtained from Golden West Biologicals (Temecula, CA, USA). For methods development work, pooled normal human serum was obtained from Sigma Chemicals. A 50 mL aliquot of serum is used for each sample. The high-abundance, high-mo-lecular-weight proteins are removed by ultrafiltration through a Microcon YM50 membrane (Millipore,
Bill-erica, MA, USA). The filtrate is concentrated and desalted by adsorption from 5% ACN/0.1% acetic acid on a C8 Opti-Guard
column (Optimize Technologies, Oregon City, OR, USA). The column is washed multiple times with 5% ACN/0.1% acetic acid to remove salt before the sample is eluted in 20 mL 70% ACN/0.1% acetic acid. Processed serum samples are stored at 2207C until use. The set of peptides used to evaluate recovery after ultra-filtration and desalting consisted of angiotensin II, [Val5]
angiotensin II, [D-Ala2,D-Met5] enkephalin, oxytocin, and
[Arg8] vasopressin; these peptides were selected
be-cause they were resolvable from endogenous peptides by HPLC.
CE
and
2.2 Instrumentation
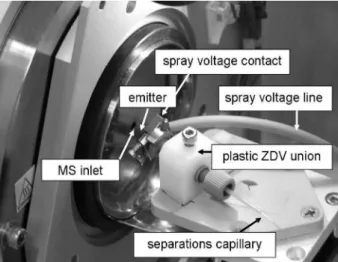
The CE-ESI-MS system used in this work was assembled from a combination of commercially available and custom-built instrumentation. Briefly, it consists of a Beckman P/ ACE MDQ (Beckman Coulter) with a cooled sample ga-rage and an EDA cartridge to allow the separations capil-lary to exit the instrument to the mass spectrometer. Figure 1 is a photograph of the electrospray interface. The separations capillary was mated to the electrospray emit-ter via an ADPT-PRO nanoelectrospray adapemit-ter (New Objective, Woburn, MA, USA) according to the instruc-tions provided by the manufacturer. Briefly, the ends of the separation capillary and spray emitter are inserted into a plastic, zero-dead-volume union and sealed in place with plastic finger-tight screws and sleeves. Voltage was applied via a metal adapter which contacted the con-ductive coating on the distal end of the emitter. The inter-face was mounted on a xyz-positioning stage to allow adjustment of the emitter position relative to the inlet of the mass spectrometer. A CCD camera (Model KP-M22AN, Hitachi Kokusai, Japan) was mounted to enable visualiza-tion of the spray and the posivisualiza-tion of the emitter tip. For work with human serum, the interface was enclosed in a non-airtight chamber as an added measure to contain stray or excess aerosol. The chamber was vented to the building fume hood exhaust system. The presence of this enclo-sure was not observed to affect the separation.
Fused-silica capillaries (360 mm OD, 50 mm ID) were pur-chased from Polymicro Technologies (Phoenix, AZ, USA). The inner surface was cleaned and derivatized with
Figure 1. Photograph of electrospray interface in
posi-tion on the Mariner mass spectrometer. The conductive coating on the distal end of the emitter is in direct contact with the spray voltage contact. The emitter itself extends from the plastic zero dead-volume (ZDV) union through the spray voltage contact towards the inlet capillary of the Mariner instrument.
MAPTAC according to a variation of the procedure of Kelly et al. [16]. This produced a hydrophilic, positively charged coating on the inner surface. Briefly, the capillary is rinsed with sodium hydroxide for 45 min, water for 45 min, and methanol for 15 min to clean the surface. Next, the surface is silanized by pumping a 0.5% v/v solution of 7-oct-enyl-trimethoxysilane in anhydrous methanol through the capil-lary for 12 h, followed by 15 min rinses with methanol and water. Polymerization was performed by pumping an aqueous solution of 0.2% v/v TEMED, 0.07% w/v APS, and 5% w/v MAPTAC through the capillary for 18 h. After deri-vatization with poly-MAPTAC, the capillaries were rinsed with water for 1 h and stored wet at 47C until use. Typically, a single batch consisted of two , 3 m lengths of capillary. The electroosmotic flow (EOF) was measured under standard-ized conditions on a segment from each batch of poly-MAPTAC-derivatized capillary and found to vary by less than 5% batch-to-batch. Fused-silica electrospray emitters were purchased from New Objective and derivatized with poly-MAPTAC according to the procedure described above. The emitters used for the pattern recognition experiment (TT360-50-5-D-5) were purchased with a con-ductive coating applied to the distal end. The frontal (tip) end is tapered from the outer diameter of 360 mm to the inner diameter of 50 mm. After derivatization, emitters were stored submersed in water until use. To extend the lifetime of the emitter to between one and five days of constant use, we developed a careful procedure to cut, trim, and clean the emitter. Before use, emitters were rinsed with acetone and cut carefully to 3 cm. The cleaned and cut emitters were inspected under a microscope for the integrity of the poly-imide and conductive coatings at the cut end of the emitter. Any overhanging coating material was carefully removed under microscope observation with a dental pick. Damaged emitters were not used and were discarded.
In the development of the separations methodology, an ABI Mariner (Applied Biosystems, Foster City, CA, USA) TOF mass spectrometer was used as the detector. For the pat-tern recognition experiments involving serum, an in-house-constructed orthogonal TOF mass spectrometer with a two-stage ion reflector was used [37]. In this instrument, ions were introduced into the extraction chamber after passing through an electrodynamic ion funnel/collisional quadropole assembly, selection quadropole, and an Einzel lens arrangement. The home-built mass spectrometer was con-trolled and data acquired using software developed in a LabView environment (National Instruments, Austin, TX, USA). The m/z resolution was typically 3500 for the 1 3 charge state of neurotensin. When performing CE-MS in automated mode, we incorporated a relay-open step in the electrophoresis method file to trigger mass spectral data acquisition. Instrument-specific parameters for the P/ACE MDQ and TOF-MS were controlled independently.
2.3 CE-ESI-MS run conditions
Electrophoresis was performed in a 65 cm capillary coated internally with poly-MAPTAC. The MDQ was grounded to the chassis of the mass spectrometer, and a negative separation voltage was applied at the injection end of the capillary by the MDQ. A positive spray voltage was supplied at the electrospray interface by a power supply in the mass spectrometer. The current capacity for the spray voltage power supply is several milliamperes, 1000-fold greater than the electrophoresis current. While developing the methodology, the electrospray voltage was adjusted manually between 1 2 and 1 3 kV for opti-mal spray stability and signal, and the separation voltage was 230 kV. Spray instabilities were caused most com-monly by improper preparation or installation of the emit-ter or by high levels of lysophosphatidylcholine in the sample. If spray instabilities were observed, data were not collected, and the emitter was replaced. For the pat-tern recognition experiment, the separation voltage was set at 230 kV, and the electrospray voltage was set at 1 2.3 kV, and therefore, all separations were performed at the identical voltage gradient. The run buffer was 60 mM
acetic acid in 20% methanol (pH 3.2), and the stacking solution was 25 mMammonia in run buffer (pH 4.7). For the pattern recognition experiment, serum was injected for 5 s at 9.5 psi followed by the stacking solution for 5 s at 4.8 psi. Under these conditions, the flowrate was ap-proximately 280 nL/min, and the EOF was apap-proximately 5 6 1024cm2
/V?s. To reduce evaporation, the bottom of a 2 mL Beckman P/ACE sample vial was filled with 350 mL run buffer. The serum sample was transferred into a 200 mL PCR vial, suspended on a spring inside the 2 mL vial, and capped before loading into the sample tray of the P/ACE MDQ. The sample garage of the MDQ instrument was kept at 47C. Before each injection of serum, the cap-illary was rinsed and conditioned by a series of five pres-sure rinse steps each performed for 2 min at 20 psi. The five solutions were in sequence: 75 mMammonia in run
buffer (pH 9.2), 1.8Mformic acid (pH 1.6), water, 60 mM
acetic acid, and run buffer. The mass spectrometer was operated in positive ion mode at a data acquisition rate of three seconds per spectrum. Spectra were acquired for m/z from 0 to 2000 Th.
3 Results and discussion
3.1 CE-ESI-MS method development
Because we intend to use CE-MS to discover biomarkers, we wished to develop a robust method that was as sen-sitive as possible. Sheathless interfaces are reported to give better limits of detection because the analytes are
not diluted by the sheath fluid. To obtain the best possible overall sensitivity, we chose to investigate how to make a sheathless interface operate robustly, and we chose to implement an in-line sample ‘stacking’ procedure as part of our separation. In the following sections we summarize the development of the method we used to perform automated CE-MS on serum samples over a multi-day period.
3.1.1 Serum preparation
Because the targets of our biomarker discovery project are peptides and small proteins, we developed a proce-dure to deplete the serum of proteins larger than 50 000 MW. In doing so, we effectively remove the major-ity of the high-abundance proteins, such as serum albu-min and immunoglobulins G, which could overwhelm lower-abundance peptides of interest. Eight proteins alone constitute approximately 90% of the 60–80 milli-grams of protein per milliliter serum [38, 39]; these high-abundance proteins are of little interest to us. Our proce-dure also effectively desalts the sample to reduce the conductivity of the sample and to avoid the possible for-mation of salt adducts in the electrospray. More than 99% of the high-abundance proteins were removed, as deter-mined using the Bradford assay. To characterize the recovery of lower-molecular-weight peptides, we added a standard set of low-molecular-weight peptides into serum at known concentrations and determined the yield by HPLC with UV detection. Recovery of spiked peptides varied by peptide and on average was 85% (range: 70– 100%).
3.1.2 Capillary electrophoresis
The use of ESI-MS as a detection method for CE imposes well-known restrictions on the choice of buffer and capil-lary chemistry [40]. For example, to minimize blocking the MS inlet and to minimize the formation of salt adducts, only volatile components are used in the separation buf-fer. For maximum sensitivity, components that compete with analytes for charge in the electrospray are excluded from the run buffer to minimize signal loss due to ion suppression. Furthermore, the composition of the buffer must be chosen so as to support stable electrospray at the given flow rate of the separation. Optimal choices for buffer components are water, volatile organics (commonly acetonitrile or methanol), and volatile acids (commonly acetic or formic acid). When there is no sheath flow, the flow that supports the electrospray is supplied by the EOF generated in the separations capillary. As we were oper-ating the MS in positive-ion mode, we decided to modify the inner surface of the separation capillary with the
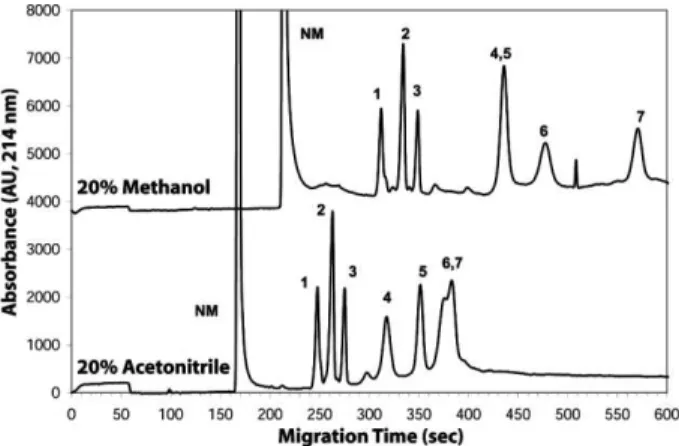
covalently linked, hydrophilic, positively charged coating poly-MAPTAC. Thibault and co-workers [16] have report-ed previously the utility of this coating chemistry for CE-MS of peptides. The fixed positive charge on the coating generates the required electroosmotic flow, and we expect that the combination of fixed positive charge and hydrophilicity of the coating minimizes adsorption of the primarily positively charged components of serum. As the serum samples are eluted in ACN, we first investi-gated using aqueous solutions of acetic acid or formic acid and ACN (0–40%) as the separation buffer. However, we obtained better separations in aqueous methanolic systems, as illustrated by the separations of peptides and small proteins in Fig. 2. The first three peptides are sepa-rated approximately equally well in both ACN and meth-anol-containing solutions; however, the later-migrating proteins are better resolved in the methanolic solution. We investigated a range of different concentrations of methanol (0–40%) and acetic acid (20–80 mM) for their
ability to separate a standard set of peptides and proteins and for the stability of electrospray. We found that using 20% methanol and 60 mM acetic acid gave the best
combination of resolution, run-time, and electrospray performance.
To minimize concerns of sample-to-sample carry-over from adsorption of serum components and to improve the reproducibility of migration times from run-to-run, we developed and implemented a capillary rinsing and con-ditioning procedure. This procedure consists of rinsing the capillary with alkaline and acidic solutions and then
Figure 2. Separation of a mixture of three peptides and
four proteins in acetonitrilic (bottom trace) and methanolic (top trace) solutions. In each case, the concentration of acetic acid was 60 mM. Electrophoresis was performed at 500 V/cm in a 60 cm, 50 mm ID poly-MAPTAC-treated capillary. Detection was by UV absorbance at 214 nm, 50 cm from the injection end. Composition: (NM) 0.0016 eCAP
Neutral Marker, (1) neurotensin, (2) angiotensin I, (3) bradykinin, (4) carbonic anhydrase, (5) ribonuclease A, (6) myoglobin, and (7) cytochrome c.
conditioning the surface by flushing with water, dilute acetic acid and, finally, the separation buffer. For the rinsing solutions, we first used sodium hydroxide and hydrochloric acid, as other authors have used for separations of serum components [11, 41]. However, we found that even with the subsequent flushing steps, enough sodium and chloride ions were retained in the system to create detectable sodium and chloride adducts of serum components. To eliminate these undesired adducts, we replaced sodium hydroxide and hydrochloric acid with ammonium hydroxide and formic acid.
Many choices exist for concentrating samples in-line in CE; for example, field-induced sample stacking [11, 12, 42], transient isotachophoresis [13, 27, 40, 43, 44], in-line reversed-phase chromatography columns [11, 12, 45– 47], membrane preconcentration [20, 40, 48], etc. We chose to implement a tITP step to concentrate relatively large injection volumes of serum for its simplicity. Our serum sample is complex and reasonably concentrated, containing many separable components detectable by UV absorbance (214 nm). We mention this because we are applying an in-line concentration step to maximize the number of dilute species that we can detect in a back-ground of more concentrated species.
To implement tITP-zone electrophoresis (ZE), we inject a plug of the ammonium stacking solution after injecting the sample [13, 17]. The injection end of the capillary is then replaced into the vial containing separation buffer and the voltage applied, causing the analytes to stack transiently into a narrower zone and then separate by ZE (tITP-ZE). An example of the gain in signal by UV detection is shown in Fig. 3 for a simple set of peptides and small proteins. For these analytes, the signal intensity increases approx-imately tenfold upon injecting 13 times more sample and implementing tITP-ZE. Although the injected volume is stacked into a zone that separates into fairly symmetrical peaks, some resolution is lost.
A concern for MS detection is whether the gain in total number of detectable and quantifiable species achieved by injecting more sample is offset by ion suppression resulting from the loss of electrophoretic resolution be-tween species. An absolute answer to this question can be ascertained with an algorithm that accurately counts the total number of species detected in a CE-MS run. We are presently optimizing such an algorithm and plan to report on this topic in further detail in a forthcoming pub-lication.
In the absence of this algorithm, we performed a series of CE-MS experiments in which we varied the amount of sample injected and performed either ZE alone or
tITP-Figure 3. Tradeoff of signal gain and resolution for ZE versus tITP-ZE separations. Approximately 13-fold more sample was loaded for the tITP-ZE separation, resulting in an improvement of 10- to 14-fold in signal. Electro-phoresis was performed in 20% methanol/60 mMacetic acid at 500 V/cm in a 60 cm, 50 mm ID poly-MAPTAC-treated capillary. Detection was by UV absorption at 214 nm at 50 cm from the injection end. For the ZE run, sample was injected for 6 s at 1 psi. For the tITP-ZE run, sample was injected for 8 s at 9.5 psi, followed by an 8 s, 9.5 psi injection of the stacking solution. Components, each at 10 mg/mL: (1) neurotensin, (2) angiotensin I, (3) bradykinin, (4) carbonic anhydrase, (5) myoglobin, (6) cytochrome c.
ZE. We also optimized the ammonia concentration (20–80 mM) and the ratio of sample-to-stacking plugs to
give a combination of reasonable resolution and signal gain. We found that we could obtain a modest (as much as 5-fold) increase in signal, which varied from com-ponent to comcom-ponent, by injecting the sample for 5 s at 9.5 psi and injecting the stacking solution for 5 s at 4.8 psi.
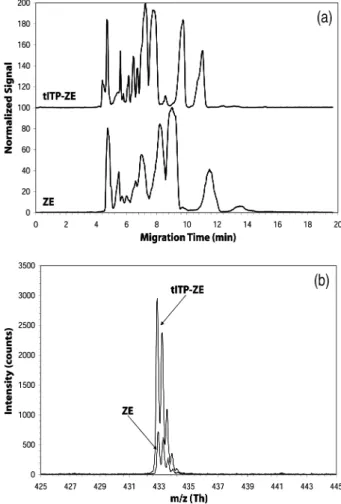
Figure 4a shows a comparison of the base peak intensity (BPI) trace for serum separated by ZE (lower trace) and that separated by tITP-ZE (upper trace). For the runs il-lustrated in Fig. 4, the amount of injected serum and run conditions (applied voltage, capillary, buffer, etc.) were the same. By extracting ion electropherograms for indi-vidual components, we find that indiindi-vidual components typically have a narrower peak width and a higher signal in the tITP-ZE data. For example, the maximum intensity for angiotensin I (m/z 432.9, 13 charge state) is approxi-mately four times greater with tITP (,2950) than without (,720) (Fig. 4b).
The mechanism of stacking is likely a combination of several effects. The ammonium ion has a faster mobility than the serum components, and therefore we expect the
Figure 4. (a) Comparison of BPI traces for pooled human
serum separated by ZE (lower trace) and by tITP-ZE (upper trace). Signal displayed is relative to a value of 100 for the maximum intensity in the data set. (b) Comparison of spectra where angiotensin I (m/z 432.9) has its max-imum intensity for the two separations shown in (a). The spectrum for the ZE separation lies within that for the tITP-ZE separation. Angiotensin I was added to human serum before processing the serum.
serum components to stack against the ammonium ion boundary for as long as ITP conditions persist local to the sample zone. In addition, the pH of the ammonium solu-tion is more basic than that of the sample, and therefore peptides that migrate through the boundary into the ammonium zone will become less positively charged and slow, also causing the stacking to occur at the boundary with the ammonium zone.
We investigated the run-to-run reproducibility of our tITP-ZE method by performing ten sequential separations of a mixture of three peptides and three proteins with UV detection. The coefficient of variation (CV) of migration time varied by component and was on average ,0.5% (range: 0.3–0.7%). The CV for peak intensity was on average 6.8% (range: 4–9%).
3.1.3 Electrospray interface
In a sheathless electrospray interface, the separations cap-illary is most often coupled directly to the electrospray emit-ter in a union, and the spray voltage is supplied either at the junction or at the tip. When we used a frontally coated elec-trospray emitter (SilicaTips: New Objective) and applied the spray voltage to the tip, we experienced frequent electrical arcing from the emitter to the mass spectrometer. The arcing destroyed the conductive coating and rendered the emitter useless. We therefore abandoned frontally coated emitters in favor of applying the voltage at the junction between the separations capillary and the emitter.
We tested three ways to apply the voltage to the fluid in the emitter: (i) use of a distally coated emitter from New Objec-tive, (ii) use of a stainless steel union to join an uncoated emitter and capillary, and (iii) use of a t-junction in which a platinum or palladium wire was inserted perpendicular to the capillary-emitter axis. The metal union was easy to assemble and use; however, we observed undesirable contaminant peaks, hypothesized to arise from iron-acid interactions. In our hands, the t-junction was less robust than the distally coated emitters from New Objective. The construction of the interface did not affect the resulting electropherogram significantly except for gross loss of res-olution due to clogging, spray instability, or failure.
We tested emitters where the tip is drawn to a smaller inner diameter (SilicaTips) and emitters where only the external (outer) diameter is tapered (TaperTips). We found that an externally tapered tip with 50 mm ID (equivalent to the ID of the separations capillary) performed best, as tips with inner diameters of 8–30 mm were prone to clogging. To make the emitter perform more robustly, we found that it was critical to coat the inner surface of the emitter with poly-MAPTAC and clean and cut the emitter carefully and meticulously. By so doing, the lifetime of a single, coated emitter was extended to between one and five days of continuous use. For best signal, the emitter was on-axis with the inlet capillary, and the tip was placed approxi-mately 2 mm from the MS inlet. Under operating condi-tions, a stable (Taylor) cone of fluid, resembling the tip of a sharpened pencil, was present at the end of the emitter.
3.2 Design of pattern recognition experiment
Our overall goal was to design an experiment to assess to what extent we could distinguish and classify serum samples based on patterns of component intensities. Our objectives were the following: (i) characterize the perfor-mance of the system, (ii) determine what fold differences in concentration could be determined, and (iii) gauge how well samples could be classified based on a set of
com-ponents spiked into the serum at different levels. This required relative quantitation; i.e., we wanted to detect relative differences in concentration of selected peptides in a complex background of serum peptides and proteins.
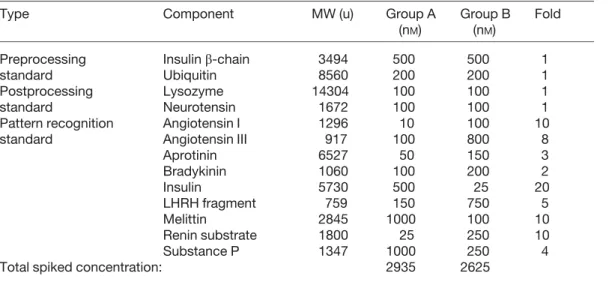
A total of 76 CE-MS analyses were planned on 18 indi-vidual human serum samples and 8 pooled serum sam-ples. Each sample was analyzed two to five times, in ran-dom order. The pooled serum samples were made by combining an aliquot of each individual sample to elim-inate effects caused by biological variability between individuals. We added one of two specific sets of 13 polypeptide standards in predetermined amounts to each sample, thus creating two sample groups, A and B. The peptides were chosen to separate well from each other by electrophoresis and to span a range of molecular weights and mobilities populated by the majority of low-molecu-lar-weight serum components. The final concentration of each peptide in each sample group is given in Table 1.
The range of mass concentrations of proteins in plasma spans at least ten orders of magnitude [1]. Many of the high-concentration proteins are also relatively large and are easily analyzed by other existent, classical technolo-gies. In this work, peptides and small proteins were added to serum at concentrations within the range for tissue leakage proteins, the second most abundant general class of proteins, as defined in the review of the human plasma proteome published by Anderson and Anderson [1].
Two components, neurotensin and lysozyme, were added after sample processing and before CE-MS analysis as standards that could be used to characterize the performance of the CE-ESI-MS methodology. These components, the postprocessing standards, were added to a final concentration of 100 nMin each sample. All other peptides and proteins were added before any processing was performed on the serum sample. Two of these, ubi-quitin and insulin b-chain, were added to each sample at 200 nM and 500 nM, respectively, in the starting serum
volume. The other nine peptides and proteins were added at different levels in Group A samples than in Group B samples to emulate a different pattern of peptide con-centrations between the two groups.
The difference in concentration of each of the nine ‘pat-tern recognition standards’ between the two groups var-ied from two- to twentyfold. The concentrations in Group A and Group B were chosen so that similar total molar amounts of peptides were added to each group of sam-ples. The purpose of adding neurotensin, lysozyme, ubi-quitin, and insulin b-chain at equivalent concentrations in all samples is to serve as a control for pattern recognition; these four peptides should not be identified as compo-nents that distinguish the two groups of samples.
Table 1. Concentration of standards spiked into Group A and Group B samples
Type Component MW (u) Group A
(nM)
Group B (nM)
Fold
Preprocessing Insulin b-chain 3494 500 500 1
standard Ubiquitin 8560 200 200 1
Postprocessing Lysozyme 14304 100 100 1
standard Neurotensin 1672 100 100 1
Pattern recognition Angiotensin I 1296 10 100 10 standard Angiotensin III 917 100 800 8
Aprotinin 6527 50 150 3 Bradykinin 1060 100 200 2 Insulin 5730 500 25 20 LHRH fragment 759 150 750 5 Melittin 2845 1000 100 10 Renin substrate 1800 25 250 10 Substance P 1347 1000 250 4 Total spiked concentration: 2935 2625
Calculated monoisotopic masses are reported for all components.
3.3 Performance of tITP-ZE-ESI-MS methodology in the pattern recognition experiment
We performed the CE-MS runs in an automated mode, with ten samples loaded into the autosampler at a time. At the start of every day, we conditioned the system with three runs of a standardized serum sample and then ran a stand-ard set of eleven peptides to monitor the separation performance and signal intensity. If fluid wicked back along the emitter tip, or if the signal could not be brought to within 10% of the typical signal for the set of eleven peptides, the emitter was discarded and replaced with a new one. Figure 5 shows the 3-D data from a run of individual serum displayed in a 2-D format, with m/z increasing from right to left, and separation time increasing from
bottom to top; black indicating high intensity and white, zero intensity. The format is analogous to an image of a 2-D separation of proteins on a polyacryl-amide gel; each serum component in our separation appears as one or more spots or lines, according to the number of charge states resolved and detected (this image does not have sufficient resolution to dis-play the isotopic resolution of the components). Based on manual inspection of mass spectra for a repre-sentative separation, we estimate that we are detecting approximately 500 unique components (peptides, pro-teins, or other metabolites). In general, only one or two charge states are detected for smaller peptides, such as neurotensin, whereas multiple charge states are observed for proteins, such as residual human serum albumin.
Figure 5. Representation of CE-MS data for human serum in a 2-D format. Black corre-sponds to high intensity. Each vertical segment represents a single charge state of a compo-nent. Proteins can be recog-nized by their charge envelopes, which appear as a set of lines spaced along the m/z axis. Data was collected for an individual serum sample during the pat-tern recognition experiment.
In eight samples, we observed high levels of a component at m/z 496.3, confirmed subsequently as L-a-palmitoyl
lysophosphatidylcholine (LPC), whose presence corre-lated to membrane failure caused by the lower angle of one of the rotors used during the centrifugation step. At a high level, LPC dominates the total ion electropherogram over a relatively large fraction of the separation. There-fore, samples containing LPC were removed from the run queue and not further considered in our analysis, leaving 54 CE-MS data sets for analysis.
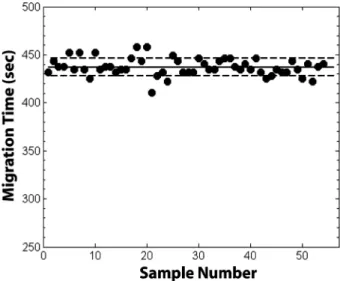
In Fig. 6, we plot the migration time of neurotensin, one of the postprocessing standards, as a function of run order for all of the runs of the experiment. The average migra-tion time is 436.5 6 9 s, and the migramigra-tion times are dis-tributed more or less randomly with run order, indicating that the tITP-ZE methodology is performing equivalently throughout the experiment. The CV of migration time for each of the other components added to the serum is be-tween ,1 to ,3%, indicating that the separation is con-sistent run-to-run for components with varying electro-phoretic mobilities.
We also investigated whether there was a correlation of the data with the day a sample was run. For the pre- and postprocessing standards, which are present in the same concentration in each sample, we calculated a total intensity, akin to the area of a single-component peak in an electropherogram. Where more than one charge state was detected for a component, we sum-med over the two most prevalent charge states. We then plotted the total intensity against run order and did not find any obvious grouping of the intensities by day (data not shown).
Figure 6. Migration time of the post-processing standard
neurotensin plotted against run order. The solid horizontal line denotes the mean value, and the dotted lines denote the bounds of one standard deviation.
3.4 Detection of multiple-fold differences in concentration between groups
As described above, the pattern recognition standards were added to the serum samples such that the differ-ence in their concentration between the two groups spanned from 2- to 20-fold. In Fig. 7 we show, as an example, data for Substance P, which was added at a 4-fold higher concentration into samples in Group A than into samples in Group B. Figure 7 shows the mathemati-cally averaged mass spectra for Group A (solid line) and for Group B (dotted line). Black circles on the x-axis iden-tify the values of m/z determined to be distinguishing features by our support vector machine (SVM)-based feature selection algorithms. These features are adjacent to each other (the black circles appear as a line) and cor-respond to the m/z for the first three isotope peaks of Substance P in its doubly charged state. The difference in average signal is easily discernable by eye. Immediately to the right of the isotope envelope for Substance P is an unidentified serum component (m/z 676.4), whose inten-sity was not significantly different between the two sam-ple groups and was therefore identified correctly as a nondistinguishing feature.
To determine the fold-difference in concentration that was observed in the experiment, we used the mean total intensities for each standard over all runs of Group A samples and the mean total intensities for each standard for all runs of Group B samples. Then, for each standard,
Figure 7. Average mass spectra showing feature
selec-tion results for substance P (m/z 674.4, 12 charge state). The asterisks denote the isotope peaks for Substance P. Solid line denotes Group A, and the dotted line denotes Group B. The difference in concentration between groups was 4-fold. The black dots (essentially contiguous) along the x-axis denote the values of m/z identified as distin-guishing features.
we compared the total intensities of that standard in Group A to those in Group B by performing a two-tailed Student’s t-test. The result of the t-test is a p-value which tells us the probability due to chance of the difference in means for Groups A and B. For example, if the p-value is 0.6, there is a 60% chance that the observed difference in mean values is due purely to chance and, hence, one would conclude that there is no statistically significant difference between the means. Conversely, a p-value of 0.0001 indicates there is a statistically significant differ-ence between the means because there is only a 0.01% chance that this could have occurred by happenstance. In Table 2, we report the p-values for all standards, the observed (detected) fold difference, and the expected fold difference in concentration for all of the polypeptides added to the sera. The observed fold differences for the pre- and postprocessing standards range from 1.05 to 1.30, close to the expected value of 1.0, as these standards are present at the same concentration in Group A and Group B. In partic-ular, there was only a 5% difference between the mean total intensities for neurotensin, and the p-value for this differ-ence was greater than 0.5. We note that the two post-processing standards, neurotensin and lysozyme, have p-values an order of magnitude higher than those of the preprocessing standards, ubiquitin and insulin b-chain. Therefore, it is likely that ubiquitin and insulin b-chain are more sensitive to an unidentified effect correlated to the two groups of samples (e.g., the additional peptides spiked into each group). It is difficult to ascertain the significance of this correlation without additional data.
The p-values are less than 0.0001 for all pattern recogni-tion standards except melittin. Therefore, with the exception of melittin, the differences in mean total
inten-Table 2. Results of data analysis for each standard
Standard t-test p-value Observed fold Expected fold Preprocessing: Insulin b-chain 0.04712 1.3 1 Ubiquitin 0.01436 1.3 1 Postprocessing: Lysozyme 0.33615 1.2 1 Neurotensin 0.71149 1.0 1 Pattern recognition: Angiotensin I 0.00001 7.6 10 Angiotensin III 0.00000 6.3 8 Aprotinin 0.00003 1.9 3 Bradykinin 0.00000 1.6 2 Insulin 0.00000 13.4 20 LHRH fragment 0.00000 4.5 5 Mellitin 0.08071 3.8 10 Renin substrate 0.00000 7.8 10 Substance P 0.00000 3.4 4
sities between the groups are statistically significant. In subsequent experiments we found the signal variation for melittin (a component of bee venom) is significantly greater than typical peptides or serum components. We were able to find a 1.6-fold difference in the mean total intensities for Group A and B for bradykinin, which was spiked in at twice the concentration in Group B than in Group A. We note that the samples are derived from dif-ferent individuals, which incorporates biological diversity into the experiment. Thus, we conclude that our system is capable of detecting at least a twofold difference in the average concentration of a component in two groups.
3.5 Pattern recognition and classification
The results in the preceding section indicate that if a par-ticular component (a biomarker, for example) has at least a twofold different concentration on average between the two groups, we can detect and quantify that difference with reasonable accuracy and certainty. We wanted to determine whether, without a priori knowledge of the markers, we could automatically identify the pattern recognition standards as those and only those features which differentiate Groups A and B, and furthermore, whether we could classify samples as belonging to Group A and Group B using our pattern recognition and classifi-cation algorithms.
Our pattern recognition algorithm is based on the use of SVMs on signal-processed data [49–51]. The result of signal processing was a single intensity vs. m/z spectrum for each CE-MS run. The raw data was processed by first removing noise from the m/z spectra via wavelet trans-formation [52]. Then, we summed the intensity for each m/z over all spectra collected during the run, effectively ‘collapsing’ the data over separation time into a single (1-D) spectrum.
After signal processing, we used support vector machines in an iterative manner to identify and select those features (i.e., m/z values) that differentiate Group A from Group B. We first divide the signal-processed data into two sets: a “training set” and a “test set.” Within the training set, the data is subdivided by group, since we know which samples belong to Group A and which belong to Group B. The SVM algorithm is then run on the training set. The result is a weights vector which tells us the relative importance (weight) of each m/z in differ-entiating Group A from Group B. Next, we ‘update’ the training set of data by rescaling each value of m/z, taking the component-wise product of the weights vector and the signal-processed spectra (the collapsed 1-D spectra). We run SVM on the updated data, forming a new weights vector. The process of running SVM to form a new
weights vector and updating the data is repeated so that the only features (m/z values) retained are those which best distinguish the groups. These features are the selected features that make up the distinguishing pattern [53].
The final step is to classify a sample as belonging to either Group A or Group B. To do this, we reduce all the original signal-processed data (the ‘collapsed’ 1-D spectra) so that for each CE-MS run, the only intensities that remain in the data set are those that correspond to the selected features. The SVM is run one last time with the data reduced in this manner to give the weights vector which will be used to classify samples (the clas-sification rule). We classify all the samples in the test set by forming the dot product of the classification rule with the reduced data for each sample and examining the sign of the product. If the sign is positive, the sample belongs to Group A, and if negative, the sample belongs to Group B.
To estimate how well we could classify the data, we performed a threefold cross validation study. Cross-validation based on multiple folds (groupings) is a sta-tistical technique that has been shown to be a reliable empirical method to estimate the error of an algorithm [54–56]. We separated the data randomly into three sets: 1, 2, and 3. All data for a single serum sample were kept together in the same set, as each sample was run more than once. We combined sets 1 and 2 to form the training set (as discussed above). The remain-ing set, set 3, was the ‘test set’, the set of data that would be classified. In this way, the data used to develop the algorithm is independent from that used to test the algorithm, and therefore the statistics on the accuracy of the algorithm are more indicative of how the algorithm will perform on a much larger, more gen-eral data set [56]. We repeated the process of feature selection and sample classification twice more so that each of the three sets of samples was used as the test set, completing the threefold cross validation.
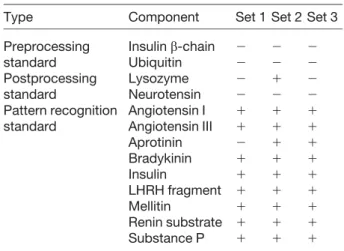
In Table 3 are shown the results of our feature selection for the components we added to serum for each of the three training data sets. A plus sign appears in the table where a component was identified as a distinguishing feature, and a minus sign appears where a component was not iden-tified as a distinguishing feature. We would therefore expect minus signs for all the table entries for pre- and post-processing standards, as those components were added to Group A and Group B samples in equivalent amounts. We would also expect plus signs in the rows for the pattern recognition standards, as these components’ concentrations differed between the groups. Out of the three sets of data and the nine pattern recognition
stand-Table 3. Results of feature selection algorithm for each of
the three test sets
Type Component Set 1 Set 2 Set 3
Preprocessing Insulin b-chain 2 2 2 standard Ubiquitin 2 2 2 Postprocessing Lysozyme 2 1 2 standard Neurotensin 2 2 2 Pattern recognition Angiotensin I 1 1 1 standard Angiotensin III 1 1 1 Aprotinin 2 1 1 Bradykinin 1 1 1 Insulin 1 1 1 LHRH fragment 1 1 1 Mellitin 1 1 1 Renin substrate 1 1 1 Substance P 1 1 1
A “1” sign denotes where the standard was selected as an identifying feature. A “2” sign denotes where the standard was not selected as an identifying feature.
ards, in only one instance (aprotinin in set 1) was a pattern recognition standard not identified as a distinguishing feature. In only one instance also (lysozyme in set 2), a post-processing standard was identified incorrectly as a distinguishing feature. Lysozyme migrates immediately after serum albumin, which has a large and complex charge state envelope. If the concentration of residual albumin in an individual’s sample is high enough, the albumin peak may overlap the lysozyme peak. This over-lap may be problematic for quantitation of lysozyme for at least two reasons: (i) the comigration of albumin and lyso-zyme creates an additional competition between the two for charge in the electrospray, and (ii) the complex charge state envelope of albumin obscures the lower intensity charge states of lysozyme. As a result, we no longer use lysozyme as a standard in our subsequent studies. We then used the m/z values identified as distinguishing features from each training set to form a classification rule to assign each of the samples in the corresponding test set to either Group A or Group B. We performed this three times, once for each combination of training and test set in the cross validation, to classify the sera corresponding to all 54 CE-MS data sets. Our accuracy in assigning the serum samples to Group A or B was 94.7% with a stand-ard deviation of 5%. This accuracy gives us reasonable confidence that our CE-ESI-MS system provides the per-formance necessary to identify biomarker candidates in clinical studies. With further analysis and reduction of the noise in the system and better signal processing algo-rithms to perform denoising, both of which we are already pursuing, we expect to further improve the classification accuracy.
4 Concluding remarks
With this work, we have developed and demonstrated a sheathless CE-ESI-MS system that we used to analyze human serum samples during a multiple-day period. Fur-thermore, the separations can be performed routinely in an automated mode, requiring no manual intervention for 10 h or more. The buffer system is fully volatile, and to improve the signal intensity, we employ in-line transient isotachophoresis. The lowest concentration of a species that we can detect depends on component and is ap-proximately 10–100 nMin serum, and approximately 500 serum components were detected. We are able to discern twofold or greater differences in a component concentra-tion at the 100-nanomolar level with high certainty for samples from different individuals. We were also able to use a pattern recognition algorithm to independently select in test data the values of m/z corresponding to peptides that had been added in different amounts to each of two groups of sera. Furthermore, we used the selected m/z values to classify each individual sample as to which group it belonged. The accuracy of classification was 95%.
We have demonstrated that automated, sheathless CE-ESI-MS is a sensitive and practical tool for discovery of serum biomarkers. We are in the process of improving several components of the system in order to observe a larger number of serum components and to produce results of yet greater accuracy. From the favorable results reported here, we have an understanding of the system performance and are pursuing its application in clinical studies.
The authors are grateful to the following employees of Predicant Biosciences: Mikhail Belov, Arjuna Balasing-ham, Pete Foley, Chuck Fancher, Paul McNitt, and Roger Rudoff for development of the in-house mass spectro-meter and accompanying software and Zulfikar Ahmed for developing and coding the pattern recognition algo-rithms.
Received August 17, 2004
5 References
[1] Anderson, N. L., Anderson, N. G., Mol. Cell. Proteomics 2002, 1, 845–867.
[2] Adam, B. L., Qu, Y., Davis, J. W., Ward, M. D., Clements, M. A., Cazares, L. H., Semmes, O. J., Schellhammer, P. F., Yasui, Y., Feng, Z., Wright, G. L., Jr., Cancer Res. 2002, 62, 3609– 3614.
[3] Petricoin, E. F., Ardekani, A. M., Hitt, B. A., Levine, P. J., Fusaro, V. A., Steinberg, S. M., Mills, G. B., Simone, C., Fish-man, D. A., Kohn, E. C., Liotta, L. A., Lancet 2002, 359, 572– 577.
[4] Li, J., White, N., Zhang, Z., Rosenzweig, J., Mangold, L. A., Partin, A. W., Chan, D. W., J. Urol. 2004, 171, 1782–1787. [5] Villanueva, J., Philip, J., Entenberg, D., Chaparro, C. A.,
Tanwar, M. K., Holland, E. C., Tempst, P., Anal. Chem. 2004, 76, 1560–1570.
[6] Marshall, J., Kupchak, P., Zhu, W., Yantha, J., Vrees, T., Furesz, S., Jacks, K., Smith, C., Kireeva, I., Zhang, R., Takahashi, M., Stanton, E., Jackowski, G., J. Proteome Res. 2003, 2, 361–372.
[7] Kaiser, T., Hermann, A., Kielstein, J. T., Wittke, S., Bartel, S., Krebs, R., Hausadel, F., Hillmann, M., Golovko, I., Koester, P., Haller, H., Weissinger, E. M., Fliser, D., Mischak, H., J. Chromatogr. A 2003, 1013, 157–171.
[8] Wittke, S., Fliser, D., Haubitz, M., Bartel, S., Krebs, R., Hausadel, F., Hillmann, M., Golovko, I., Koester, P., Haller, H., Kaiser, T., Mischak, H., Weissinger, E. M., J. Chromatogr. A 2003, 1013, 173–181.
[9] Neuhoff, N., Kaiser, T., Wittke, S., Krebs, R., Pitt, A., Burch-ard, A., Sundmacher, A., Schlegelberger, B., Kolch, W., Mis-chak, H., Rapid Commun. Mass Spectrom. 2004, 18, 149– 156.
[10] Kaiser, T., Wittke, S., Just, I., Krebs, R., Bartel, S., Fliser, D., Mischak, H., Weissinger, E. M., Electrophoresis 2004, 25, 2044–2055.
[11] Altria, K., Capillary Electrophoresis Guidebook: Principles, Operation, and Applications, Humana Press, Totowa, NJ 1996.
[12] Weinberger, R., Practical Capillary Electrophoresis, Aca-demic Press, San Diego, CA 1993.
[13] Foret, F., Szoko, E., Karger, B. L., Electrophoresis 1993, 14, 417–428.
[14] Sanz-Nebot, V., Benavente, F., Balaguer, E., Barbosa, J., Electrophoresis 2003, 24, 883–891.
[15] Figeys, D., Aebersold, R., Electrophoresis 1998, 19, 885– 892.
[16] Kelly, J. F., Ramaley, L., Thibault, P., Anal. Chem. 1997, 69, 51–60.
[17] Neusüss, C., Pelzing, M., Macht, M., Electrophoresis 2002, 23, 3149–3159.
[18] von Brocke, A., Nicholson, G., Bayer, E., Electrophoresis 2001, 22, 1251–1266.
[19] Banks, J. F., Electrophoresis 1997, 18, 2255–2266. [20] Tomlinson, A. J., Naylor, S., J. Capil. Electrophor. 1995, 2,
225–233.
[21] Smith, R. D., Olivares, J. A., Nguyen, N. T., Udseth, H. R., Anal. Chem. 1988, 60, 436.
[22] Lee, E. D., Muck, W., Henion, J. D., Covey, T. R., J. Chro-matogr. 1988, 458, 313–321.
[23] Olivares, J. A., Nguyen, N. T., Yonker, C. R., Smith, R. D., Anal. Chem. 1987, 59, 1230–1232.
[24] Chang, Y. Z., Her, G. R., Anal. Chem. 2000, 72, 626–630. [25] Moini, M., Anal. Chem. 2001, 73, 3497–3501.
[26] Ding, J., Vouros, P., Anal. Chem. 1999, 71, 378A–385A. [27] Larsson, M., Lutz, E. S., Electrophoresis 2000, 21, 2859–
2865.
[28] Banks, J. F., Dresch, T., Anal. Chem. 1996, 68, 1480–1485. [29] Whitt, J. T., Moini, M., Anal. Chem. 2003, 75, 2188–2191. [30] Chen, Y.-R., Tseng, M.-C., Chang, Y.-Z., Her, G.-R., Anal.
Chem. 2003, 75, 503–508.
[31] Kirby, D. P., Thorne, J. M., Goetzinger, W., Karger, B. L., Anal. Chem. 1996, 68, 4451–4457.
[32] Janini, G. M., Conrads, T. P., Wilkens, K. L., Isaaq, H. J., Veenstra, T. D., Anal. Chem. 2003, 75, 1615–1619.
[33] Zhu, X., Thiam, S., Valle, B. C., Warner, I. M., Anal. Chem. 2002, 74, 5405–5409.
[34] Guo, X., Chan, H. M., Guevremont, R., Siu, K. W. M., Rapid Commun. Mass Spectrom. 1999, 13, 500–507.
[35] Johansson, I. M., Huang, E. C., Henion, J. D., Zweigen-baum, J., J. Chromatogr. 1991, 554, 311–327.
[36] Balaguer, E., Benavente, F., Sanz-Nebot, V., Barbosa, J., HPCE 2004, Salzburg, Austria.
[37] Belov, M., Foley, P., Fancher, C., American Society of Mass Spectrometry Annual Meeting, Nashville, TN 2004. [38] Burtis, C. A., Ashwood, E. R., Tietz Textbook of Clinical
Chemistry, W.B. Saunders Company, Philadelphia, PA 1999. [39] Putnam, R. W., The Plasma Proteins, Academic Press, New
York 1975.
[40] Rohde, E., Tomlinson, A. J., Johnson, D. H., Naylor, S., Electrophoresis 1998, 19, 2361–2370.
[41] Paroni, R., Fermo, I., Cighetti, G., Ferrero, C. A., Carobene, A., Ceriotti, F., Electrophoresis 2004, 25, 463–468.
[42] Chien, R. L., Burgi, D., Anal. Chem. 1992, 64, 1064. [43] Smith, R. D., Loo, J. A., Edmonds, C. G., Barinaga, C. J.,
Udseth, H. R., Anal. Chem. 1990, 62, 882–899.
[44] Auriola, S., Thibault, P., Sadovskaya, I., Altmann, E., Elec-trophoresis 1998, 19, 2665–2676.
[45] Tempels, F. W. A., Underberg, W. J. M., Somsen, G. W., de Jong, G. J., Anal. Chem. 2004, 76, 4432–4436.
[46] Stroink, T., Wiese, G., Teeuwsen, J., Lingeman, H., Waterval, J. C. M., Bult, A., de Jong, G. J., Underberg, W. J. M., Elec-trophoresis 2003, 24, 897–903.
[47] Figeys, D., Ducret, A., Yates, J. R., Aebersold, R., Nat. Bio-technol. 1996, 14, 1579–1583.
[48] Tomlinson, A. J., Benson, L. M., Jameson, S., Johnson, D. H., Naylor, S., J. Am. Soc. Mass Spectrom. 1997, 8, 15–24. [49] Boser, B. E., Guyon, I., Vapnik, V., Proc. Comput. Learning
Theory 1992, 144–152.
[50] Christianni, N., Shawe-Taylor, J., An Introduction to Support Vector Machines, Cambridge University Press, New York 2000.
[51] Vapnik, V., Statistical Learning Theory, John Wiley and Sons, New York 1998.
[52] Donoho, D. L., Appl. Comput. Harmonic Anal. 1995, 2, 101– 126.
[53] Weston, J., Elisseef, A., Schölkopf, B., Tipping, M., J. Machine Learning Res. 2003, 3, 1439–1461.
[54] Efron, B., J. Am. Statist. Assoc. 1983, 78, 316–331. [55] Efron, B., Tibshirani, R., Cross-validation and the Bootstrap:
Estimating the Error Rate of a Prediction Rule, Technical Report, Stanford University, Palo Alto, CA 1995.