HAL Id: hal-02330233
https://hal.archives-ouvertes.fr/hal-02330233
Submitted on 29 Mar 2021HAL is a multi-disciplinary open access archive for the deposit and dissemination of sci-entific research documents, whether they are pub-lished or not. The documents may come from teaching and research institutions in France or abroad, or from public or private research centers.
L’archive ouverte pluridisciplinaire HAL, est destinée au dépôt et à la diffusion de documents scientifiques de niveau recherche, publiés ou non, émanant des établissements d’enseignement et de recherche français ou étrangers, des laboratoires publics ou privés.
Katsuyoshi Michibayashi, Takehiro Hirose, Toshio Nozaka, Yumiko Harigane,
Javier Escartin, Heike Delius, Margaret Linek, Yasuhiko Ohara
To cite this version:
Katsuyoshi Michibayashi, Takehiro Hirose, Toshio Nozaka, Yumiko Harigane, Javier Escartin, et al.. Hydration due to high-T brittle failure within in situ oceanic crust, 30°N Mid-Atlantic Ridge. Earth and Planetary Science Letters, Elsevier, 2008, 275 (3-4), pp.348-354. �10.1016/j.epsl.2008.08.033�. �hal-02330233�
1
Hydration due to high-T brittle failure within in situ
2oceanic crust, 30°N Mid-Atlantic Ridge
34
Katsuyoshi Michibayashi a,*, Takehiro Hirose b, Toshio Nozaka c, Yumiko 5
Hariagane a, Javier Escartin d, Heike Delius e, Margaret Linek f, Yasuhiko Oharag 6
7
a Institute of Geosciences, Shizuoka University, Shizuoka 422-8529, Japan
8
bKochi Institute for Core Sample Research, JAMSTEC, Kochi 783-8502, Japan
9
c Department of Earth Sciences, Okayama University, Okayama 700-8530, Japan
10
d Marine Geosciences, CNRS/IPGP, 75252 Paris, France
11
e Department of Geology, University of Leicester, Leicester LE1 7RH, UK
12
fAngewandte Geophysik, RWTH, Aachen University, Aachen 52064, Germany
13
g Ocean Research Laboratory, Hydrographic Department of Japan, Tokyo, Japan
14 15
* Corresponding author: Fax: +81 54 238 4788, [email protected] 16
17 18 19 20
Re-submitted to Earth and Planetary Sciences Letters 11th August 2008
Abstract 22
Analysis of an in situ fault zone within the Atlantis Massif oceanic core complex 23
(Mid-Atlantic Ridge) provides clues to the relevant deformation mechanisms and their 24
temporal evolution within oceanic crust. IODP EXP304/305 drilled a succession of 25
gabbroic lithologies to a final depth of 1415 meters below the sea floor (mbsf), with 26
very high recovery rates of up to 100% (generally ~80%). We identified an 27
intra-crustal fault zone between 720 and 780 mbsf in a section of massive gabbro, 28
olivine gabbro, oxide gabbro units, and minor diabase intrusions. Of particular interest 29
is the section between 744 and 750 mbsf, which unfortunately was marked by low 30
recovery rates (17%). Electrical borehole-wall images show a 1-m-thick zone of 31
east-dipping fractures within this interval, which is otherwise dominated by N–S 32
dipping structures. Despite the high fracture density in this section, the hole walls are 33
smooth, with rare breakouts, suggesting that the low recovery rate was due to a change 34
in lithology rather than well conditions. The recovered rocks include ultracataclasite 35
and possibly incohesive fault gouge that formed in the upper amphibolite regime, with 36
mostly amphibole infill. Logging data suggest that the gabbroic rocks in this interval 37
are rich in hydrous phases, consistent with increased amounts of amphibole found in 38
the core. Equilibration temperature conditions of about 640°C were obtained for 39
plagioclase clasts and aluminous actinolite, assuming a pressure of 200MPa. The 40
permeability of the fault zone is in the range of 10–19 to 10–17 m2. Although the 41
permeability appears to be high within the fault zone relative to other parts of the 42
section, it is no higher than that in typical lower crustal material. As a consequence, 43
because brittle failure occurred at high temperatures, the fault zone was subsequently 44
completely sealed by hydrous minerals, thereby preventing further fluid circulation 45
and preserving water in the crust. 46
47
Key words: IODP U1309D, Mid-Atlantic Ridge, gabbro, fault, permeability, 48
core-log 49
1. Introduction 50
51
Water exists in oceanic crust within a number of hydrous minerals. When an 52
oceanic plate subducts at a trench, the hydrated crust carries water in the form of 53
hydrous meta-basalt (e.g., blueschist; Peacock, 1993). The hydrous minerals become 54
unstable at the pressures and temperatures of the shallow subduction zone (~50 km 55
depth) and are dehydrated to produce anhydrous eclogitic oceanic crust. This 56
dehydration process is expected to occur at depths of ~50–150 km in a cold 57
subduction environment such as that beneath Northeast Japan (Hacker et al., 2003; 58
Iwamori and Zhao, 2000; Kita et al., 2006; Tsuji et al., 2008). Because the presence 59
of water substantially lowers the melting temperature of mantle peridotite, it is 60
generally believed that the liberated water eventually triggers mantle melting, 61
thereby generating island arc volcanism (Tatsumi, 1989). This scheme of 62
dehydration of the subducting slab is petrologically and geodynamically well 63
established (e.g., Kawakatsu and Watada, 2007; Iwamori, 2007); however, it remains 64
unknown as to how and where the oceanic crust becomes hydrated. 65
In this paper, we document the high-T brittle failure and subsequent 66
hydration-reaction-related sealing of a fault zone within young oceanic crust upon 67
the Atlantis Massif, Mid-Atlantic Ridge (30°10’N; Fig. 1) drilled during Expeditions 68
304 and 305 of the Integrated Ocean Drilling Program (EXP304/305 IODP; 69
Blackman et al., 2006). The fault zone of interest is located at 746 meters below sea 70
level (mbsf) within massive gabbro suites, and shows no overprinting by 71
exhumation-related structures. A combined study of in situ borehole logging data and 72
analyses of drill core recovered from the fault zone enables us to characterize the 73
fault zone. We argue that the documented hydration processes may occur pervasively 74
within oceanic crust along fault zones beneath the mid-oceanic ridge. 75 76 77 2. Geological Setting 78 79
The Atlantis Massif, which formed within the past 1.5–2 m.y., bounds the 80
west side of the median valley of the Mid-Atlantic Ridge (Fig. 1). The corrugated, 81
striated central portion of this domal massif displays morphologic and geophysical 82
characteristics inferred to be representative of an oceanic core complex exposed via 83
long-lived detachment faulting (e.g., Cann et al., 1997; Tucholke et al., 1998; 84
Blackman et al., 1998; Collins et al., 2001; Escartin et al., 2003; Blackman et al., 85
2004). The drill hole analyzed in the present study (EXP304/305 IODP) is located 86
within the footwall of the detachment fault, extending through a succession of 87
gabbroic lithologies down to final depth of 1415 mbsf (Blackman et al., 2006; 88
Ildefonse et al., 2007). The interval between 720 and 780 mbsf, within which the 89
fault zone of the present study occurs, consists of a succession of massive gabbro, 90
olivine gabbro, oxide gabbro, and minor diabase intrusions (Fig. 1). The fault zone 91
consists of three discrete brittle faults, and occurs well below the major detachment 92
fault located at the top of the hole, where brittle and plastic deformation appears to 93
be more intense (Blackman et al., 2006). 94 95 3. Logging Data 96 97 3.1. Methods 98
Downhole logging data are useful in complementing core data (e.g., visual 99
core descriptions, analysis of thin sections) and determining the orientation of 100
structures identified in the recovered core. The coverage of downhole data attained 101
during EXP 304/305 was almost 100% (Blackman et al., 2006). Standard logs such 102
as density, resistivity, neutron porosity, and natural gamma radiation were collected 103
between depths of 50 and 1415 mbsf at a sampling interval of 0.15 m. 104
Density was measured using the hostile-environment lithodensity tool 105
(HLDT). In this highly resistive environment, a dual laterolog (DLL) was used to 106
measure resistivity, recording both shallow and deep penetrating resistivity. An 107
accelerator porosity sonde (APS) was used to estimate porosity and degree of 108
alteration. In highly altered rocks, neutron porosity shows a marked increase related 109
to the sensitivity of the tool to hydrogen-rich minerals (e.g., clays, chlorite, and 110
serpentinite) that fill veins and occur as replacement minerals. The 111
hostile-environment spectral gamma ray tool (HNGS) and spectral gamma ray tool 112
(NGT) were used to measure natural radioactivity. The HNGS output was generally 113
superior to that of NGT, as it was run first and the rocks were not artificially 114
activated by the neutron porosity tool. 115
Formation microscanner (FMS) electric resistivity images were used to assess 116
variations in structure. The FMS is a four-pad microelectrical resistivity device that 117
enables detailed investigations of vertical and lateral variations in formation 118
resistivity (Serra, 1989) with a shallow depth of investigation (~2 mm). Data quality 119
is highly sensitive to poor pad contact with the borehole wall arising from surface 120
roughness. The obtained resistivity values are relative because the current flow is 121
continuously adjusted during logging to optimize the operating range of the tool 122
under varying bed resistivity. Resistivity measurements are recorded every 2.5 mm, 123
and the vertical resolution of the tool is in the order of 2.5 cm; it is possible to detect 124
beds thinner than 2.5 cm if high resistivity contrast exists between the adjacent beds 125
(Serra, 1989). During data processing, images were dynamically normalized over a 2 126 m moving window. 127 128 3.2. Logging Results 129
The quality of the logging data is extremely high for all tools because of the 130
excellent hole conditions encountered during drilling. The density, resistivity, and 131
velocity logs are useful in distinguishing different gabbroic rocks, and are 132
particularly valuable in examining the overall structure, including that in 133
non-recovered sections within the interval around the fault zone. The trends in these 134
datasets are related to alteration and deformation associated with the fault zone (Fig.
135
1). 136
The diameter of the borehole (named as Caliper) varies between 25.46 and 137
31.46 cm (Fig. 1). The maximum diameter occurs in gabbro at 731.8 mbsf, and the 138
minimum in diabase at around 760 mbsf. This interval between 740 and 760 mbsf 139
shows a highly smooth surface, with no apparent breakouts despite the low recovery 140
at certain intervals such as the fault zone. 141
The overall neutron porosity within the borehole is generally around 5%, a 142
typical value for gabbro, although this figure exceeds 10% in places, including the 143
interval containing the fault zone (Fig. 1). The shallow and deep resistivity decrease 144
from 144 ohm.m in regular gabbro to 28 ohm.m within the fault zone (Fig. 1), and 145
density decreases from ~2.9 gr/cm3 in regular gabbro to ~2.0 gr/cm3 within the fault 146
zone. 147
Within the fault zone, between 744 and 750 mbsf, the electrical horehole wall 148
images reveal an approximately 1-m interval of east-dipping structures between 149
structures that dip to the north and south (Fig. 1). 150
151
4. Core Analyses 152
153
Only 0.8 m of core was recovered from the 4.8 m interval between 746.2 and 154
751.0 mbsf (Fig. 1), with most of the core showing intense brittle deformation 155
indicative of cataclasis and ultracataclasis. This section of core is described in detail 156 below. 157 158 4.1. Microstructural Analyses 159
Detailed microstructural observations reveal the occurrence of ultracataclasite 160
within coarse cataclasites (Fig. 2); the ultracataclasite contains local microscopic 161
seams of amphibole (Fig. 2C-F), as described below. The coarse cataclasite contains 162
irregularly shaped clasts of plagioclase and locally amphibole within an altered 163
matrix (Fig. 2B). The coarse plagioclase fragments are fractured and show weak 164
undulose extinction. The amphibole clasts, which are altered clinopyroxene grains, 165
show bending with undulose extinction and microcracks. The altered matrix consists 166
of very fine (<1 mm) amphibole with no apparent shape-preferred orientation. The 167
sizes of plagioclase clasts decrease toward the ultracataclasite zone (Fig. 2B). Within 168
this zone, relic coarse plagioclase clasts show moderate undulose extinction and are 169
intensely fractured, with offset recorded along some of the fractures. 170
Seams of amphibole and minor epidote and plagioclase occur within the 171
ultracataclasite zone. Amphibole (001) cleavages are oriented subparallel to the fault 172
plane. The seams are irregularly distributed, but are most common within the zone 173
with the most fine-grained clasts, which they locally anastomose around or cut across 174
(Fig. 2C–F). These relationships indicate that the seams originated from the 175
syntectonic replacement of clasts during brittle deformation (i.e., development of the 176
fault zone). Furthermore, flow structures around epidote and plagioclase grains (see 177
Fig. 2C–F) indicate that the seams were subsequently plastically deformed, without 178
further brittle deformation. 179 180 4.2. Mineral Chemistry 181 4.2.1. Methods 182
The chemical compositions of minerals within two polished thin sections (TS 183
#398 and #399) cut from samples from the fault zone were analyzed using a JEOL 184
JXA-733 electron microprobe with three spectrometers housed at Okayama 185
University, Japan. Operating conditions were an accelerating voltage of 15 kV, 186
sample current of 10–20 nA, and a defocused beam of 20 µm diameter. Analyzed 187
standards were natural or synthetic oxides and silicates. The applied matrix 188
correction followed that of Bence and Albee (1968), using the alpha factors of 189
Nakamura and Kushiro (1970). 190
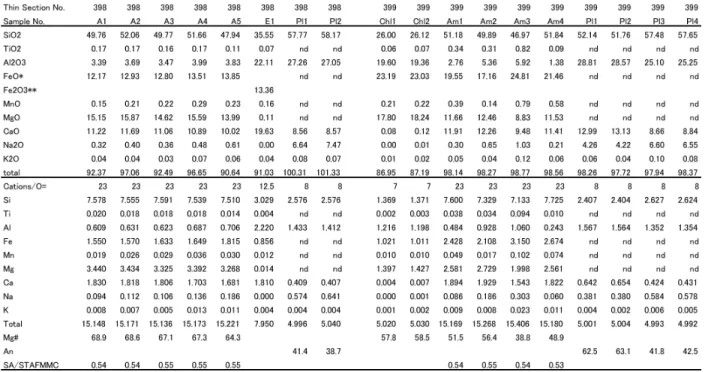
4.2.2. Results
191
Representative analyses are listed in Table 1, and the locations of analyzed 192
points are shown in Fig. 3. The fibrous amphibole that forms the thin semas in the 193
ultracataclasite (points A2 and A4 in TS #398; Table 1 and Fig. 3) has the 194
composition of actinolite (Leake, 1978), but is rich in Al and poor in Si (< 7.6 per 195
formula unit) relative to typical greenschist-facies actinolite. Some of the 196
amphibole-like fibrous minerals within the films (points A1, A3, and A5 in TS #398; 197
Table 1 and Fig. 3) have slightly different compositions from the actinolites, being 198
deficient in total oxides (< 93 wt.%); this may reflect a high H2O content. Under the
199
microscope, these grains have lower relief, lower birefringence, and smaller 200
extinction angles than actinolite. These optical characteristics, in combination with 201
the possible enrichment in H2O, suggest that the actinolitic seams are partly
202
decomposed to a variety of biopyribole due to low-temperature alteration; however, 203
the invariable nature of the ratio of tetrahedral cations to tetrahedral and octahedral 204
cations, (Si + Al)/(Si + Ti + Al + Fe + Mn + Mg + Ca) (Table 1), suggests that 205
amphibole composition is largely unaffected by alteration (Veblen and Burnham, 206
1978). 207
Fibrous amphibole that coexists with chlorite (point A1 in TS #399; Table 1
208
and Fig. 3) is similar in Si, Al, and alkali contents to the film-forming aluminous 209
actinolite, whereas amphibole clasts and fringes around chlorite are highly variable 210
in composition (points A2, A3, and A4 in TS #399), suggesting chemical 211
disequilibrium at the thin-section scale and variable physical conditions of amphibole 212
formation. In particular, the high Al and low Si contents of the amphibole clasts 213
suggest that high-temperature metamorphism preceded cataclasis and the formation 214
of ultracataclasite. 215
Plagioclase grains show a bimodal distribution of compositions related to 216
grain size: anorthite contents [An = 100*Ca/(Ca + Na + K)] are 39–43 and 62–63 in 217
small clasts and large crystals, respectively (Table 1 and Fig. 3). On the basis of 218
textural evidence such as grain size, grain shape, and mode of occurrence, the large 219
plagioclase crystals are considered to be relic crystals that grew at an early stage of 220
igneous crystallization or high-temperature metamorphic crystallization; in contrast, 221
the small clasts formed during brittle deformation associated with chemical 222
adjustment to low-temperature conditions. 223
Plagioclase clasts embedded in the foliated seams (points P1 and P2 in TS 224
#398) are likely to have formed in equilibrium with the aluminous actinolite, as they 225
are homogeneous in composition and in direct contact with the actinolite (Fig. 3). 226
Using the amphibole–plagioclase thermometer of Holland and Blundy (1994) and 227
assuming a pressure of 200 MPa, we calculated equilibration temperature conditions 228
of about 640 °C for the plagioclase clasts and aluminous actinolite. 229 230 5. Permeability Measurements 231 232 5.1. Experimental Procedure 233
Permeability measurements were performed on samples collected across the 234
fault zone (Table 2). For gas permeability measurements, the samples were shaped 235
into cylinders with a diameter of 25 mm and length of ~9 mm (except for one fragile 236
sample which was cut into a rectangular shape of 20 20 7.1 mm) and then dried 237
at 90 °C in an oven for at least 2 weeks to eliminate pore water. All measurements 238
were conducted using an intra-vessel deformation and fluid-flow apparatus (Hirose 239
and Hayman, 2008). Specimens were jacketed with three layers of polyolefin 240
shrinking tubes to isolate the pores from the confining medium. To evaluate the 241
evolution of permeability with confining pressure, the pressure was increased in a 242
stepwise manner from 5 MPa up to either 60 or 140 MPa and then decreased back 243
down to 5 MPa (Fig. 4). 244
In measuring permeability, we used the steady-state flow method with 245
nitrogen gas as a pore-fluid medium. A constant pore-pressure gradient of 0.2–2.4 246
MPa was applied across the specimen, with the volume of gas flowing through the 247
specimen being monitored by soap-film flowmeters. The permeability value, k, for 248
the nitrogen gas flow is given by the following equation based on Darcy’s law: 249 2 2 2 down up down P P P A LQ k , 250
where Q is the flow rate, A is the cross-sectional area perpendicular to the flow 251
direction, L is the specimen length parallel to the flow direction, is the viscosity of 252
the pore fluid, and Pupand Pdownare the pore pressures in the upper and lower ends of
253
the specimen. The measurable flow rate in the apparatus can be varied from 0.05 to 254
5000 ml/min, which roughly corresponds to permeabilities ranging from 10–21 to 10–16 255
m2 for specimens of this size. 256
257
5.2. Experimental Results
258
The permeability values obtained for the regular gabbro and fault rocks as a 259
function of confining pressure are shown in Fig. 4A and B, respectively (see also 260
Table 2). The results show the following trends: (1) host rocks are more impermeable 261
than the fault rocks by more than an order of magnitude; (2) permeability decreases 262
with increasing confining pressure, and tends to be lower during the second pressure 263
cycle; (3) for all specimens, the reduced permeability during pressurization did not 264
recover to the initial values during depressurization. For comparison with the 265
borehole data,Fig. 1shows permeability data at an effective confining pressure of 20 266
MPa during the downward pressure cycle, which approximately corresponds to the 267
borehole pressure. The downhole permeability plot shows that the fault zone is 268
relatively permeable compared with adjacent rocks, with a permeability of 10–18 to 269
10–17 m2. 270
6. Interpretation and Discussion 272
273
6.1. Logging Data Across the Fault Zone associated with Fault rocks
274
The 0.8 m of core recovered from the 4.8 m interval between 746.2 and 751.0 275
mbsf shows intense brittle deformation indicative of cataclasis and ultracataclasis 276
(Fig. 2). Several pieces of ultracataclasite were obtained from sections of gabbro 277
subject to intense brittle deformation within the fault zone (e.g., Fig. 2A). However, 278
it is difficult to determine the scale of the fault zone, since the rate of core recovery 279
was poor across the fault zone (between 744 and 752 mbsf). In contrast, a 280
near-complete set of downhole logging data was obtained (Fig. 1). 281
The borehole condition was as good quality as the smooth borehole width 282
across the fault zone (Fig. 1), indicating that the fault zone appears to be well 283
lithified in spite of the development of fault rocks. However, the other logging data 284
around the core of the fault rocks are remarkably different from the protolith 285
gabbroic rocks in the interval between 720 and 780 mbsf: i.e., the low deep 286
resistivity, the high gamma ray and the high neutron porosity, suggesting that the 287
fault zone contains conductive phases (Fig. 1). This interpretation is further 288
supported by the density data, which show values of ~2.9 gr/cm3 in the gabbro suites, 289
decreasing to ~2.0 gr/cm3 within the fault zone. Although the absolute density is 290
poorly calibrated, this decrease in apparent density might be explained by the 291
relatively high permeability within the fault zone (discussed below) and the presence 292
of hydrous phases such as amphibole. At 745 mbsf, where the borehole width data 293
indicate an absence of breakouts, the density is ~2.0 g/cm3, suggesting that cracks, if 294
present at all, remain closed. 295
Moreover, the electrical horehole wall images can be analyzed to obtain 296
information on the geometry of lithological contacts and fractures within the fault 297
zone (Fig. 1). The images reveal a distinct dark region at the top of the east-dipping 298
zone at around 745.5 mbsf, possibly corresponding to the lowest recorded density of 299
2.0 g/cm3 and the highest neutron porosity of 26 % (Fig. 1). These structures 300
probably reveal the full extent of the fault zone, which on this basis is more than 5 m 301
wide at around 745 mbsf (Fig. 1). 302
6.2. Permeability of the fault zone: implication for hyrdration in the oceanic crust
304
The fault zone consists of cataclasite and ultracataclasite. The ultracataclasite 305
contains seams of amphibole and minor epidote and plagioclase (Fig. 2C–F). Flow 306
structures around epidote and plagioclase grains (Fig. 2C–F) demonstrate that the 307
seams were subsequently plastically deformed, with no apparent brittle deformation. 308
Since these seams appear to have developed at temperatures of around 640 °C (Fig.
309
3), these microstructural development would indicate a high temperature brittle 310
failure and subsequent slow slip in the fault zone in association with hydrothermal 311
alteration. 312
Our laboratory measurements indicate that the permeability of the fault zone 313
is in the order of 10–19 to 10–17 m2, more than an order magnitude higher than that of 314
the host gabbroic rocks (Fig. 4). Because our experiments were performed using 315
small cores that did not contain large-scale fractures, much higher permeabilities are 316
likely within the highly fractured parts of the fault zone that were not recovered 317
during drilling. In fact, high permeability, ranging from 10–18 to 10–13 m2, has been 318
reported from in situ permeability measurements of shallow basaltic oceanic crust 319
within which fractures are favorably developed (see the review by Fisher, 1998). 320
Although large-scale crustal fault zones are likely to be more highly permeable than 321
that indicated by our laboratory results, our relatively low-permeability fault data 322
may represent the permeability structure of minor-scale or locally inactive fault 323
zones such as those likely to be observed within the present cores (Fig. 2). Such a 324
low-permeable fault zone results from progressive sealing via the formation of 325
hydrous minerals at around 640 °C. Given that the amphibole crystals that act as the 326
seal were plastically deformed within the fault zone (Fig. 2), such a low permeability 327
structure within the fault zone, which is as low as that of the lower crust (e.g., Brace, 328
1984), would occur during the later stages or perhaps even the last stage of fault 329
movement (i.e., a post-seismic event). 330
We argue that the low-permeable fault zone observed within gabbro in the 331
present study is one of the best candidate structures for preserving water in the 332
oceanic crust. The water could be input into lower crustal rocks to form hydrous 333
minerals along fault zones that developed near the spreading axis presumably during 334
seismic events (e.g., Wolfe et al., 1995) and might then be preserved because of a 335
low permeability structure, until dehydration reactions occur with increasing 336
temperature at some tectonic settings such as a subducting slab. 337
338
7. Conclusions 339
340
IODP EXP304/305 drilled a succession of gabbroic lithologies to a final depth 341
of 1415 meters below the sea floor (mbsf), attaining very high recovery rates of up to 342
100% (generally ~80%). We identified an intra-crustal fault zone between 720 and 780 343
mbsf in a section consisting of massive gabbro, olivine gabbro, oxide gabbro, and 344
minor diabase intrusions. Of particular interest is the section between 744 and 750 345
mbsf, marked by poor core recovery (17%). Electrical borehole-wall images show a 346
1-m-thick zone of east-dipping fractures within this interval that is otherwise 347
dominated by structures dipping to the N and S. Despite a high fracture density, the 348
section has smooth walls with rare breakouts, suggesting that the poor recovery is due 349
to a change in lithology rather than well conditions. Ultracataclasite formed in the 350
upper amphibolite regime, with infill dominated by amphibole. Logging data suggest 351
that the gabbroic rocks in this interval are rich in hydrous phases, consistent with the 352
increased amounts of amphibole found in the core. Equilibration temperature 353
conditions of about 640 °C (assuming a pressure of 200 MPa) were obtained for 354
plagioclase clasts and aluminous actinolite. Laboratory experiments reveal that the 355
permeability of the fault zone is in the range of 10–19 to 10–17 m2. Although the 356
permeability is relatively high within the fault zone, the overall permeability structure 357
is no higher than that in the lower crust; consequently, because brittle failure occurred 358
at high temperatures, the fault zone was subsequently completely sealed with hydrous 359
minerals, thereby preventing further fluid circulation. Such low-permeable fault zone 360
observed within gabbro in the present study is one of the best candidate structures for 361
preserving water in the oceanic crust. 362
363
Acknowledgements 364
This research used samples and data provided by the Integrated Ocean 365
Drilling Program (IODP) and the shipboard parties of Expedition 304/305. We thank 366
C. P. Jaupart and an anonymous reviewer for their valuable comments and A. 367
Stallard for improving the English in the manuscript. We thank the Integrated Ocean 368
Drilling Program for their extraordinary efforts during Exp 304/305. This study was 369
supported by research grants from the Japan Society for the Promotion of Science 370
(JSPS) and the Japan Drilling Earth Science Consortium (J-DESC). 371
372
References 373
Barclay, A.H., Toomey, D.R., Solomon, S.C., 2001. Microearthquake characteristics 374
and crustal Vp/Vs structure at the Mid-Atlantic Ridge, 35°N. J. Geophys. Res. 375
106, 2017-2034. 376
Bence, A.E., Albee, A.L., 1968. Empirical correction factors for the electron 377
microanalysis of silicates and oxides. J. Geol. 76, 382-403. 378
Blackman, D.K., Cann, J.R., Janssen, B., and Smith, D.K., 1998. Origin of 379
extensional core complexes: evidence from the MAR at Atlantis Fracture Zone. J. 380
Geophys. Res. 103, 21315-21334. 381
Blackman, D.K., Karson, J.A., Kelley, D.S., Cann, J.R., Früh-Green, G.L., Gee, J.S., 382
Hurst, S.D., John, B.E., Morgan, J., Nooner, S.L., Ross, D.K., Schroeder, T.J., 383
Williams, E.A., 2004. Geology of the Atlantis Massif (MAR 30°N): implications 384
for the evolution of an ultramafic oceanic core complex. Mar. Geophys. Res. 23, 385
443–469. 386
Blackman, D.K., Ildefonse, B., John, B.E., Ohara, Y., Miller, D.J., MacLeod, C.J., 387
and Expedition 304/305 Scientists, 2006, Proceedings of the Integrated Ocean 388
Drilling Program, Volume 304/305: College Station, Texas, Integrated Ocean 389
Drilling Program Management International, Inc., 390
doi:10.2204/iodp.proc.304305.2006. 391
Brace, W.F., 1984. Permeability of crystalline rocks - new insitu measurements. J. 392
Geophys. Res. 89, 4327-4330. 393
Cann, J.R., Blackman, D.K., Smith, D.K., McAllister, E., Janssen, B., Mello, S., 394
Avgerinos, E., Pascoe, A.R., Escartin, J., 1997. Corrugated slip surfaces formed 395
at ridge-transform intersections on the Mid-Atlantic Ridge. Nature 385, 329–332. 396
Collins, J.A., Tucholke, B.E., Canales, J.-P., 2001. Structure of Mid-Atlantic Ridge 397
megamullions from seismic refraction experiments and multichannel seismic 398
reflection profiling. Eos, Trans. Am. Geophys. Union 82, F1100. 399
Escartin, J., Mével, C., MacLeod, C.J., McCaig, A.M., 2003. Constrains on 400
deformation conditions and the origin of oceanic detachments: The Mid-Atlantic 401
Ridge core complex at 15°45’N. Geochem. Geophys. Geosyst. 4, 1067, 402
doi:10.1019/2002GC000472, 2003.4 403
Fisher, A.T., 1998. Permeability within basaltic oceanic crust. Rev. Geophys. 36, 404
143-182. 405
Hacker, B.R., Peacock, S.M., Abers, G.A., Holloway, S.D., 2003. Subduction 406
factory: 2. Are intermediate-depth earthquakes in subducting slabs linked to 407
metamorphic dehydration reactions? J. Geophys. Res., 108, 2030, 408
doi:10.1029/2001JB001129. 409
Hirose, T., Hayman, N.W., 2008. Structure, permeability, and strength of a fault zone 410
in the footwall of an oceanic core complex, the Central Dome of the Atlantis 411
Massif, Mid-Atlantic Ridge, 30°N. J. Struct. Geol. 30, 1060-1071. 412
Holland, T., Blundy, J., 1994. Non-ideal interactions in calcic amphiboles and their 413
bearing on amphibole-plagioclase thermometry. Contrib. Miner. Petrol. 116, 414
433-447. 415
Ildefonse, B., Blackman, D.K., John, B.E., Ohara, Y., Miller, D.J., MacLeod, C.J. 416
and Integrated Ocean Drilling Program Expeditions 304/305 Science Party, 2006. 417
Oceanic core complexes and crustal accretion at slow-spreading ridges. Geology, 418
35, 623-626. 419
Iwamori, H., 2007. Transportation of H2O beneath the Japan arcs and its implications
420
for global water circulation. Chem. Geol. 239, 182-198. 421
Iwamori, H., Zhao, D., 2000. Melting and seismic structure beneath the northeast
422
Japan arc. Geophys. Res. Lett. 27, 425–428.
423
Kawakatsu, H., Watada, S., 2007. Seismic evidence for deep-water transportation in 424
the mantle. Science, 316, 1468, doi: 10.1126/science. 1140855. 425
Kita, S., Okada, T., Nakajima, J., Matsuzawa, T., Hasegawa, A., 2006. Existence of a 426
seismic belt in the upper plane of the double seismic zone extending in the 427
along-arc direction at depths of 70-100 km beneath NE Japan. Geoph. Res. Lett., 428
33, L24310, doi: 10.1029/2006GL028239. 429
Leake, B.E., 1978. Nomenclature of amphiboles. Mineralogical Magazine, 42, 430
533-563. 431
Nakamura, Y., Kushiro, I., 1970. Compositional relations of coexisting 432
orthopyroxene, pigeonite and augite in a tholeiitic andesite from Hakone volcano. 433
Contrib. Miner. Petrol. 26, 265-275. 434
Peacock, S.M., 1993. Large-scale hydration of the lithosphere above subducting 435
slabs. Chem. Geol., 108, 49–59. 436
Serra, O., 1989. Formation MicroScanner Image Interpretation: Houston 437
(Schlumberger Educ. Services), SMP-7028. 438
Tatsumi, Y., 1989. Migration of fluid phases and genesis of basalt magmas in
439
subduction zones. J. Geophys. Res. 94, 4697–4707.
440
Tsuji, Y., Nakajima, J., Hasegawa, A., 2008. Tomographic evidence for hydrated 441
oceanic crust of the Pacific slab beneath northeastern Japan: Implications for 442
water transportation in subduction zones. Geophys. Res. Lett., 35, L15308, doi: 443
10.1029/2008GL034461. 444
Tucholke, B.E., Lin, J., Kleinrock, M.C., 1998. Megamullions and mullion structure 445
defining oceanic metamorphic core complexes on the mid-Atlantic ridge: J. 446
Geophys. Res. 103, 9857–9866, doi:10.1029/98JB00167. 447
Veblen, D.R., Burnham, C.W., 1978. New biopyriboles from Chester, Vermont: I. 448
Descriptive mineralogy. Amer. Mineral., 63, 1000-1009. 449
Wolfe, C.J., Purdy, G.M., Toomey, D.R., Solomon, S.C., 1995. Microearthquake 450
chracteristics and crustal velocity structure at 29 °N on the Mid-Atlantic Ridge: 451
The architecture of a slow spreading segment. J. Geophys. Res. 100, 452
24449-24472. 453
Figure captions 455
456
Figure 1. 457
Borehole data for the interval between 720 and 780 mbsf within Hole 458
U1309D drilled by IODP Expeditions 304 and 305. The fault zone occurs in the 459
interval between 746.2 and 751.0 mbsf (colored in yellow), for which permeability 460
measurements were performed. A distinct dark layer occurs at the top of the 461
east-dipping zone at around 745.5 mbsf, from where core was not recovered (colored 462
in pink). See the text for details. 463
464
Figure 2. 465
(A) Ultracataclasite recovered from Core U1309D 152R1 (for sample 466
location within the borehole, see the right-hand side of Fig. 1). An apparent reverse 467
sense of movement (white arrows) is apparent from the geometries of asymmetric 468
fragments. The white rectangle represents the area from which a thin section was 469
made. (B) Microphotograph of the entire thin section cut from the area indicated by 470
the rectangle in A. Width: 3 cm. Cataclasite consists of plagioclase and amphibole 471
fragments in a matrix of amphibole. Black rectangles show the areas enlarged in C 472
and F. (C) Amphibole-dominated films within the ultracataclasite. (D) and (E) 473
Enlargements of the amphibole-dominated films shown in C, showing flow 474
structures around epidote (EP) and plagioclase grains. (F) Enlargement of the 475
amphibole-dominated films shown in B. Very fine-grained fragments were replaced 476
by the amphibole films. 477
478
Figure 3. 479
Points selected for EPMA analysis shown on a BEI image of the amphibole 480
films shown in Fig. 2C. A: amphibole, Pl: plagioclase, E: epidote. Representative 481
results of the analyses are listed in Table. 1. 482
483
Figure 4. 484
Gas permeability data as a function of effective pressure for host rocks (A) 485
and fault rocks (B) (see Table 2 for summary). Data are the average values of four 486
measurements. Error bars are smaller than the data symbols. 487
(B) Microphotograph of the entire thin section cut from the area indicated by the rectangle in A. Width: 3 cm. Cataclasite consists of plagioclase and amphibole fragments in a matrix of amphibole. Black rectangles show the areas enlarged in C and F. (C) Amphibole-dominated films within the ultracataclasite. (D) and (E) Enlargements of the amphibole-dominated films shown in C, showing flow structures around epidote (EP) and plagioclase grains. (F) Enlargement of the amphibole-dominated films shown in B. Very fine-grained fragments were replaced by the amphibole films.