HAL Id: hal-01361934
https://hal.archives-ouvertes.fr/hal-01361934
Submitted on 7 Sep 2016
HAL is a multi-disciplinary open access
archive for the deposit and dissemination of
sci-entific research documents, whether they are
pub-lished or not. The documents may come from
teaching and research institutions in France or
abroad, or from public or private research centers.
L’archive ouverte pluridisciplinaire HAL, est
destinée au dépôt et à la diffusion de documents
scientifiques de niveau recherche, publiés ou non,
émanant des établissements d’enseignement et de
recherche français ou étrangers, des laboratoires
publics ou privés.
Pressure-induced reduction of the Landau-Peierls
instabilities in a side-chain polymer liquid crystal with
reentrant polymorphism
G Pépy, P Baroni, Laurence Noirez
To cite this version:
G Pépy, P Baroni, Laurence Noirez. Pressure-induced reduction of the Landau-Peierls instabilities
in a side-chain polymer liquid crystal with reentrant polymorphism. Physical Review E , American
Physical Society (APS), 2003, �10.1103/PhysRevE.67.041714�. �hal-01361934�
Pressure-induced reduction of the Landau-Peierls instabilities in a side-chain polymer
liquid crystal with reentrant polymorphism
G. Pe´py, P. Baroni, and L. Noirez*
Laboratoire Le´on Brillouin (CEA-CNRS), CE Saclay, 91191 Gif-sur-Yvette Cedex, France
共Received 16 October, 2002; published 29 April 2003兲
Cyanobiphenyl mesogens are known to exhibit partially bilayered smectic A (SAd) and also reentrant
nem-atic (Nre) phases. Nematic and smectic orders are coupled parameters which depend both on temperature and pressure. We report the first structural study of the influence of a hydrostatic pressure on the smectic phase. This study was carried out on a side-chain liquid crystalline polymer, by neutron diffraction using two spe-cifically designed pressure cells. These results concluded first that the pressure acts on the phase elastic constants via a reduction of the layer fluctuations giving rise to a hardening of the phase together with an extension of the smectic domain towards higher temperatures. Second, the SAd-Nrephase transition tempera-ture remains unchanged in the studied pressure range revealing that the polymer component plays an important role which allows us to subtract the associated packing interactions from the pressure-induced volume reduc-tion.
DOI: 10.1103/PhysRevE.67.041714 PACS number共s兲: 61.30.⫺v, 64.70.Md, 61.25.Hq
I. INTRODUCTION
Liquid crystal phases are characterized by a long-range orientational order. Numerous studies on liquid crystals un-der hydrostatic pressure 关1兴, display interesting pressure-induced phenomena which, indirectly, seem to indicate that the long-range order is disturbed. It has been shown, for example, that reentrant nematic phases can appear and that phase transition temperature shifts are commonly observed 关1,2兴. These pressure-induced effects are inferred from the packing properties of the system when the molar volume is reduced. However, despite the numerous investigations, none consider the eventual structural modifications which accom-pany the pressure-induced liquid crystallinity. We propose to describe the system in terms of pressure-induced correlation lengths and layer spacing which are relevant parameters to account for the phase structure. This structural investigation is particularly noteworthy in the smectic phase since it will be shown that the characteristic lengths can be tremendously modified under pressure underlining a correlated change of dynamics. This study is also unique in the case of side-chain liquid crystal polymers 共SCLCPs兲. In SCLCPs, the liquid crystal ordering influences the chain conformation: it acts as a stress competing with the main chain entropy. Wang and Warner 共WW兲 关3兴 proposed a reference model which fore-sees a wide variety of mesophases. Experimentally, most of SCLCPs display only a narrow succession of phases and conformations which correspond mainly to conventional nematic and smectic phases and to prolate and oblate main-chain conformations, respectively 关4兴. While chemists can tailor materials with discrete changes only 共modifying for instance the spacer length兲, the pressure is a continuous vari-able; the application of a hydrostatic pressure introduces a
specific volume variation which is, by way of the liquid crys-talline phase, anisotropically distributed.
From a theoretical point of view, it is useful to point out that the specific volume is taken into account into the mod-els. The analytical theory proposed by WW for nematic side-chain liquid crystal polymers is based on five interactions between the SCLCP constitutive components, and the pancy ratio for the side-chain mesogens to the volume occu-pied per monomer. Many variants of the three main nematic structures共called NI, NII, and NIIIand corresponding to the oblate and two types of prolate main chain conformations, respectively兲 are predicted, with either strong or poor order-ing of the main chain. Finally, based on molecular calcula-tions, Dowell 关5兴 foresees modified smectic structures by only slightly changing the SCLCP’s molecular parameters.
Pressure is thus a very convenient tool to test the stability of SCLCPs, to compare the behavior of their highly viscous phases to those of low-molecular-weight liquid crystals 关2兴, to explore its influence on the coupling with the polymer main-chain conformation, and maybe to reveal an effect of the glass transition due to an exacerbated polymeric nature of the SCLCP under pressure 关6兴.
This paper reports thus the first structural information, obtained in situ, by applying a hydrostatic pressure on a SCLCP. Neutron diffraction was first carried out with a pres-sure cell reaching prespres-sures up to 400 bar 关7兴 and then ex-tended, using an improved pressure setup, to a high pressure regime up to 1200 bar. The main parameters affected by a pressure variation will be identified and their evolution will be interpreted in terms of molecular interactions. In a second step, the results corresponding to a higher pressure range共up to 1200 bar兲 will be displayed. An overall analysis indicating the principal features of the pressure-induced behavior will conclude the paper.
The sample studied, noted PA-CN, is a polyacrylate main chain to which a mesogen consisting of a cyanobiphenyl group is linked:
⬃关CH2⫺CH2兴⬃ 兩
CO2⫺共CH2兲6⫺O⫺⫺⫺CN
This polymer exhibits a reentrant behavior 关8兴. The sample studied here has a molecular weight of MW⫽98 000 and a
polydispersity I⫽12. It displays the following phase se-quence 共DSC measurements 10 °C/min兲:
Tg ↔ 35 °C Nre↔ 83 °C SAd ↔ 110 °C N ↔ 122 °C I,
where I indicates the isotropic phase, N the high temperature nematic phase, SAda partially bilayered smectic-A phase, Nre a low temperature 共reentrant兲 nematic phase, and Tg the
glassy state. This peculiar behavior is attributed to a compe-tition between different short range but strong electric dipo-lar interactions induced by the terminal cyano group which favors the formation of antiparallel molecular association 共pairing兲 to the detriment of long-range monolayers 共nonpolar-nonpolar interactions兲 关9兴. Pairing produces smec-tic phases characterized by layer thicknesses not commensu-rate but longer than the molecular length 共the SAd phase兲.
The competition between different arrangements is tempera-ture dependent, leading in specific cases to the restoration of the usual long-range monolayer phase 关10兴. The Nre-SAd
phase transition temperature corresponds thus to the point where these antagonist interactions are balanced.
II. EXPERIMENT
The polymer sample was encapsulated under vacuum in an internal container with a flexible wall made of Kapton 共from Du Pont de Nemours兲. In the pressure cell, this con-tainer is surrounded by D2O, the pressure transmitting me-dium. In a first step, the pressure study was carried out using a zircalloy cell关7兴 enabling us to reach a nominal pressure of 400 bar and a temperature of 150 °C. In a second step, the experiment was extended up 1200 bars at 150 °C with a new pressure cell共Fig. 1兲. Its body is made of beryllium copper and the windows are made of sapphire, allowing a direct optical sample observation and the possibility to carry out small angle neutron scattering experiments to access to pressure-induced conformations of the polymer main chain 关11兴.
The measurements were performed using the 3T1 diffrac-tometer of the Laboratoire Le´on Brillouin at the Orphe´e re-actor, Saclay. It consists of characterizing by neutron diffrac-tion the smectic structure associated with the 001 reflecdiffrac-tion at q⬇0.188 Å⫺1. The neutron wavelength was 2.356 Å. During the whole experiment, the pressure cell was kept in the gap of a 1.4 T electromagnet in order to align the me-sophase monodomains. The scattering angle was scanned over the position of the 001 smectic reflection, through the full temperature range, for a set of pressure values. The shape of the 001 smectic reflection measured with an angular resolution of 20
⬘
was approximated to a Gaussian curve:S共兩qជ兩 兲⫽S0exp
再
⫺冋
16 ln 22冉
共qh⫺q0兲2 ⌬q储 2 ⫹ q⬜2 ⌬q⬜2冊册冎
, where S0 is the susceptibility corresponding to the intensity maximum at (0,0,q0). The peak position q0, the intensity maximum S0 共determined from a longitudinal scan兲, and the widths⌬q储, ⌬q⬜along the longitudinal axis共parallel to thedirector兲 and along the transverse direction, respectively, are systematically determined versus temperature and pressure. The widths ⌬q储, ⌬q⬜ are related to the respective correla-tion lengths 储, ⬜ via ⫽4/⌬q. The correlation lengths are corrected from the instrumental resolution broadening effects using the following approximate relationship between the measured width and the effective one: ⌬qmeasured2 ⫽⌬qresolution
2 ⫹⌬q
effective
2 共the Rietveld approximation兲. The longitudinal and the transverse resolution values, deduced from a single crystal scattering, were 0.028 Å⫺1 关full width at half maximum 共FWHM兲兴 and 0.008 Å⫺1 共FWHM兲, re-spectively, for the current spectrometer configuration.
III. RESULTS AND DISCUSSION
We shall present and analyze a first set of results obtained in the intermediate pressure range共from 1 to 400 bar兲. First and second sets of results differ by the use of two distinct pressure cells giving access to low and high pressure ranges, respectively. By increasing the pressure from 1 to 400 bar, several major modifications attributed to the pressure effect can be noticed.
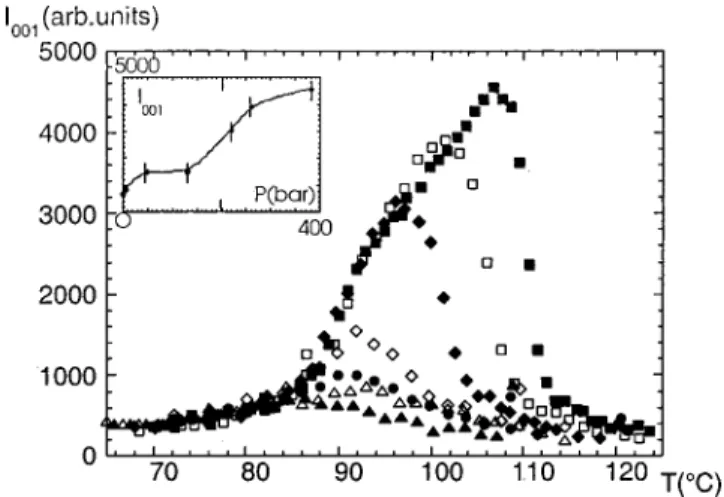
共a兲 Figure 2 displays the evolution of the 001 intensity maximum S0 versus temperature. These curves present simi-lar shapes characterized by temperature intervals defined by a sharp intensity evolution 共identified at atmospheric pres-sure as the emergence of the smectic phase兲. Whatever the pressure, its effect on S0becomes notable only above a criti-cal temperature T⫽83 °C where the pressure-induced S0 values depart clearly from the atmospheric values, reaching up to the sevenfold at 380 bar. Since the intensity is con-nected to the number of scatterers involved in the smectic FIG. 1. Schematic representation of the high pressure cell
共double cell兲. The high pressure plug exercises the pressure on the
sapphire windows. The O-ring and the Kapton seal ensure the seal-ing of the whole set.
PE´ PY, BARONI, AND NOIREZ PHYSICAL REVIEW E 67, 041714 共2003兲
ordering, the S0 increase indicates that the pressure induces an improvement of the localization of the mesogens into the layers; the dipolar pairing at the origin of the partially bilay-ered structure is reinforced.
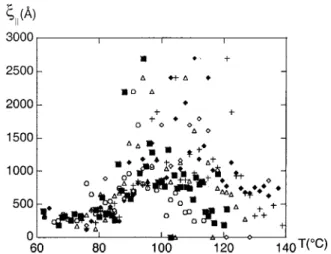
共b兲 Figure 3共a兲 shows the correlation length储 along the
director共longitudinal direction兲 as a function of the tempera-ture at different pressure values.储reaches values about 400
Å at 100 °C at atmospheric pressure. Under pressure, the储
curve is shifted, along the reentrant nematic branch, towards higher correlation values. Along the direction perpendicular to the director 共transverse direction兲, the correlation length
⬜is also deeply affected by the pressure关Fig. 3共b兲兴. Values of ⬜ of about 400 Å are measured at atmospheric pressure which extends up to 2500 Å at 380 bar. These correlation length evolutions indicate that the pressure reduces mainly the smectic layer distorsion; this is here illustrated by the huge decrease of the magnitude of the mesogen fluctuations which give rise to the broadening of the smectic reflection; the smectic layers formed under pressure present a much higher layer parallelism and the interlayer mesogen distance is repeated over a much larger range. Both elastic constants related to the layer dilatation and the undulations are re-duced. These modifications are coherent with an increase of the intensity reflection 共Fig. 2兲.
共c兲 Finally, the smectic layer distance itself is also pres-sure dependent共Fig. 4兲. The evolution is mainly observable above 83 °C. Below this temperature, no long-range smectic arrangement exists anymore and the short range correlation distance becomes relatively insensitive to the applied pres-sure. The examination of the position of the 001 reflection reveals that the layer spacing increases sensibly at moderate pressure with respect to the atmospheric pressure 共⬇4% of layer spacing increase from 7 to 27 bar兲 whereas it seems to be stabilized from 27 bar up to 310 bar at a constant value
d⬇34 Å. This layer distance increase versus pressure is of
the same order as the effect of a temperature decrease. It is consistent with the previous interpretations, i.e., the layer distance decrease is coherent with a reduction of the layer distorsion.
FIG. 2. Evolution of the 001 intensity 共maximum value兲 scanned along the longitudinal axis共along the director兲 versus tem-perature, from atmospheric pressure up to 380 bar. The convergence of the intensity values at low temperature indicates that the Nre-SAd remains unaffected by the external pressure.䉱, 1 bar; 䉭, 7 bar; 䊉, 50 bar;〫, 130 bar; ⽧, 220 bar; 䊐, 260 bar; 䊏, 380 bar. In the inset, the evolution of the 001 intensity is displayed versus pressure; a leap in the intensity variation is observed at about 200 bar.
FIG. 3. 共a兲 Evolution of the correlation length along the director
储(Å) 共longitudinal axis兲. 䉱, 1 bar; 䉭, 7 bar; 〫, 130 bar; ⽧, 220
bar; 䊐, 260 bar; 䊏, 380 bar. 共b兲 Evolution of the correlation length perpendicular to the director 共transverse direction兲 ⬜(Å):
䉭, 7 bar; 䊉, 50 bar; 〫, 130 bar; ⽧, 220 bar; 䊐, 260 bar; 䊏, 380
bar. These values are deduced from the full widths at half maximum
共FWHM兲 of the 001 smectic reflection. The values corresponding to
the phase transition temperatures at atmospheric conditions are in-dicated by a dotted line.
FIG. 4. Evolution of the smectic layer thickness versus tempera-ture from 3 to 380 bar.〫, 3 bar; 䊐, 27 bar; 䊉, 380 bar.
The three preceding points indicate that all the structural parameters of the smectic phase are modified under pressure. To determine the limits of the phase transitions, let us take as an internal reference the value taken by the correlation length
at atmospheric pressure, corresponding to the Nre-SAd
and the SAd-N transition temperatures deduced from DSC and microscopy measurements 关8共b兲兴. At both transitions (TNre-SAd(atmospheric pressure)⫽83 °C and TSAd-N (atmo-spheric pressure)⫽110 °C), the correlation lengths are ap-proximately equal ⬜atm⬵储atm⫽4/⌬q⫽310⫾10 Å. Us-ing the 储atm and ⬜atm values as an internal criterium to define the limits of the smectic phase, one can estimate the high and low nematic-smectic transition temperatures (TNre-SAd and TSAd-N, respectively兲 and examine their dis-placement versus pressure. The following observations can be drawn with increasing pressure
共a兲 From the evolution of the correlation lengths储and⬜ 关Figs. 3共a兲 and 3共b兲兴, it can be established that the SAd-N
transition is shifted towards higher temperatures. Both paral-lel and perpendicular correlation lengths give coherent val-ues, indicating that the transition temperature follows ap-proximately the same linear progression versus pressure: (TSAd-N-98) (°C)⬵0.046.p共bar兲 共Fig. 5兲. This pressure de-pendence is a simple variation which indicates that one pa-rameter is sufficient to describe the transition. Neglecting the volume variation, such a pressure dependence means that it can be described by a simple variation of the extension 共number兲 of fluctuations involved in the transition. The de-pendence and the slope dT/d p⬵4.6 °C/kbar are coherent with what is found for secondary transitions 关6兴. The com-parison of Figs. 3 and 2 shows that the evolution ofversus temperature and pressure is remarkably similar to the 001 intensity variation. At high pressure 共380 bar兲, the SAd-N
transition coincides with the abrupt fall of correlation length
共Fig. 3兲 which also corresponds to a leap of the 001 inten-sity共Fig. 2兲. For pressures below 380 bar, a progressive and simultaneous decrease of both parameters共intensity and
cor-relation lengths兲 is observed by increasing the temperature before entering into the high temperature nematic phase. The correlation lengths and the values of the 001 intensity seem to be thus strongly coupled so that the 001 intensity value at
TS
Ad-N 共atmospheric pressure兲 can also be used as a criterium
to determine the borders of the smectic phase. On Fig. 5 are superposed the transition temperatures deduced from both correlation lengths and the 001 intensity evolution criteria. The transition temperatures deduced from the different pa-rameters are in good agreement. It is remarkable to notice that whatever the pressure, with increasing the temperature, all the parameters (S0,储,⬜) keep on the same master branch up to their curve maximum共see in particular Fig. 2兲. The displacement of the 001 intensity maximum along this branch is clearly observed from 130 bar to 380 bar; the pres-sure essentially extends the asymptotic limit up to the highest value of the intensity. This evolution is the signature of a pressure-induced stabilization of the smectic fluctuations into a long range smectic order which, once formed, is no longer sensitive to a further pressure increase 共within this studied pressure range兲, providing only a shift of the SAd-N transi-tion temperature towards higher temperatures. These fluctua-tions are specific to a two-dimensional 共2D兲 arrangement of the smectic state 共also called Landau-Peierls instabilities兲; their destruction means that the smectic arrangement tends to a crystalline structure关12兴. At atmospheric pressure, the ther-mal activation still allows short range smectic fluctuations and thus produces a retardation of the N-SAd transition
tem-perature which is progressively shortened under pressure. 共b兲 On the pressure-temperature evolution diagrams of the longitudinal and the transverse correlation length储 and⬜, respectively, 关Figs. 3共a兲 and 3共b兲兴, and of the 001 intensity 共Fig. 2兲, the Nre-SAd transition can be easily identified by the
intersection point of the curves at different pressures which superpose at low temperature. This point corresponds to
TNre-SAd⬵83 °C, which is strictly the Nre-SAdtransition
tem-perature already determined at atmospheric pressure. None of the structural parameters of the Nre-SAd transition is
af-fected by the external pressure up to 400 bar; the Nre-SAd
transition temperature remains invariant with pressure. This result is consistent with the previous observation which re-veals the asymptotic development of a pressure-temperature branch 共particularly observable on Fig. 2兲. Finally, the
Nre-SAd transition temperature invariance is also compatible
with the absence of the pressure-induced layer spacing change below 88 °C 共Fig. 4兲. The interactions involved are thus not, in this studied range, affected by the pressure.
In a second step, the present study is extended to sures up to 1200 bar using another and new designed pres-sure cell equipped with sapphire windows共Fig. 1兲 关10兴. Only three parameters 关the 001 intensity maximum S0 共Fig. 6兲 determined from the longitudinal scan, the full width at half maximum along the longitudinal axis⌬q储 giving rise to the
correlation length 储共Fig. 7兲, and the peak position q0 共Fig. 8兲兴 are measured. Because of the similitude between the pressure induced evolutions of the correlation lengths and the intensity maximum, it will be supposed that the two mea-sured parameters (S0 and 储) are sufficient to describe the
pressure effects and more particularly the transition tem-FIG. 5. Determination of the SAd temperature domain versus
pressure. Variations of the NRe-SAd(⫹) and SAd-N transition tem-peratures versus pressure. The values are deduced from both the correlation length variation 储 at high pressure measurements共⫻兲 and low pressure measurements共䊉兲, and from the intensity evolu-tion at low pressure measurements共〫兲 and high pressure measure-ments共䊊兲.
PE´ PY, BARONI, AND NOIREZ PHYSICAL REVIEW E 67, 041714 共2003兲
peratures. The measurements are carried out from 200 bar to 1200 bar, thus covering partly the preceding lower pressure diagram. From 400 to 1200 bar, one can notice an apparent continuity of the behavior in agreement with the lower pres-sure evolution; the 001 intensity maximum reaches at 1200 bar almost twice the value displayed at 380 bar 共Fig. 6兲. However, this progression is not linear; the pressure has a more pronounced effect on the intensity maximum above 300 bar and stationary values seem to be reached as the pressure approaches 600–1200 bar共Fig. 6 and inset兲.
The quasi-invariance of the intensity maximum above 600 bar up to 110 °C would indicate that no smectic fluctuations are present anymore in the nematic phase which has been converted into a long range rigid smectic order. Since the pressure mainly acts on the layer distorsion, the existence of a characteristic pressure above which the layers rigidity is first clearly enhanced and then saturated, is related to a non-linear modification of the layer elastic constants which de-scribe the layer undulation dynamic 关13,14兴. In the Landau–de Gennes–McMillan description 关12兴, the elastic constants appear as a coefficient of the development of the free energy variation. The elastic constant called B expresses the restoring force for fluctuations 共i.e., restoring the layer thickness兲. B is supposed to vary as储. The apparent
sta-tionary values obtained above 600 bar would then indicate that a limit of elastic constants has been reached. It is opened to question to know what would be the issue of a further pressure increase on these parameters, and if it could make a new phase transition occur. Finally, the study in the high pressure range of the intensity maximum also confirms the two tendencies observed at lower pressure; the Nre-SAd tran-sition temperature still remains invariant under high pressure till 1200 bar, while the higher SAd-N transition temperature goes on increasing following approximately a linear varia-tion with the pressure共Fig. 5兲.
IV. CONCLUSIONS
This neutron diffraction study of this reentrant polymer liquid crystal has shown the relevance of the determination
of the structural phase parameters 共correlation lengths兲 to characterize the pressure-induced modifications of the smec-tic phase. Concerning the N-SA transition temperatures, an
extension of the smectic interval towards higher tempera-tures is observed, similarly to what is usually observed in low molecular weight liquid crystals in the low pressure re-gime 关1,2兴. The structural analysis has revealed in addition that the transition temperature shift is associated with a pressure-induced enhancement of the smectic ordering. In-deed, the significant increase of the correlation lengths 共and the correlated intensity increase兲 with increasing pressure demonstrates a reinforcement of the smectic phase, whose phase domain extends only towards higher temperature and which corresponds to a reduction of the layer undulations 共Landau-Peierls instabilities兲 and a reduction of the layer spacing共Figs. 4 and 8兲. The pressure acts thus at the scale of the elastic constants of the smectic layers. Quantitatively, the characteristic features observed below 400 bar still exist up to 1200 bar with a possible saturation of the maximum in-tensity, which might mean a quasisuppression of the smectic undulation instabilities.
FIG. 6. High pressure evolution of the 001 intensity共maximum value兲 scanned along the longitudinal axis 共along the director兲 ver-sus temperature from 200 to 1200 bar.䊊, 200 bar; 䊏, 400 bar; 䉭, 600 bar;⫹, 800 bar; ⽧, 900 bar; 〫, 1200 bar. In the inset, the evolution of the 001 intensity is displayed versus pressure. The values tend to saturate above 600 bar.
FIG. 7. High pressure behavior of the correlation length储 ver-sus temperature at various pressure values from 200 to 1200 bar.䊊, 200 bar;䊏, 400 bar; 䉭, 600 bar; ⫹, 800 bar; ⽧, 900 bar; 〫, 1200 bar.
FIG. 8. Evolution of the smectic layer thickness versus tempera-ture in the high pressure regime.䊊, 200 bar; 䊉, 800 bar; ⫻, 1200 bar.
Concerning the reentrant nematic phase, while pressure studies of small molecules of reentrant cyanobiphenyl liquid crystals have shown that the nematic-smectic separation line describes an ellipse 关2共b兲兴, the PA-CN pressure-temperature phase diagram does not reproduce this shape. The linear de-pendence of the high temperature SA-N transition
tempera-ture with the pressure upwards 1200 bar, is only consistent with the low pressure region of small liquid crystalline mol-ecules. Contrary to small liquid crystalline molecules, the
Nre-SAd transition temperature remains surprisingly
unaf-fected by the pressure. Measurements carried on low-molecular-weight liquid crystals have shown that the density is unchanged versus pressure at the Nre-SAd transition due a
full packing of the pairing interaction共and thus the Nre-SAd
transition temperature changes兲 关2共b兲兴, revealing that the re-entrant transition has a local origin and that, in the case of the polymer homologue, it is not submitted to the pressure-induced reduction of the density. This feature is coherent with the absence of variation of the smectic fluctuation layer thickness below 88 °C 共in the Nre phase兲. We can first con-clude that the pressure range applied here is not sufficiently large to affect locally the pairing interaction. Second, since the structure and the temperature of the Nre-SAd transition
remains unchanged by varying the pressure, it implies that the won energy has been converted in a nonliquid crystalline specific volume variation. The differences are between low molecular weight compounds and SCLCPs being inferred to the polymeric nature; the former compensates the whole pressure-induced volume variation and thus should be strongly affected by the pressure change. Finally, in the smectic phase, since polymer main chains are confined be-tween the mesogen layers 关15兴, and since pressure is able to suppress the layer distorsion and to condense the smectic fluctuations into a long range smectic order towards tempera-tures higher than at atmospheric pressure, it acts conse-quently on the polymer chain entropy. We have thus demon-strated that pressure exacerbates antagonist tendencies on SCLCPs giving rise to a specific pressure-dependent behav-ior. Future studies on the pressure-induced polymer confor-mation seems to be therefore particularly expected.
ACKNOWLEDGMENT
The authors are very grateful to G. Kirsch for the synthe-sis of the monomer and the polymerization of the sample.
关1兴 S. Chandrasekhar and R. Shashidhar, Adv. Liq. Cryst. 4, 83 共1979兲.
关2兴 共a兲 L. Liebert and W. B. Daniels, J. Phys. 共Paris兲 38, 333 共1977兲; A. N. Kalkura, R. Shashidhar, and N. Subbramanaya
Rayj Urs, J. Phys.共France兲 44, 51 共1983兲; 共b兲 P. E. Cladis, D. Guillon, F. R. Bouchet, and P. L. Finn, Phys. Rev. A 23, 2594
共1981兲; P. E. Cladis, R. K. Bogardus, W. B. Daniels, and G. N.
Taylor, Phys. Rev. Lett. 39, 720共1977兲.
关3兴 X. J. Wang and M. Warner, J. Phys. A 19, 2215 共1986兲; M.
Warner, Philos. Trans. R. Soc. London, Ser. A 348, 59共1994兲.
关4兴 共a兲 Side Chain Liquid Crystal Polymers, edited by C. B.
McArdle共Chapman and Hall, New York, 1989兲; 共b兲 L. Noirez, P. Keller, and J. P. Cotton, Liq. Cryst. 18, 129共1995兲.
关5兴 F. Dowell, Phys. Rev. A 28, 6 共1983兲; 28, 3520 共1983兲; F.
Dowell, ibid. 28, 6共1983兲; 28, 3526 共1983兲; Mol. Cryst. Liq. Cryst. 155, 457共1988兲.
关6兴 R. W. Warfield and B. Hartmann, Polymer 23, 1835 共1982兲. 关7兴 G. Pe´py, P. Baroni, and L. Noirez, Mol. Cryst. Liq. Cryst. Sci.
Technol., Sect. A 364, 1235共2001兲. Note: in this reference, the data corresponding to the transverse and longitudinal
correla-tion lengths have been exchanged.
关8兴 共a兲 T. I. Gubina, S. G. Kostromin, R. V. Talroze, V. P. Shibaev,
and N. A. Plate, Vysokomol. Soedin., Ser. B 28, 394 共1986兲;
共b兲 P. Le Barny, J. C. Dubois, C. Friedrich, and C. Noe¨l,
Polym. Bull.共Berlin兲 15, 341 共1986兲; 共c兲 N. Lacoudre, A. Le Borgne, N. Spassky, J. P. Vairon, P. Le Barny, J. C. Dubois, S. Esselin, C. Friedrich, and C. Noe¨l, Mol. Cryst. Liq. Cryst. 155, 113共1988兲.
关9兴 J. O. Indekeu and A. W. Becker, Phys. Rev. A 33, 1158 共1986兲. 关10兴 F. Hardouin, G. Sigaud, M. F. Achard, and H. Gasparoux,
Phys. Lett. 71A, 347共1979兲.
关11兴 G. Pepy, P. Baroni 共unpublished兲.
关12兴 P. G. de Gennes and J. Prost, The Physics of Liquid Crystals,
2nd ed.共Clarendon Press, Oxford, 1993兲.
关13兴 P. G. de Gennes, Mol. Cryst. Liq. Cryst. 21, 49 共1973兲; J. Phys. 共Paris兲, Colloq. 30, C4-65 共1969兲.
关14兴 J. P. Poirier, Introduction to the Physics of the Earth’s Interior 共Cambridge University Press, Cambridge, England, 2000兲. 关15兴 L. Noirez, P. Keller, P. Davidson, F. Hardouin, and J. P. Cotton,
J. Phys.共France兲 49, 1993 共1988兲.
PE´ PY, BARONI, AND NOIREZ PHYSICAL REVIEW E 67, 041714 共2003兲