HAL Id: hal-02440036
https://hal.archives-ouvertes.fr/hal-02440036
Submitted on 13 Nov 2020
HAL is a multi-disciplinary open access
archive for the deposit and dissemination of
sci-entific research documents, whether they are
pub-lished or not. The documents may come from
teaching and research institutions in France or
abroad, or from public or private research centers.
L’archive ouverte pluridisciplinaire HAL, est
destinée au dépôt et à la diffusion de documents
scientifiques de niveau recherche, publiés ou non,
émanant des établissements d’enseignement et de
recherche français ou étrangers, des laboratoires
publics ou privés.
Performance of the Advanced GAmma Tracking Array
at GANIL
J. Ljungvall, R.M. Pérez-Vidal, A. Lopez-Martens, C. Michelagnoli, E.
Clément, J. Dudouet, A. Gadea, H. Hess, A. Korichi, M. Labiche, et al.
To cite this version:
J. Ljungvall, R.M. Pérez-Vidal, A. Lopez-Martens, C. Michelagnoli, E. Clément, et al.. Performance
of the Advanced GAmma Tracking Array at GANIL. Nucl.Instrum.Meth.A, 2020, 955, pp.163297.
�10.1016/j.nima.2019.163297�. �hal-02440036�
Performance of The Advanced GAmma Tracking Array (AGATA) at GANIL
J. Ljungvalla,∗, R.M. P´erez-Vidalb, A. Lopez-Martensa, C. Michelagnolic,d, E. Cl´ementc, A. Gadeab, A. Korichia, M. Labichek, N. Lalovi´ce, H. J. Lic, F. Recchiah, and the AGATA collaboration
aCSNSM, Universit´e Paris-Sud, CNRS/IN2P3, Universit´e Paris-Saclay, 91405 Orsay, France bInstituto de F´ısica Corpuscular, CSIC - Universidad de Valencia, E-46980 Paterna, Valencia, Spain
cGANIL, CEA/DRF-CNRS/IN2P3, BP 55027, 14076 Caen cedex 5, France dInstitut Laue-Langevin, B.P. 156, F-38042 Grenoble cedex 9, France
eDepartment of Physics, Lund University, SE-22100 Lund, Sweden fIrfu, CEA, Universit´e Paris-Saclay, 91191 Gif-sur-Yvette, France
gIKP, University of Cologne, D-50937 Cologne, Germany
hINFN Sezione di Padova and Dipartimento di Fisica e Astronomia dell’Universita’, I-35131 Padova, Italy iUniversit´e de Strasbourg, CNRS, IPHC, UMR 7178, F-67000 Strasbourg, France
jInstitut de Physique Nucl´eaire de Lyon, Universit´e de Lyon, Universit´e Lyon 1, CNRS-IN2P3, F-69622 Villeurbanne, France kSTFC Daresbury Laboratory, Daresbury, Warrington WA4 4AD, United Kingdom
Abstract
The performance of the Advanced GAmma Tracking Array (AGATA) at GANIL is discussed, on the basis of the analysis of source and in-beam data taken with up to 29 segmented crystals. Data processing is described in detail. The performance of individual detectors are shown. Efficiency of the individual detectors as well as efficiency after γ-ray tracking are discussed. Recent developments of γ-ray tracking are also presented. The experimentally achieved peak-to-total is compared with simulations showing the impact of back-scattered γ rays on the peak-to-total in a γ-ray tracking array. An estimate of the achieved position resolution using the Doppler broadening of in-beam data is also given.
Angular correlations from source measurements are shown together with different methods to take into account the effects of γ-ray tracking on the normalization of the angular correlations.
Keywords: keywords
1. Introduction
In order to perform γ-ray spectroscopy nuclear structure studies in the conditions of extreme neutron/proton asymmetry and/or extreme angular momentum the so-called γ-ray tracking arrays are considered as indispensable tools. Two international 5
collaborations, AGATA (Advanced-GAmma-Tracking-Array) [1] in Europe and GRETA (Gamma-Ray Energy Tracking Ar-ray) in the US [2] are presently building such arrays. Position sensitive High-Purity Germanium (HPGe) detectors will cover close to 4π of solid angle and track the path of the γ rays inside 10
the detector medium giving maximum efficiency an excellent
energy resolution. The technique of γ-ray tracking allows both the high efficiency needed for high-fold coincidences and the excellent position resolution needed for Doppler Correction at in-flight fragmentation facilities such as the NUSTAR experi-15
ment at FAIR or FRIB.
Gamma-ray tracking starts from the digitally recorded wave-forms, from the highly-segmented HPGe detectors, that are treated with Pulse Shape Analysis (PSA) techniques in order to extract the position of the interaction points of the γ ray in 20
the detector, presently with a position resolution of about 5 mm [3, 4]. The interaction points (hits) are grouped into events on
∗Corresponding author: [email protected]
the basis of their timestamp, i.e. the absolute time of the γ-ray interaction. Different γ rays in the same event and their ordered path are reconstructed from the hits via tracking algorithms. A 25
higher efficiency with a high peak-to-total is expected as the solid angle taken by Anti-Compton shields is now occupied by HPGe crystals and the Compton event suppression is performed by the γ-ray tracking algorithm. The use of digital electronics allows a higher count-rate with maintained energy resolution, 30
and rates up to 50kHz per crystals are routinely used during experiments. The continuous distribution of γ-ray interaction points that allows for the excellent Doppler correction seen in γ-ray tracking arrays also opens up and new degree of sensitiv-ity in the determination of nuclear structure observables such as 35
electromagnetic moments (e.g. lifetimes measurements based on Doppler shift and perturbed angular correlations). This pa-per is meant as both a snapshot in time of the capacities of AGATA and as a reference paper to be used when analysing data from AGATA experiments performed at GANIL.
40
The first experimental campaign with the demonstrator AGATA sub-array was at LNL [5] where it was coupled to the PRISMA spectrometer for the study of neutron-rich nuclei pro-duced in fusion-fission and neutron-transfer reactions. This was followed by a campaign at GSI. Here a larger AGATA sub-array 45
was coupled to the FRS separator [6] for the first campaign with radioactive ion beams. Performance of the AGATA sub-array
at GSI has been extensively studied [7], with focus on the e ffi-ciency of the AGATA sub-array as a function of energy and data treatment. Other performance aspects such as the peak-to-total 50
ratio was also investigated. The same set of data has been used to characterise the performance of AGATA using methods used with GRETINA [8] with a determined efficiency that deviates with 4.7σ.
Since 2015, AGATA is installed [9] at GANIL, Caen, France. 55
It is coupled to VAMOS (a variable mode high acceptance spec-trometer) [10, 11]. Three measurement campaigns have been performed with focus mainly on neutron-rich nuclei populated using multi-nucleon transfer reactions or via fusion-fission or induced fission. During 2018 a campaign where AGATA was 60
coupled to the NEDA [12] neutron detector and DIAMANT [13, 14] charged particle detector was performed. A campaign of source measurements was performed during 2016 to, to-gether with in-beam data, quantify the performance of AGATA at the GANIL site as well. Basic performance data such as ef-65
ficiencies are needed to analyze the data taken during the cam-paigns but a careful follow-up of the evaluation of the AGATA performance as the size of the array changes, detectors and elec-tronics age and/or are changed is also of considerable interest. It allows to assure that the performance is in accordance with 70
what is expected. Furthermore, it helps understand where ef-forts to improve are important - this both at fundamental level, e.g. Pulse-shape analyses or γ-ray tracking, and on a more prac-tical level learning how to best maintain the system at a high level of performance. Extensive Monte Carlo simulations of 75
AGATA are performed as well in order to predict the perfor-mance in different experimental configurations and with differ-ent number of AGATA crystals a thorough evaluation of the performance of such a detection system allows for the bench-marking of the Monte Carlo simulations, further helping the 80
analysis of experimental data.
In this paper we will describe the performance of AGATA as of mid 2016, when it was equipped with 29 crystals. In section 2 and section 3 the experimental set up and data acquisition is described. The performance of individual crystals is discussed 85
in section 4. In section 5 the performance of AGATA as an array is discussed, using the Orsay Forward Tracking algorithm. Es-timates of the position resolution achievable in a typical experi-ment are given in section 6. As the angular coverage of AGATA increases the capabilities in terms of measuring angular corre-90
lations increase and this is discussed in section 7. Conclusions are given in section 8.
2. Experimental setup and data taking
The present AGATA array consisted of 10 triple clusters (Agata Triple Cluster, or ATC) [15] and one double cluster 95
(Agata Double Cluster or ADC) arranged as schematically rep-resented in figure 1. Two of the detectors present in the frame where not connected to an electronics channel, giving a total of 30 active detectors. One detector showed varying performance, related to used electronics, and is excluded form efficiency de-100
terminations. Measurements were performed both at what is referred to as “nominal position” i.e. the center of the AGATA
positioned at 23.5 cm from the target position, and at “compact position” with a distance of 13.47 cm between the closest part of the imaginary sphere that touches the front of the AGATA 105
crystals and the target position. Different standard radioactive
Figure 1: AGATA detectors seen from the reaction chamber point of view, la-beled according to their position in the honeycomb. The two crossed over detec-tors are physically present but not connected to an electronic channel. Positions with no labeling are empty.
sources were placed at target position, see Tab. 1. Aluminum surrounding the target position, i.e. reaction chamber and target holder, were the same as in most of the experimental setups of the campaign. These aluminum structures are included in the 110
Geant4 simulations [16, 17] presented in this work.
Source Activity [Bq] t0
152Eu 22296 17/01/2013
60Co 19632 21/08/2002
Table 1: Radioactive sources used for the measurement
For each detector, the data were collected from the 36 seg-ments as well as for two different gains of the central contact (ranges of ≈ 8 and 20 MeV). The segment signals are referred to with a letter A-F and a number 1-6 where the letter gives 115
the sector of the crystal and the number the slice, i.e. the seg-mentation orthogonal to the bore hole for the central contact. The AGATA raw data for each crystal in an event consist of, per each segment and for the central contact, the amplitude ex-tracted from a trapezoidal filter with a, for the source data used 120
in this paper, shaping time of 10µs as well as 100 samples (10 ns time between samples, ≈ 40 pre-trigger and ≈ 60 post-trigger) of the rise-time of the waveform and a time-stamp, used for the event building. The online and offline data processing is done using the same computer codes, and are described in detail in 125
section 3.
The preamplifier outputs were digitized and pre-processed by two different generation of electronics. The ATCA phase 1 electronics was developed at an early stage of the project for the AGATA Demonstrator, described in Ref. [1]. For the 130
GANIL Phase a second generation of electronics was developed referred to as the GGP’s [18]. The two generations of electron-ics use the same algorithms for determining the energy. How-ever, for the determination of the time of a signal, the ATCA phase 1 electronics use a digital constant fraction whereas the 135
GGPs use a low-level leading edge algorithm. These times are used for triggering purposes only, for both electronics digital CFDs are used for proper timing when analysing the data. A time signal is also extracted directly from the digitizer in order to provide a γ-ray trigger for the VME electronics of VAMOS. 140
3. Data processing
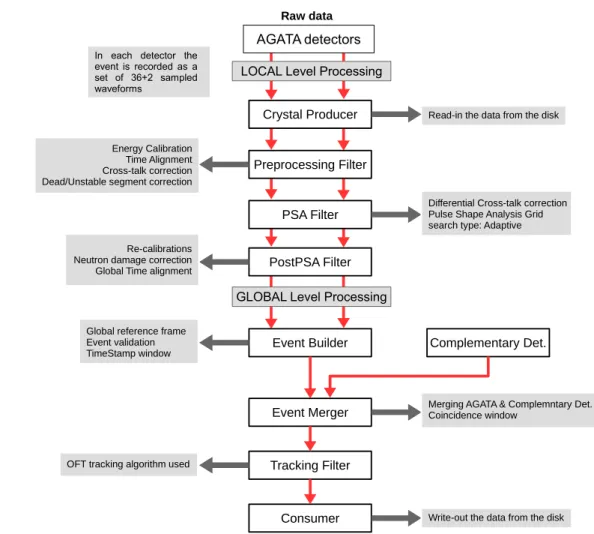
The raw data (event-by-event amplitude, timestamp and traces for segments and central contact) are treated with the chain of Narval actors as depicted in figure 2. Starting at the top we have data coming from the front-end electronics into 145
the computer farm with the first Narval actor, the “Crystal Pro-ducer” that puts the data of the crystal into the Agata Data Flow. In the case of offline analysis the crystal data is read from disk. The next step, done in the “Preprocessing Filter” is to perform energy calibrations, time alignments, cross-talk 150
corrections and the reconstruction of data in single crystal from an eventually missing segment (in case of several missing seg-ments this is no longer possible). Following the preprocess-ing is the pulse-shape analysis where the γ-ray interaction posi-tions are extracted using an adaptive grid search algorithm [19]. 155
Tests allowing to search for more than one interaction per seg-ment of an AGATA crystal have been performed but the search is presently limited to one interaction per segment. From this point on the traces are removed from the data flow. In a typi-cal experiment the result from the PSA is also written to disk 160
at this point as this allows redoing the subsequent steps in the analysis offline without the time consuming PSA. The final step where the data from each crystal is treated individually (Lo-cal Level Processing) is the “Post PSA”, in which, apart from timestamp realignments, several energy correction procedure 165
described later are performed. After this, data from all AGATA crystals are merged in the “Event Builder” on the basis of a co-incidence condition using the individual time stamps of each crystal. This is the start of what is referred to as the Global Level Processing. Complementary detectors are added into the 170
Agata Data Flow in the “Event Merger”. This is done before γ-ray tracking because complementary data from these detec-tor, e.g. data form a beam tracking detector in case of a very large beam spot, can be needed for the tracking of the γ rays. Finally ray tracking is performed. In this work the OFT γ-175
ray tracking algorithm has been used [20]. Finally the data is written to disk by a “Consumer”. This procedure is performed online for monitoring of the experiments (data processing) but also performed as a part of data analysis (data replay) starting from the raw traces or from the interaction points given by the 180
online pulse-shape analysis. This possibility to also store the experimental traces to disk depends on the experimental condi-tions, and is in practice only possible if the number of validated events is lower than about 3 kHz for 15 crystals and a bit less for 30 crystals. Automatic procedures have been developed, both 185
for energy calibration purposes and for the preparation of the configuration files that the actors use allowing error free and fast analyses of experimental data.
4. Crystal Performance
In this section the performance in terms of energy and reso-190
lution for each crystal is discussed, named with their position in the AGATA frame at GANIL. The performance of the in-dividual detectors were determined using measurements with 60Co and152Eu sources, see table 1. A set of standard proce-dures are performed to minimize the FWHM for each crystal. 195
These procedures consist of cross-talk corrections and neutron-damage correction. The energies for events with more than one net-charge segments have to be corrected for cross talk, mainly between the central contact and the segments, as the energy cal-ibration is performed mainly with event with segment multiplic-200
ity 1. Correction coefficients are extracted from source data ei-ther by looking at the shift of the full-energy peak made by the summing of segments in fold two events or by looking at the base-line shift in fold one events. This procedure has been de-scribed in detail by Bruyneel at al. [21]. The correction for the 205
effects of the neutron damage on the detection of the γ rays of interest has been performed following the theoretical approach described by Bruyneel and coauthors [22]. Two calibration co-efficients per detector channels, used to correct for the electron and hole trapping, are determined. This is done using a grid 210
search based minimization of the FWHM and the left tail of the peaks in the spectra for each channel, i.e. 37 per detector. In figure 3 the effect of the correction is shown for one detec-tor. This correction is more important for the segments as they are more sensitive to hole trapping, but it is also done for the 215
central contact, and it is thus important also when the sum en-ergy of hits inside a crystal for an event is forced to the value measured by the central contact. This correction is particularly important for measurements of lifetimes via line-shape analysis techniques, where the symmetry of the detector response func-220
tion is extremely important to minimize systematical errors in the lifetime determination.
4.1. Energy resolution
The energy resolution has been determined for each segment and central contact for the crystals in the array at the moment of 225
taking source data (2016). After the exposition to fast neutrons produced in deep inelastic collisions, fission and fusion evapo-ration reactions in the first campaign at GANIL in 2015, several AGATA crystals were damaged by the charge traps created by neutron radiation damage in the Ge crystal. These traps are 230
lattice defects that lead to a reduction of the charge collection efficiency which appears as a low energy tailing on the energy line shape (red line in figure 3). In position sensitive Ge detec-tors, like the AGATA ones, it is possible to apply an empirical
AGATA detectors Preprocessing Filter PSA Filter Crystal Producer PostPSA Filter Event Builder Event Merger Tracking Filter Consumer Complementary Det. Energy Calibration Time Alignment Cross-talk correction Dead/Unstable segment correction
Read-in the data from the disk LOCAL Level Processing
GLOBAL Level Processing
Write-out the data from the disk Re-calibrations
Neutron damage correction Global Time alignment
Differential Cross-talk correction Pulse Shape Analysis Grid search type: Adaptive
Global reference frame Event validation TimeStamp window
OFT tracking algorithm used
Merging AGATA & Complemntary Det. Coincidence window
In each detector the event is recorded as a set of 36+2 sampled waveforms
Raw data
Figure 2: Chains of Narval actors used for data processing. For details see text.
correction to the neutron damage effects [22]. These correc-235
tions have been applied to the following 20 AGATA crystals in positions (with the corresponding crystal Id in parentheses): 00A(A001), 00B(B004), 00C(C010), 02C(C008), 03B(B002), 03C(C009), 09B(B011), 10A(A003), 10B(B003), 10C(C005), 11B(B013), 11C(C006), 12A(A002), 12B(B010), 12C(C001), 240
13A(A007), 13B(B007), 13C(C007), 14B(B001), 14C(C003). The original spectra and the ones after the corrections, for one detector, are shown in figure 3.
In figure 4 the resolutions for the central contacts and sum of segments for the used detectors are reported. The average 245
FWHM resolution found for the central contacts before the neu-tron damage correction is 2.93 keV and is improved to 2.57 keV after neutron correction. In the case of the sum of segments the average FWHM is improved from 5.22 keV to 3.08 keV, showing the difference in sensitivity to charge trapping. The 250
comparison with the resolutions taken from detector data sheets or factory measurements is reported in figure 5. In general all the measured FWHM resolutions for the crystals agree with the original ones, except for the detector 11C (B013) which apart
from being neutron damaged had a resolution problem during 255
the measurements, in both central contact and segments, due to problems with the electronics.
4.2. Crystal efficiency
The efficiency of each crystal has been determined first from the central contact signal. Although this is not the normal oper-260
ation mode when performing γ-ray spectroscopy with AGATA, the crystal central contact efficiency allows easier diagnostic of the Data Acquisition Chain and easier comparison to Geant4 simulations. For these reasons, it is of great value. The early sub-arrays of AGATA, covering much less than 2π of solid an-265
gle, can be used in nominal or in compact position, i.e. reducing the distance between the target or γ-ray source and the detec-tors by displacing the latter along the beam axis [9]. Two sets of data for efficiency measurement at the nominal and compact
position of AGATA have been taken. All efficiency numbers
270
quoted in this section are corrected for dead time of the data acquisition system. However, for the AGATA DAQ there is a general loss of about 10% of all events generated by the
in-Figure 3: Example of the peak line shapes for the 1332 keV 60Co γ-ray before (red) and after (black) the neutron damage correction for the 36 segments of the crystal A002 position 12A ATC3.
Detectors A B C A B C A B C A B C A B C B C A B C B C A B C A B C B C FWHM at 1.3 MeV (keV) 0 2 4 6 8 10 12 00 02 03 04 05 09 10 11 12 13 14 Core Sum of Seg. Core after NC Sum of Seg. after NC 2.3 keV
Figure 4: FWHM at 1.332 MeV (60Co) of the central contact (blue) and the sum of segments (red) before (dark colours) and after (light colours) the neu-tron damage correction for the 30 capsules individually named with its position labels.
clusion the trigger processor that are used in experiments but corrected for in the numbers given below.
275
The efficiency has been determined both from γ − γ
coin-cidences, corrected for the angular correlation effects for the given geometry, and from singles central contact data taken with60Co and152Eu sources. The coincidence data are not af-fected by dead-time of the processing chain. The singles cen-280
tral contact measurement is. To bypass this effect, the latter
have been recorded in coincidence with the VME/VXI
elec-tronic of the GANIL acquisition system coupled to AGATA via the AGAVA board [1, 9]. The VME/VXI electronics dead time dominates the dead time of the system and can easily be mea-285
sured. The GANIL acquisition system is triggered by the OR of the AGATA digitizers CFDs, triggering the AGAVA board. The individual AGATA channels are then validated by the AGAVA request within a 300 ns time stamp coincidence window. At the
source rate, the VME/VXI GANIL electronic has a dead-time
290
of 40µs per read-out event, greater than the AGATA electronic system, and it can be precisely quantified and used for live time correction in the single central contact efficiency measurement.
Detectors A B C A B C A B C A B C A B C B C A B C B C A B C A B C B C FWHM at 1.3 MeV (keV) 0 1 2 3 4 5 00 02 03 04 05 09 10 11 12 13 14 Core Factory values 2.3 keV
Figure 5: FWHM at 1.332 MeV (60Co) of the central contact (red) after the
neutron damage correction compared with the original FWHM measured by Canberra (blue) for the 30 capsules individually named with its position labels.
For the γ − γ coincidence, the 1332 keV-1173 keV from the 60Co source and 121.8 keV-1408 keV, 121.8 keV-244.7 keV and 295
344.3 keV-778.9 keV coincidence from the152Eu source were
used. For fitting the γ-ray peak areas used to extract the e ffi-ciency values, the Radware software package was used [23]. A background subtraction was made by evaluating the correlated background on both sides of the gating energy for the γ − γ 300
coincidences analysis.
As a result of the measurements, the efficiency relative to a 3 in X 3 in NaI detector (i.e., 1.210−3 cps/Bq at 25 cm) for each detector at nominal position is reported in figure 6. In the same picture, the value at 1.3 MeV as measured at the factory 305
or during the customer acceptance tests is shown. The crystal in position 02C had electronic oscillation problems during the measurements and this is reflected in the lower efficiency as the detector was not functional for periods during the measurement. The average measured value is 79%, close to the factory values 310
average of 81%.
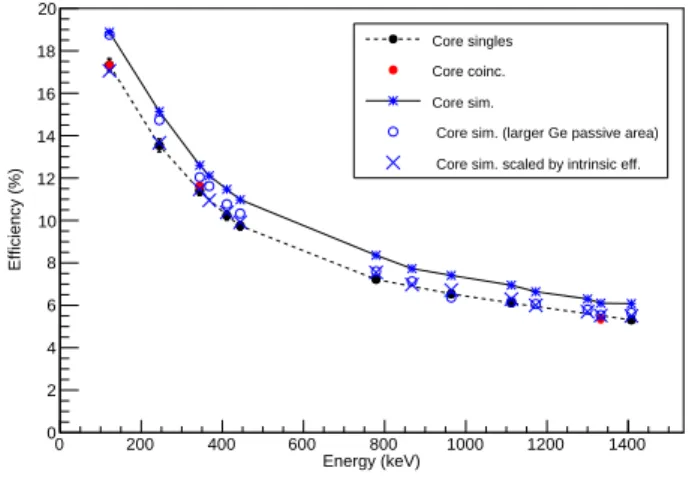
The absolute central contact efficiency for the whole array, composed by 29 operational crystals, is reported in figure 7 for the nominal position of AGATA and figure 8 for the com-pact position of AGATA. Here each crystal is treated as a sin-315
gle detector like in a standard γ-ray detector array. The val-ues obtained by the singles are compared with the γ − γ re-sults and simulations and overlap well. For the nominal geom-etry, the efficiency measured using singles is 2.95(6)% at 1332 keV whereas for the compact geometry it is 5.5(1)% at 1332 320
keV. Geant4 simulations using the AGATA simulation package [17] have been performed with a realistic implementation of the reaction chamber used during the experimental campaign at GANIL [9]. There is 12% discrepancy between the simu-lation and the experimental results. This difference is larger 325
than the 2.5% average discrepancy for the individual crystals, as shown in figure 6, between factory measurements and mea-surements made within the AGATA collaboration. However, Geant4 simulations of the three differently shapes crystals used
by AGATA give a relative efficiency of 86%, 86%, and 87%,
330
for type A,B, and C, respectively. The average measured value is 79%, or 8% lower. This is in reasonable agreement with the 12% of efficiency missing when compared with simulation, as is illustrated in figures 7 and 8 (cross symbols) where the
ef-ficiency of each crystal has been scaled to its measured value. 335
Here the question of how the 12% of effective germanium is
lost has to be raised. The presence of a dead layer or missing germanium will have an impact on the PSA as it is done under assumptions on the active volume and shape of the germanium diode. Simulations assuming a thicker dear layers improve the 340
correspondence with experimental data but it is difficult to pin down the contribution from different surfaces of the detectors, i.e., one can reproduce experimental data with different combi-nation of dead layers around the central contact and at the back of the detector. Moreover, the mismatch of the efficiencies at 345
low energies can not be corrected reducing the active volume around the central contact or at the back of the detector. In fig-ures 7 and 8 simulations with dead layer of 2.5 mm around the central contact and 3 mm at the back are also shown.
Detectors
A B C A B C A B C A B C A B C B C A B C B C A B C A B C B C
Relative efficiency at 1.3 MeV (%) 0 20 40 60 80 100 00 02 03 04 05 09 10 11 12 13 14 Core Factory values
Figure 6: Relative central contact efficiency at 1.3 MeV (60Co) in
compari-son with the initial relative efficiency as provided by manufacturer for the 29 capsules individually named with its position label.
Energy (keV) 0 200 400 600 800 1000 1200 1400 Efficiency (%) 3 4 5 6 7 8 9 10 Core singles Core coinc. Core sim.
Core sim. (larger Ge passive area) Core sim. scaled by intrinsic eff.
Figure 7: Absolute central contact efficiency for the 29 capsules AGATA sub-array in nominal position (23.5 cm distance source to detectors) obtained with the data from152Eu and60Co in singles (black circles) and in coincidences (red
circles) in comparison with the simulations (black stars). The blue crosses cor-responds to simulations where the efficiency has been scaled according to the difference between the simulated absolute efficiency and the measured absolute efficiency. Simulations performed with increased dead layers are also shown (Empty blue circles). See text for details. The rate per crystal at this position was around 200 Hz. Error bars are smaller than used symbols.
Energy (keV) 0 200 400 600 800 1000 1200 1400 Efficiency (%) 0 2 4 6 8 10 12 14 16 18 20 Core singles Core coinc. Core sim.
Core sim. (larger Ge passive area) Core sim. scaled by intrinsic eff.
Figure 8: Absolute central contact efficiency for the 29 capsules AGATA sub-array in compact position (13.47 cm distance source to detectors measured on the beam axis) obtained with the data from152Eu and60Co in singles (black
circles) and in coincidences (red circles) in comparison with the simulations (black stars). The blue crosses corresponds to simulations where the efficiency has been scaled according to the difference between the simulated absolute efficiency and the measured absolute efficiency. Simulations performed with increased dead layers are also shown (Empty blue circles). See text for de-tails.The rate per crystal at this position was between 300 and 500 Hz. Error bars are smaller than used symbols.
5. Performance of the AGATA array with the Orsay For-350
ward Tracking
Description of OFT. The Orsay Forward Tracking (OFT)
al-gorithm [20] was developed with simulated data sets produced with the Geant4 AGATA code [17]. The output of the simu-lations was modified to mock the expected experimental con-355
ditions, such as energy resolution and threshold and position resolution allowing the optimization of the algorithm using re-alistic input. As all forward-tracking algorithms the OFT starts with clustering interaction points. These clusters are evaluated using a χ2-like test where the angle between interaction points 360
as given by the interaction positions given by the PSA are com-pared with the angles as given by the Compton scattering for-mula and energies in each interaction point. The best permu-tation for each cluster is calculated and the clusters are sorted in order of best figure of merit. Clusters that pass a threshold 365
called Ptrack are accepted as good γ rays. The most influential paramter in this is σθcorresponding to the error in angle com-ing from the error in interaction positions from the PSA. Uscom-ing simulations this parameter was optimized to σθ=0.24 cm corre-sponding to the assumed position resolution in the simulations 370
of 5 mm at 100 keV interaction point energy. Interaction points that are further away than 4 cm from the closest other interac-tion point are treated as a photo-electric absorpinterac-tion event. Here the probality for a γ ray to have penetrated this deep and been aboserbed via the photo electric effect is evaluated and com-375
pared to the Psingparameter. The single-interaction-point evalu-ation is an important part of the tracking algorithm since the ef-ficiency loss when it is not included is very large for low-energy events, and non negligible at higher energies: ∼20% of 1.4 MeV total-absorption events in each individual detector are single in-380
teraction points. This last fact is due to the way Pulse Shape Analysis (PSA) identifies interaction points in the AGATA de-tectors. Indeed, up to now, the Grid Search algorithm [19] used online only looks for 1 interaction point per segment. This is at variance with what is currently done at GRETINA [24] where 385
the fits of the segment traces allow for more than one hit per segment. For a detailed explatation on the OFT algorithms see Lopez-Martens et al. [20].
OFT parameters. The definition and typical ranges of the main parameters of OFT are summarised in table 2.
390
Table 2: Table summarising the meaning and standard ranges of the main ad-justable parameters of OFT.
parameter definition typical value
σθ average interaction-point 0.3-3
position resolution (cm)
Psing minimum probability to accept 0.02-0.15
single-interaction-point clusters
Ptrack minimum figure of merit to accept 0.02-0.05 mutliple-interaction-point clusters
Tuning the parameters can affect the spectral quality and
shape. As an example, a high value of σθ corresponds to
nearly fully relaxing the comparison between scattered gies obtained from interaction positions and scattered ener-gies obtained from energy differences. Basically, using a very 395
large σθreduces the cluster evaluation stage to finding the most likely sequence of interaction points in a cluster on the basis of ranges and interaction probabilities only. Increasing σθ in-creases the high-energy efficiency. However, it also dein-creases the low-energy efficiency in the case of medium to high photon-400
multiplicity events since single-interaction points are being ac-cepted as members of multi-interaction point clusters and are therefore lost as potential γ rays absorbed in a single interac-tion. There is an optimal value of σθ, which maximises the gain in efficiency at medium and high energy while minimizing 405
the loss of efficiency at low energy. By analysing source and in-beam data obtained at Legnaro, GSI and GANIL, the opti-mal value of σθis found to be around ∼0.6 and 0.8 cm. This corresponds to an average experimental position resolution a factor of 2 to 3 worse than anticipated. This is consistent with 410
measurements of the position resolution of an interaction point as a function of the deposited energy [4] as well as with the observed clusterisation of interaction points in specific areas of the detector segments.
Another example is given by the energy range of the single-415
interaction spectrum, which grows when the threshold for vali-dation of the corresponding clusters is lowered. For Psing=0.15, the spectrum extends to ∼600 keV, while for Psing=0.02, it goes beyond 2 MeV. Extending the spectrum increases the overall efficiency at high-energy. The price to pay, however is a large 420
background: for Psing=0.02, the single-interaction points are re-sponsible for nearly two thirds of the background present in the spectrum of tracked photon energies. Recent developments in
the OFT code has improved on this points and uses an empiri-cally deduced energy-“distance in germanium” relationship in-425
stead of the single parameter Psing, allowing an improved peak-to-total [25].
The optimal value of Ptrackis found to be around 0.05. Some very slight adjustments can be made as a function of σθbut the general trend is that a smaller value leads to more background 430
and a larger value reduces the peak intensities. 5.1. Tracking Efficiency measurements
The standard set of OFT parameters (σθ=0.8, Ptrack =0.05 and Psing=0.05) were used to extract the tracking efficiency of AGATA at GANIL in a configuration with 29 capsules. The ef-435
ficiencies to track the photons emitted by a152Eu source were obtained by comparing the detected peak areas to the expected intensities given the source activity, the measurement time in-terval and the electronics dead time. Since there are several 2-photon cascades in the radioactive decay of 152Eu, the ef-440
ficiencies at certain photon energies can also be measured by comparing the detected peak area of a transition when a coin-cidence with the transition of interest is required or not. The advantage of this second method is that no knowledge of the source activity or dead time of the system is required. The e ffi-445
ciencies obtained are shown in figure 9.
1 2 3 4 5 6 7 8 9 0 200 400 600 800 1000 1200 1400 1600 Efficiency [%] Energy [keV] Tracked singles Tracked coinc. raw Tracked coinc. corrected Core singles
Figure 9: Tracking efficiency of 29 AGATA detectors as a function of photon energy obtained with the standard OFT parameter set and using either the total singles tracked spectrum or the (121 keV-244 keV), (121 keV - 1408 keV) and (344 keV - 778 keV) γ-γ coincidences. The efficiency for 29 cores scaled from figure 7 is also shown. See text for details.
The efficiency to track a 1.4 MeV photon with 29 capsules is found to be 3.67(1)%. This corresponds to an add back factor with respect to the efficiency of the 29 detectors taken individ-ually of 1.285(4).
450
In figure 9, the raw coincidence efficiencies at 121 and 344 keV lie below the singles tracking efficiency curve. This is be-cause the tracking efficiency varies with the angle between the emitted photons; most notably it vanishes for small angles due
to the deficiencies of the AGATA PSA algorithm and/or due
455
points belonging to the 2 coincident photons arriving to close. This is clearly seen in the plot of the γ-γ angular correlations for the 121.8-244.7 and 344.3-778.9 coincidences in152Sm and 152Gd shown in figure 10. By correcting the coincidence ef-460
ficiencies by the missing fraction of the experimental angu-lar correlations compared to the theoretical curve, the correct tracking efficiency values are recovered.
Angle between tracked photons (degrees)
20 40 60 80 100 120 140 Counts / degree 0 0.5 1 1.5 2 2.5 3 3.5 4 a)
Angle between tracked photons (degrees)
20 40 60 80 100 120 140 Counts / degree 0 0.5 1 1.5 2 2.5 3 3.5 4 b)
Figure 10: a) γ-γ angular correlations obtained for the 121.8 keV - 244.7 keV cascade in152Sm using the OFT parameter σθ=0.8. b) same as a) for the 344.3
keV -778.9 keV cascade in152Gd and in the case of σθ=2.0. The solid lines
represent the best adjustment of the theoretical curves to the data.
Using a larger value of σθ leads to a slightly lower track-ing efficiency below 200 keV but yields 13% more efficiency at 465
1.4 MeV, making the add back factor increase to ∼1.4. It also changes the raw coincidence efficiencies for some coincidence couples. In the case of the 344.3 keV -778.9 keV cascade of figure 10, in particular, correlations are not only absent at small angles, but also at larger angles, when OFT most probably mis-470
interprets all or a subset of the interaction points of the event as points belonging to a back-scatter sequence.
5.2. Tracking Peak-to-Compton ratio
An important performance parameter for a γ-ray spectrome-ter is the peak to total quantifying the fraction of events found in 475
the full energy peak as compared to the total number of detected γ rays. Data was taken with a60Co source with an activity of 8.7 kBq. Gamma-ray tracking was then performed offline for 29 of the 30 AGATA detectors using the 30th as an external trig-ger. In the 30th detector a central contact energy of 1332.5 ± 5 480
keV was demanded. In this manner a γ-ray multiplicity of one can be guaranteed for the remaining 29 detectors. In figure 11 the γ-ray spectrum is shown, together with spectra made with
two different treatments of single interaction validation. The peak-to-total using the empirically fitted maximum distance in 485
germanium for single interactions is 36.4(4)%. It is well known that the peak-to-total in a γ-ray tracking array is dominated by single point interaction accepted as events with a direct absorp-tion of the total γ-ray energy via the photoelectric effect. Ex-cluding such events the peak-to-total is increased to 52.4(6)%, 490
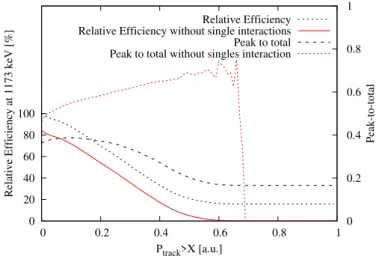
with a reduction in efficiency for the full energy peak of 17%. The variation of peak-to-total and efficiency at 1173 keV as a function of the Ptrackis shown in figure 12, for both the cases when single interactions are included or excluded.
1 10 100 1000 10000 100000 0 200 400 600 800 1000 1200 1400 Counts/4 keV Energy [keV] Present single-point-interaction evaluation
Old single-point-interaction evaluation "95%" critiera
Figure 11: Gamma-ray tracked spectra for 29 AGATA detectors for60Co data
using a 30th AGATA detector as a external trigger by demanding the full ab-sorption of the 1332.5 keV gamma in it. The solid line (black) is using the latest single-point interaction validation procedure, the dashed line (red) is us-ing the old sus-ingle-point interaction validation procedure, and finally the dotted line (blue) using the 95% absorption limit.
0 20 40 60 80 100 0 0.2 0.4 0.6 0.8 1 0 0.2 0.4 0.6 0.8 1
Relative Efficiency at 1173 keV [%]
Peak-to-total
Ptrack>X [a.u.]
Relative Efficiency Relative Efficiency without single interactions Peak to total Peak to total without singles interaction
Figure 12: Efficiency relative to Ptrack = 0 at 1173 keV and peak to total as
a function of Ptrackused by the OFT algorithm to accept or not a γ-ray track.
This for when including or excluding single point interactions.
Monte Carlo simulations using the AGATA simulations 495
track-ing performance with experimental data. In the simulations a
60Co was simulated with a source strength of 5 kBq. An
ab-solute time was used in the simulation allowing effects such as pile-up and random coincidences to be simulated. Gamma-ray 500
interactions in the same segment were packed at their energy-weighted average positions. These were then written into the same data format as used to store experimental post-PSA data. This allowed the use of identical γ-ray tracking and post treat-ment codes for the experitreat-mental and simulated data, i.e. the 505
simulated data was treated exactly as explained for the experi-mental data above. Four different simulations were performed. The first one including only the HPGe crystals and the alu-minum end-caps. The second simulation included a large piece of steel positioned to mimic the large quadrupole magnet of the 510
VAMOS. The third simulation included both the large piece of steel mimicking VAMOS, concrete walls and the target cham-ber. A fourth simulation was also performed adding to the third simulations thicker dead layers to the HPGe crystals. The added dead layers were 3 mm at the coaxial end of the detector and 515
2.5 mm around the central contact. The peak-to-total for the different simulations, when gating on the 1332.5 keV transition to look at the 1173 keV transition were 49%, 48%, 43%, and 41%, respectively. This is to be compared to the experimen-tal value of 36%. In figure 13 the Compton scattering part of 520
the 1332.5 keV gated 60Co spectra are shown for
experimen-tal and simulated data. In the experimenexperimen-tal spectrum a pro-nounced back-scattering peak can be seen just above 200 keV. The simulation labeled 1, only including AGATA itself, does not show such a back-scattering peak. And consequently the 525
peak-to-total is much better than for the experimental data. For simulation 2, where the VAMOS quadrupole has been included in a very schematic way a clear back-scattering peak emerges. However, at both lower and higher energies as compared to the back-scattering peak the experimental data contains more 530
counts. In simulation 3, where the concrete walls are included together with the scattering chamber a shape of the spectrum very close to the experimental one is produced. This suggests that a significant fraction of the spectrum is not due to Comp-ton scattering inside the HPGe crystals of AGATA but from the 535
scattering on the structures around AGATA into AGATA. In-cluding thicker dead layers in the HPGe crystals in the sim-ulation, as done for the fourth simsim-ulation, increases slightly the amount of background between the full-energy peak and the Compton but does not change the shape of the spectrum in 540
a significant way. However, the peak-to-total is decreased by about 5%. These “back scattered” γ rays are very difficult to properly discriminate against as they from the point of view of γ-ray tracking are perfectly good single interaction point events in the front of the crystals.
545
5.3. In-beam efficiency of AGATA coupled to VAMOS
It is of considerable interest to measure the in-beam e ffi-ciency of AGATA as well, as the efficiency is also a function of count rate in the individual detectors due to pile-up (rejected and non rejected) and rate limitations in the electronics. The 550
lack of detail in this section is voluntary as the actual in-beam efficiency is very experiment dependent and hence not of great
10 100 0 200 400 600 800 1000 Counts/8 keV Energy [keV] Experimental P/T 36 % Sim. 1 P/T 49 % Sim. 2 P/T 48 % Sim. 3 P/T 43 % Sim. 4 P/T 41 %
Figure 13: Comparisons between experimental spectrum (in black) and spectra from four different simulations. The spectra are normalized to the same num-ber of counts in the region 0-1165 keV. Simulation 1 includes only AGATA, simulation 2 also includes a schematic implementation of the VAMOS dipole magnet, simulation 3 further adds concrete walls around the experimental setup. Finally, simulation 4 has thicker dead layers added to the HPGe crystals. For further details on the simulations, see the text.
general interest. The aim of the section is to give a useful rule of thumb to allow consistency checks when analysing data. The in-beam efficiency for events with a higher γ-ray fold than one 555
also depends on the angular distribution of and correlation of the γ-ray transitions used to measure it. This both via pure ge-ometrical effects and via the lowered γ-ray tracking efficiency for γ rays with a preference for being emitted in parallel. The
in-beam efficiency has been estimated for AGATA coupled to
560
VAMOS for an experiment where a92Mo beam impinged on
a92Mo target, and the beam-like reaction products were un-ambiguously identified in VAMOS, also providing the veloc-ity vector for Doppler correction. During this experiment 23 AGATA crystals were operational in the array, each counting at 565
around 45 kHz with a shaping time of 2.5 µs. As the target and the beam both were92Mo, de-excitation of target like and beam like particles could be studied. The beam-like and target-like nuclei travel with a relative angle of about 90◦, allowing an es-timate of the effect of the angular distribution on the measured 570
efficiency.
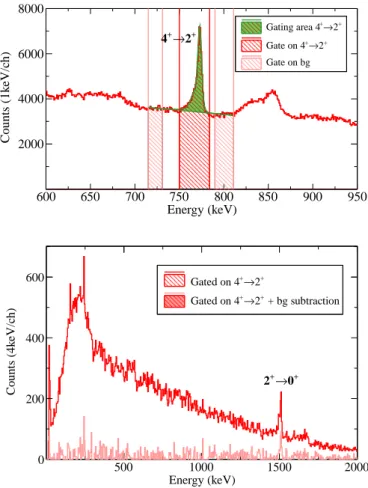
The coincidence method was used to determine the efficiency at 1510 keV, i.e., the number of detected 2+1 → 0+1 γ rays per detected γ ray from the 4+1 → 2+1 was determined. Peak inten-sities were extracted from singles spectra and from γγ coinci-575
dence matrices. The singles spectrum and the projected gate in the γγ coincidence matrix are shown in figure 14. The e ffi-ciency at 1510 keV extracted using this method is after γ-ray tracking 1.5(1)%, to be compared with the expected efficiency of about 2.5% for 23 AGATA crystals at an energy of 1.5 MeV. 580
This loss of efficiency, some 40% lower, has several origins. At count rates of about 45 kHz and a shaping time of 2.5 µs there is a loss in the order of 20% points from pile up in the AGATA detectors[26]. There is also the loss in tracking e ffi-ciency for higher fold events. This can be estimated using the 585
Energy (keV) 600 650 700 750 800 850 900 950 C o u n ts ( 1 k eV /c h ) 2000 4000 6000 8000 + 2 → + 4 + 2 → + Gating area 4 + 2 → + Gate on 4 Gate on bg EDCproj Entries 100009 Mean 663.6 RMS 472.5 Energy (keV) 500 1000 1500 2000 C o u n ts ( 4 k eV /c h ) 0 200 400 600 Gated on 4+→2+ + bg subtraction + 2 → + Gated on 4 + 0 → + 2
Figure 14: Top panel, singles γ-ray spectrum showing the gate set on the 773 keV 4+1 → 2+1 transition in92Mo. Bottom panel, γ-ray spectra showing the 1510 keV 2+1 → 0+1transition used to estimate the in beam efficiency.
smallest used cluster angle in the OFT of 8◦ (as can be seen in figure 10 the efficiency to track two γ rays inside this cone is close to zero) which corresponds to approximately 6% of the solid angle of 23 AGATA detectors. These contributions add up to about 25% points of losses that are rate dependant, via the 590
pile up, and related to the detector physics (i.e. the rise time of the HPGe crystals and average cluster size for typical γ rays) and therefore always will be present. There is an open question from where the remaining about 15% points of efficiency loss is coming. Measurements suggests that maybe 5% points could 595
come from overload beyond specification of the trigger distri-bution system related to the high total rate (more than 1MHz). 6. Position resolution of the PSA
3.5 4 4.5 5 5.5 6 6.5 7 7.5 8 8.5 0.4 0.6 0.8 1 1.2 1.4 1.6 1.8 2 3.5 5 6.5 FWHM for 1223 keV 2 + →1 0 + 1 98 Zr [keV]
Sim. ∆ri [mm]/(1.9+4.4*sqrt(100 keV/EInt) [mm]) ∆ri [mm]
Fit Sim Det 39 Fit Sim Det 41 Exp Det 39 Exp Det 41
Figure 15: Estimated position resolution for two detectors in the AGATA ar-ray. The lines are fits to the FWHM of simulated data sets for the two different detectors where the assumed position resolution has been varied. Large sym-bols show the measured FWHM for each detector (y-axis) and corresponding deduced position resolution (x-axis). For details on simulation and experiment, see text. Note that the lower x-axis is a scaling factor of the position resolution given in S¨oderstr¨om et. al. [4] for the FWHM in one dimension. The upper x-axis shows the average resolution for the interaction point used for Doppler Correction.
The VAMOS allows for a very precise determination of the recoil vector of the identified ion. The direction can in this context be considered as exact whereas the velocity has an error in the order of a few per mill. Given that the recoil velocity has a very small error the position resolution can be estimated by the Doppler Broadening of the γ-ray peaks via the Doppler Shift given by
Eγ = Eγ0 p
(1 − β2)
(1 − βcosθ) (1)
where Eγis the energy detected in the detector, Eγ0is the energy of the γ ray in the rest frame of the nucleus, β is the velocity of the nucleus emitting the γ ray and θ is the angle between the velocity of the emitting nucleus and the γ ray in the laboratory frame. From this we have a γ-ray peak width∆Eγ0of
(∆Eγ0)2= ∂Eγ0 ∂Eγ∆Eγ !2 + ∂E∂β ∆γ0 β !2 + ∂E∂θ ∆γ0 θ !2 . (2)
This can be used to evaluate the performance of the PSA via the relation
cos θ= ~v · ~r
|~v||~r| (3)
where ~v is the recoil velocity as detected by VAMOS and ~r is the position vector of the first ray interaction as given by γ-600
ray tracking. The method employed to determine the position resolution for six different AGATA crystals is to do Geant4 sim-ulations that in a realistic way take into account all experimen-tal contributions to the FWHM of the γ-ray peaks while varying the assumed position resolution of the PSA. The experimental 605
FWHM of the γ-ray peak can then be used to interpolate the actual position resolution of the PSA.
In this case the experiment was a fusion-fission experiment populating, among other nuclei,98Zr. A beam of238U impinged on a 10 µm think9Be foil. The VAMOS was positioned at 28◦ 610
relative to the beam axis. Six AGATA detectors close to 112◦ relative to the recoil direction were used to sample the position resolution of the detectors in the array, as they had the largest Doppler Broadening, increasing the sensitivity to the position resolution. As all data was analyzed after γ-ray tracking it 615
was the interaction used for Doppler Correction that determined which detector was studied. The FWHM of the γ-ray peaks
were determined using Gaussian fits. An error∆β/β = 0.0045
as deduced from the mass resolution of VAMOS gives a con-stant contribution to the FWHM of the γ-ray peak of 0.13%. 620
The simulation took into account the energy loss in the tar-get and straggling as the product left the tartar-get as well as the acceptance of VAMOS. In the simulations a perfect knowledge of the recoil velocity was assumed (∆~v = 0). An intrinsic res-olution of the AGATA detectors of 2.6 keV at 1332 keV was 625
assumed for all detectors. Peak widths as a function of po-sition resolution were determined for seven different popo-sition resolutions. As a baseline the experimentally determined po-sition resolution from S¨oderstr¨om et al. [4] was used. The resolution as a function of energy determined by S¨oderstr¨om 630
et al. [4] was scaled from 0.36 to 1.41. This as the interac-tion point used for Doppler Correcinterac-tion can have any energy so there is no unambiguous position resolution extracted from a Doppler Broadened peak. However, from simulations it was calculated that the average position resolution for the interac-635
tion point used for the Doppler Correction was 4.3 mm FWHM when using the non-scaled function of S¨oerstr¨o et al. [4]. For each assumed position resolution the FWHM of the simulated γ-ray peak for each detector was determined by a Gaussian fit. The extra width coming from the error in recoil velocity was 640
added quadratically. In figure 15 these values are shown with small symbols for detector 39 and 41 (which has the best and worst experimental position resolution, respectively). To each set of FWHM coming from the variation of position resolution a second degree polynomial function was fitted. Using the in-645
verse of these function the position resolution of the individual detectors can be determined (see large symbols in figure 15). Note that in figure 15 the x-axis is a scaling factor with the pre-viously determined position resolution as base, i.e. 1 means the detector has a PSA performance au pair with what was previ-650
ously measured. The six detectors used to sample the position
resolution are located in the span 0.79-1.4, with five detectors larger than 1.08 with an weighted average of 1.15.
7. Angular Correlations in AGATA
The use of AGATA for angular correlations measurements 655
to determine the multipolarity of γ decay has been investigated using source data. Two pairs of γ-γ cascades from the decay of152Eu were used: The first pair was the 1408 keV-121.8 keV coincidence in152Sm de-exciting the 2
-1level at 1530 keV to to the ground state via the 2+1 level at 121.8 keV. The second pair is 660
the 244.7 keV-121.8 keV de-exciting the 4+1 level at 366.5 keV and the 2+1 level, also in152Sm.
The tracking algorithm identifies the first interaction point of each γ ray and as the position of the source is known the an-gle between the γ rays in the 1408 keV-121.8 keV pair and 665
the 244.7 keV-121.8 keV pair could be determined and his-togramed, see lower panel in figure 16. The main features of the two pairs of γ rays are similar. The cut at about 8 degrees is a result of the tracking algorithm, whereas for larger angles the geometry of AGATA as used for the source measurement 670
dominates the shape of the spectra. The slower rise in intensity for the 244.7-121.8 keV cascade at low angles comes from the intrinsic difficulty to track two low-energy γ rays emitted into a small solid angle. The angular correlation is then extracted by normalizing for geometrical effects and the already mentioned 675
decrease in efficiency for two low-energy γ rays absorbed close to each other. The normalization was created by tracking events consisting of the interaction points of two events each with a to-tal energy corresponding to one of the γ-ray’s in the cascade of interest concatenated into one event, thus generating pairs of γ 680
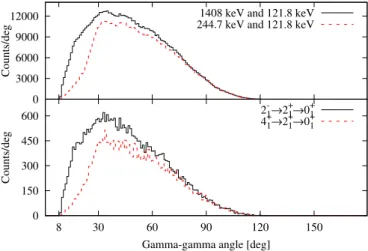
rays with the correct energies but with no angular correlation. From the tracked events the angle between the γ rays was then again extracted. The resulting histograms for the two pairs of γ rays are shown in the upper panel of figure 16.
0 150 300 450 600 8 30 60 90 120 150 Counts/deg
Gamma-gamma angle [deg] 2-1→2+1→0+1 4+1→2+1→0+1 0 3000 6000 9000 12000 Counts/deg
1408 keV and 121.8 keV 244.7 keV and 121.8 keV
Figure 16: Histograms used for angular correlation measurements using AGATA. The lower panel shows the angle between the two correlated γ rays detected in AGATA. The upper panel shows the angle between γ rays from uncorrelated events concatenated before tracking.
By dividing the histograms in the lower panel in figure 16 by 685
the upper panel the histograms shown in figure 17 are created. The upper panel is for the 4+1 →2+1 →0+1 cascade, the lower panel for the 2
-1 →2+1 →0+1 cascade. For each angular correla-tion two theoretical correlacorrela-tions have been fitted by a normal-ization coefficient, i.e. with mixing ratios kept to zero. Given in 690
the legends are the resulting reduced χ2for the fits using either a L2-L2 or L1-L2 cascade. 0.03 0.035 0.04 0.045 0.05 0 8 30 60 90 120 150 W( θ )
Gamma-gamma angle [deg] 2-1→2+1→0+1 Fit 4→2→0 χ2/NDF=1.3 Fit 2→2→0 χ2/NDF=0.84 0.03 0.035 0.04 0.045 0.05 W( θ ) 4+1→2+1→0+1 Fit 4→2→0 χ2/NDF=1.3 Fit 2→2→0 χ2/NDF=1.7
Figure 17: Gamma-gamma angular correlations measured with AGATA. The upper panel shows the angular correlation for the 4+1 →2+1 →0+1pair of transi-tions. The lower panel is for the 2
-1→2+1 →0+1transitions
The particularity of a γ-tracking array as compared to a clas-sical multi-detector γ-ray spectrometer can be shown looking at the difference between using uncorrelated hits that are concate-695
nated and tracked or tracked uncorrelated γ rays concatenated into events when constructing the normalization used to extract the angular correlations from the experimental correlations. In the top panel of figure 18 the histogram drawn with a black solid line shows the distribution of theta angles between uncorrelated 700
γ rays concatenated after tracking. The histogram drawn with red dashed line shows the theta angle distribution if one instead concatenates uncorrelated events using the individual hits and then preforms the tracking. The bottom panel shows the re-sulting angular correlations using the two different methods of 705
generating the normalisation.
8. Conclusions and perspective
The performance of AGATA installed at GANIL, coupled to the VAMOS has been characterized. The efficiency of AGATA, as a whole as well as for individual crystals, has been deter-710
mined using both singles measurements and coincidence meth-ods. It has been done both using AGATA as a standard array and as a γ-ray tracking array. A total efficiency for AGATA of 3.8(1)% at 1332 keV for the nominal geometry when using γ-ray tracking. This is to be compared to 2.9% at 1332 keV if 715
AGATA is used as normal multi-detector array. It is also shown how the efficiency extracted from coincidence has to be cor-rected for angular correlation effects, as the increased
0 0.02 0.04 0.06 0.08 8 30 60 90 120 150 W( θ)
Gamma-gamma angle [deg] Normalized with events mixed after tracking Normalized with events mixed before tracking 0 3000 6000 9000 12000 Counts/deg
244.7 keV and 121.8 keV mixed after tracking 244.7 keV and 121.8 keV mixed before tracking
Figure 18: Normalization histograms and angular correlations for 4+1 →2+1 →0+1 using the ”concatenate before tracking” and ”concatenate after tracking” methods.
ity to emit parallel γ rays combined with the clustering stage of γ-ray tracking generates a loss of efficiency that depends on the 720
angle between the two γ rays. This correction has to be made on top of the typical correction made for angular correlations effects.
As the AGATA detectors have been used in different
cam-paigns the segments of some of the detectors are showing clear 725
signs of neutron damages. Annealing procedures are compli-cated for these detectors and ingenious neutron damage correc-tion procedures have been developed allowing an almost full recovery of the intrinsic energy resolution. The average cen-tral contact energy resolution for AGATA (beginning of 2016) 730
is 2.57 keV at 1332 keV and for the segments 3.08 keV at 1332 keV. Corresponding values before applying neutron dam-age correction are 3.08 keV and 5.22 keV for central contacts and segments, respectively. The neutron correction procedure is effective but at some point the detectors will need to be an-735
nealed. Such maintenance questions are clearly as important for the future of AGATA as the more appealing technical devel-opments that can be made.
The position resolution given by the PSA for AGATA at GANIL has been estimated using data from an experiment per-740
formed in the first half of the campaign. A sample of six of the AGATA crystals had there position resolution estimated. This was done by comparing experimental data with Monte Carlo simulation in which the position resolution was varied. It turns out that the average position resolution found was a factor of 745
1.16(5) larger than what was measured in a dedicated experi-ment [4].
As the number of crystals in AGATA increases the interest in using AGATA for angular correlations and distributions in-creases. Using a152Eu source angular correlations have been 750
produced and methods to properly normalize for the combined effect of geometry and γ-ray tracking have been devised.
Finally, the AGATA detector system is performing very well, as proven by the physics results that have been produced.
De-spite this, improvements in the PSA and further tuning of γ-ray 755
tracking algorithms would be beneficial. The needed develop-ment is related to better understanding of the details of the sig-nal generation in the segmented detectors. This would in turn allow better handling multiple interactions in one segment and removing the nonphysical clustering of interaction points. Such 760
improvements should allow for an increased peak-to-total.
9. Acknowledgments
The authors would like to thank the AGATA collaboration
and the GANIL technical staff. Gilbert Duchˆene is thanked
for providing the in-beam data set used to extract the position 765
resolution of the pulse-shape analysis. Partially supported by the Ministry of Science, Spain, under the Grants BES-2012-061407, SEV-2014-0398, FPA2017-84756-C4 and by the EU FEDER funds.
[1] S. Akkoyun, A. Algora, B. Alikhani, F. Ameil, G. de Angelis, L. Arnold,
770
A. Astier, A. Atac¸, Y. Aubert, C. Aufranc, A. Austin, S. Aydin, F. Azaiez, S. Badoer, D. Balabanski, D. Barrientos, G. Baulieu, R. Baumann, D. Bazzacco, F. Beck, T. Beck, P. Bednarczyk, M. Bellato, M. Bent-ley, G. Benzoni, R. Berthier, L. Berti, R. Beunard, G. L. Bianco, B. Birkenbach, P. Bizzeti, A. Bizzeti-Sona, F. L. Blanc, J. Blasco,
775
N. Blasi, D. Bloor, C. Boiano, M. Borsato, D. Bortolato, A. Boston, H. Boston, P. Bourgault, P. Boutachkov, A. Bouty, A. Bracco, S. Bram-billa, I. Brawn, A. Brondi, S. Broussard, B. Bruyneel, D. Bucurescu, I. Burrows, A. B Agata-advanced {GAmma} tracking array, Nuclear Instruments and Methods in Physics Research Section A: Accelerators,
780
Spectrometers, Detectors and Associated Equipment 668 (2012) 26 – 58. doi:http://dx.doi.org/10.1016/j.nima.2011.11.081. URL http://www.sciencedirect.com/science/article/pii/ S0168900211021516
[2] I. Y. Lee, M. A. Deleplanque, K. Vetter, Developments in large
gamma-785
ray detector arrays, Reports on Progress in Physics 66 (7) (2003) 1095. URL http://stacks.iop.org/0034-4885/66/i=7/a=201 [3] F. Recchia, D. Bazzacco, E. Farnea, R. Venturelli, S. Aydin, G.
Suli-man, C. Ur, Performance of an agata prototype detector estimated by compton-imaging techniques, Nuclear Instruments and Methods
790
in Physics Research Section A: Accelerators, Spectrometers, De-tectors and Associated Equipment 604 (1) (2009) 60 – 63, pSD8. doi:https://doi.org/10.1016/j.nima.2009.01.079.
URL http://www.sciencedirect.com/science/article/pii/ S0168900209001168
795
[4] P.-A. S¨oderstr¨om, F. Recchia, J. Nyberg, A. Al-Adili, A. Atac¸, S. Aydin, D. Bazzacco, P. Bednarczyk, B. Birkenbach, D. Bortolato, A. Boston, H. Boston, B. Bruyneel, D. Bucurescu, E. Calore, S. Colosimo, F. Crespi, N. Dosme, J. Eberth, E. Farnea, F. Filmer, A. Gadea, A. Gottardo, X. Grave, J. Grebosz, R. Griffiths, M. Gulmini, T. Habermann, H. Hess,
800
G. Jaworski, P. Jones, P. Joshi, D. Judson, R. Kempley, A. Khaplanov, E. Legay, D. Lersch, J. Ljungvall, A. Lopez-Martens, W. Meczyn-ski, D. Mengoni, C. Michelagnoli, P. Molini, D. Napoli, R. Orlandi, G. Pascovici, A. Pullia, P. Reiter, E. Sahin, J. Smith, J. Strachan, D. Tonev, C. Unsworth, C. Ur, J. Valiente-Dob´on, C. Veyssiere,
805
A. Wiens, Interaction position resolution simulations and in-beam measurements of the {AGATA} {HPGe} detectors, Nuclear Instruments and Methods in Physics Research Section A: Accelerators, Spectrom-eters, Detectors and Associated Equipment 638 (1) (2011) 96 – 109. doi:http://dx.doi.org/10.1016/j.nima.2011.02.089.
810
URL http://www.sciencedirect.com/science/article/pii/ S016890021100489X
[5] A. Gadea, E. Farnea, J. Valiente-Dobn, B. Million, D. Mengoni, D. Baz-zacco, F. Recchia, A. Dewald, T. Pissulla, W. Rother, G. de Angelis, A. Austin, S. Aydin, S. Badoer, M. Bellato, G. Benzoni, L. Berti, R.
Be-815
unard, B. Birkenbach, E. Bissiato, N. Blasi, C. Boiano, D. Bortolato, A. Bracco, S. Brambilla, B. Bruyneel, E. Calore, F. Camera, A. Capsoni, J. Chavas, P. Cocconi, S. Coelli, A. Colombo, D. Conventi, L. Costa,
L. Corradi, A. Corsi, A. Cortesi, F. Crespi, N. Dosme, J. Eberth, S. Fan-tinel, C. Fanin, E. Fioretto, C. Fransen, A. Giaz, A. Gottardo, X. Grave,
820
J. Grebosz, R. Griffiths, E. Grodner, M. Gulmini, T. Habermann, C. He, H. Hess, R. Isocrate, J. Jolie, P. Jones, A. Latina, E. Legay, S. Lenzi, S. Leoni, F. Lelli, D. Lersch, S. Lunardi, G. Maron, R. Menegazzo, C. Michelagnoli, P. Molini, G. Montagnoli, D. Montanari, O. Mller, D. Napoli, M. Nicoletto, R. Nicolini, M. Ozille, G. Pascovici, R. Peghin,
825
M. Pignanelli, V. Pucknell, A. Pullia, L. Ramina, G. Rampazzo, M. Rebeschini, P. Reiter, S. Riboldi, M. Rigato, C. R. Alvarez, D. Rosso, G. Salvato, J. Strachan, E. Sahin, F. Scarlassara, J. Simpson, A. Stefanini, O. Stezowski, F. Tomasi, N. Toniolo, A. Triossi, M. Turcato, C. Ur, V. Vandone, R. Venturelli, F. Veronese, C. Veyssiere, E. Viscione,
830
O. Wieland, A. Wiens, F. Zocca, A. Zucchiatti, Conceptual design and infrastructure for the installation of the first agata sub-array at lnl, Nuclear Instruments and Methods in Physics Research Section A: Accelerators, Spectrometers, Detectors and Associated Equipment 654 (1) (2011) 88 – 96. doi:https://doi.org/10.1016/j.nima.2011.06.004.
835
URL http://www.sciencedirect.com/science/article/pii/ S0168900211011132
[6] C. Domingo-Pardo, D. Bazzacco, P. Doornenbal, E. Farnea, A. Gadea, J. Gerl, H. Wollersheim, Conceptual design and performance study for the first implementation of agata at the in-flight rib facility of gsi, Nuclear
840
Instruments and Methods in Physics Research Section A: Accelerators, Spectrometers, Detectors and Associated Equipment 694 (2012) 297 – 312. doi:https://doi.org/10.1016/j.nima.2012.08.039. URL http://www.sciencedirect.com/science/article/pii/ S0168900212009102
845
[7] N. Lalovi´c, C. Louchart, C. Michelagnoli, R. Perez-Vidal, D. Ralet, J. Gerl, D. Rudolph, T. Arici, D. Bazzacco, E. Cl´ement, A. Gadea, I. Kojouharov, A. Korichi, M. Labiche, J. Ljungvall, A. Lopez-Martens, J. Nyberg, N. Pietralla, S. Pietri, O. Stezowski, Performance of the {AGATA} γ-ray spectrometer in the prespec set-up at {GSI}, Nuclear
850
Instruments and Methods in Physics Research Section A: Accelerators, Spectrometers, Detectors and Associated Equipment 806 (2016) 258 – 266. doi:http://dx.doi.org/10.1016/j.nima.2015.10.032. URL http://www.sciencedirect.com/science/article/pii/ S0168900215012395
855
[8] A. Korichi, T. Lauritsen, A. Wilson, J. Dudouet, E. Cl´ement, N. Lalovi´c, R. Perez-Vidal, S. Pietri, D. Ralet, O. St´ezowski, Performance of a gamma-ray tracking array: Characterizing the agata array using a 60co source, Nuclear Instruments and Meth-ods in Physics Research Section A: Accelerators,
Spectrome-860
ters, Detectors and Associated Equipment 872 (2017) 80 – 86. doi:https://doi.org/10.1016/j.nima.2017.08.020.
URL http://www.sciencedirect.com/science/article/pii/ S0168900217308781
[9] E. Cl´ement, C. Michelagnoli, G. de France, H. Li, A. Lemasson, C. B.
865
Dejean, M. Beuzard, P. Bougault, J. Cacitti, J.-L. Foucher, G. Fremont, P. Gangnant, J. Goupil, C. Houarner, M. Jean, A. Lefevre, L. Legeard, F. Legruel, C. Maugeais, L. M´enager, N. M´enard, H. Munoz, M. Ozille, B. Raine, J. Ropert, F. Saillant, C. Spitaels, M. Tripon, P. Vallerand, G. Voltolini, W. Korten, M.-D. Salsac, C. Theisen, M. Zieli´nska,
870
T. Joannem, M. Karolak, M. Kebbiri, A. Lotode, R. Touzery, C. Walter, A. Korichi, J. Ljungvall, A. Lopez-Martens, D. Ralet, N. Dosme, X. Grave, N. Karkour, X. Lafay, E. Legay, I. Kojouharov, C. Domingo-Pardo, A. Gadea, R. P´erez-Vidal, J. Civera, B. Birkenbach, J. Eberth, H. Hess, L. Lewandowski, P. Reiter, A. Nannini, G. D. Angelis,
875
G. Jaworski, P. John, D. Napoli, J. Valiente-Dob´on, D. Barrientos, D. Bortolato, G. Benzoni, A. Bracco, S. Brambilla, F. Camera, F. Crespi, S. Leoni, B. Million, A. Pullia, O. Wieland, D. Bazzacco, S. Lenzi, S. Lu-nardi, R. Menegazzo, D. Mengoni, F. Recchia, M. Bellato, R. Isocrate, F. E. Canet, F. Didierjean, G. Duchˆene, R. Baumann, M. Brucker,
880
E. Dangelser, M. Filliger, H. Friedmann, G. Gaudiot, J.-N. Grapton, H. Kocher, C. Mathieu, M.-H. Sigward, D. Thomas, S. Veeramootoo, J. Dudouet, O. St´ezowski, C. Aufranc, Y. Aubert, M. Labiche, J. Simp-son, I. Burrows, P. Coleman-Smith, A. Grant, I. Lazarus, P. Morrall, V. Pucknell, A. Boston, D. Judson, N. Lalovi´c, J. Nyberg, J. Collado,
885
V. Gonz´alez, I. Kuti, B. Nyak´o, A. Maj, M. Rudigier, Conceptual design of the agata 1π array at ganil, Nuclear Instruments and Methods in Physics Research Section A: Accelerators, Spectrometers, Detec-tors and Associated Equipment 855 (Supplement C) (2017) 1 – 12.