HAL Id: tel-02067887
https://tel.archives-ouvertes.fr/tel-02067887
Submitted on 14 Mar 2019HAL is a multi-disciplinary open access archive for the deposit and dissemination of sci-entific research documents, whether they are pub-lished or not. The documents may come from teaching and research institutions in France or abroad, or from public or private research centers.
L’archive ouverte pluridisciplinaire HAL, est destinée au dépôt et à la diffusion de documents scientifiques de niveau recherche, publiés ou non, émanant des établissements d’enseignement et de recherche français ou étrangers, des laboratoires publics ou privés.
Djeneba Doumbia
To cite this version:
Djeneba Doumbia. Three essays on inclusive growth. Economics and Finance. Université Panthéon-Sorbonne - Paris I, 2018. English. �NNT : 2018PA01E047�. �tel-02067887�
UFR
DES SCIENCES ECONOMIQUES ANDP
ARIS
S
CHOOL OF
E
CONOMICS
Thèse pour l’obtention du titre de Docteur en Sciences
Economiques
presentée et soutenue publiquement à Paris le 19 Décembre 2018 par
D
JENEBAD
OUMBIAThree Essays on Inclusive Growth
D
IRECTEUR DE THÈSEJean-Bernard CHATELAIN
Professeur, Université Paris I Panthéon-Sorbonne et Paris School of Economics
M
EMBRES DU JURYPrésidente du Jury
Mathilde MAUREL
Directrice de recherche CNRS, Université Paris I Panthéon-Sorbonne
Rapporteurs
Jean-Louis COMBES
Professeur, Université Clermont Auvergne, Ecole d’Economie, CERDI
Philippe De VREYER
I
II
Djeneba Doumbia | Three Essays on Inclusive Growth | 2018
L’Université Paris I Panthéon-Sorbonne n’entend ni approuver, ni désapprouver les opinions
particulières de la candidate : ces opinions doivent être considérées comme propres à leur auteur.
III
IV
Djeneba Doumbia | Three Essays on Inclusive Growth | 2018
This dissertation provides some evidence-based policy lessons focusing on the role of institutional, structural, and fiscal policies in achieving pro-poor and inclusive growth. The first chapter gives an overview of the dissertation and briefly discusses the main data issues and some stylized facts on inequality and poverty. The second chapter examines the role of good governance in fostering pro-poor and inclusive growth at the macroeconomic level. It shows that while all features of good governance enhance pro-poor growth, only government effectiveness and the rule of law tend to promote inclusive growth. The third chapter provides a cross-country analysis investigating how governments can reduce income inequality by changing the composition of public spending while keeping the total level fixed. The results show that reallocating defense spending towards education, and health spending and in particular social and infrastructure spending, is associated with reduced income inequality in countries with political stability. The fourth chapter provides a microeconomic perspective, focusing on how better performance of informal firms could promote shared prosperity in a context of fragility. It shows that firms’ performance is a key factor in explaining income differences between entrepreneurs. In addition, the chapter finds that human capital and managerial skills are important engines of informal firms’ performance.
Keywords: Inclusive growth, Pro-poor growth, Inequality, Poverty, Public spending, Spending composition, Informal sector, Firm performance.
V
Djeneba Doumbia | Three Essays on Inclusive Growth | 2018
Résumé
Cette thèse met en exergue des recommandations sur le rôle des politiques de gouvernance, structurelles et fiscales pour atteindre une croissance pro-pauvre et inclusive. Le premier chapitre qui est introductif, présente le contexte de la thèse et discute brièvement les principaux problèmes de données ainsi que les faits stylisés sur l’inégalité et la pauvreté. Le deuxième chapitre analyse les effets de la bonne gouvernance sur la croissance pro-pauvre et inclusive au niveau macroéconomique. Il montre que tous les indicateurs de la gouvernance impactent positivement la croissance des revenus et la réduction de la pauvreté tandis que seuls deux indicateurs : l’efficacité du gouvernement et la règle de droit favorisent une croissance inclusive. Le troisième chapitre analyse comment les gouvernements peuvent réduire les inégalités de revenu en ajustant la composition des dépenses publiques tout en gardant le niveau total inchangé. Les résultats montrent que réallouer les dépenses de défense vers les dépenses d’éducation et de santé et en particulier les dépenses sociales et d’infrastructure, est associé à une réduction des inégalités dans les pays avec une stabilité politique. Le quatrième chapitre fournit une perspective micro-économique, en étudiant comment une meilleure performance des firmes dans le secteur informel peut promouvoir la prospérité partagée dans un contexte de fragilité. Ce chapitre montre que la performance des firmes est un facteur clé expliquant les différences de revenus entre les entrepreneurs. En outre, les résultats montrent que le capital humain et les compétences managériales sont des déterminants importants de la performance des firmes informelles.
Mots-clés: Croissance inclusive, Croissance pro-pauvre, , Inégalité, Pauvreté, Dépenses publiques, Composition des dépenses, Secteur informel, Performance des firmes.
VI
Djeneba Doumbia | Three Essays on Inclusive Growth | 2018
A mon cher père (Repose en paix),
A ma mère
VII
Djeneba Doumbia | Three Essays on Inclusive Growth | 2018
Remerciements
Je tiens tout d’abord à exprimer ma profonde reconnaissance et mes sincères remerciements à mon directeur de thèse Jean-Bernard Chatelain pour son soutien continu et ses conseils constructifs tout au long de cette thèse. J’adresse mes sincères remerciements aux membres du jury – Jean-Louis Combes, Philippe de Vreyer et Mathilde Maurel pour leur disponibilité et pour leurs précieux commentaires et suggestions.
Je voudrai témoigner de ma reconnaissance à Katheline Schubert pour ses conseils et son soutien quand j’étais en Magistère d’Economie. Je remercie également mes camarades de Paris 1/PSE : Sébastien Bock, Can Askan, Romaric Sondjahin et Yassine Kirat pour leur disponibilité.
I am thankful to my colleagues at the World Bank Group: Franck M Adoho, Mathieu Biokou, Thi Thanh Thanh Bui, Souleymane Coulibaly, Felipe Dizon, Ivailo Izvorski, Omowunmi Lapido, William Maloney, Seynabou Sakho, Aly Sanoh, and Jan Walliser (Rest in Peace) whose support was highly appreciated. I am also grateful to Graciela Chichilnisky for her guidance during my stay at Columbia University in the city of New York as a visiting PhD candidate.
Je tiens à exprimer ma profonde gratitude et mes chaleureux remerciements à mes très chers parents qui ont toujours été des modèles pour moi. A mon père – Dougoutigui – qui nous a quittés vers la fin de cette thèse et qui m’a donnée, depuis toute petite, le goût des études et qui m’a motivée à exceller et à entreprendre des études en économie, comme lui il l’a fait. Je suis convaincue que de là-haut, tu es fier de ta petite Nènè. Je ne pourrai jamais assez te remercier. A ma chère mère qui a toujours été là dans les moments difficiles ainsi que dans les moments de joie et qui m’a toujours encouragée et soutenue. Mes remerciements vont aussi à Mamou, mes frères et sœurs à Bamako, Sikasso, Cergy et Bretagne, pour leur soutien moral tout au long de ces années de thèse.
Mon parcours universitaire a été marqué par la présence de personnes extraordinaires. La liste est longue. Je vous remercie tous, du fond du cœur. Je remercie Elodie Da Costa et Fatoumata Nanakassé pour leur disponibilité quand besoin il y avait durant ces dernières années. Mes remerciements vont aussi à Fatou Guissé et Rhamat Koné pour leur soutien moral. Durant mon stage à la banque mondiale à Abidjan, j’ai été accueillie par la famille Traoré que je tiens à remercier sincèrement. Alassane (repose en paix), merci pour tout.
Enfin, je tiens à exprimer ma profonde reconnaissance à Tidiane pour son soutien indéfectible et son amour. Merci de m’avoir conseillée, épaulée durant toutes ces années, et d’être toujours
VIII
Djeneba Doumbia | Three Essays on Inclusive Growth | 2018
là pour moi. Et surtout, merci de rendre ma vie plus belle ! I would also like to thank my princess Aneyka (and future siblings) whose gentleness, sweetness, love and support always make me happy.
IX
X
Djeneba Doumbia | Three Essays on Inclusive Growth | 2018
T
ABLE OFC
ONTENTSGeneral Introduction and Overview ... 1
1.1. Context ... 2
1.2. Data issues and Stylized facts ... 3
1.2.1. Inequality ... 3
1.2.2. Poverty ... 19
1.3. Outline and main results ... 21
The Quest for Pro-poor and Inclusive Growth: The Role of Governance ... 24
2.1. Introduction ... 26
2.2. Literature Review ... 27
2.2.1. Growth, Poverty, and Income Distribution ... 27
2.2.2. Governance and Pro-poor Growth ... 28
2.3. Econometric Methodology ... 29
2.4. Data... 30
2.4.1. Measuring Poverty and Inequality ... 30
2.4.2. Defining and Measuring Governance... 31
2.4.3. Main explanatory variables ... 32
2.5. Pro-poor and Inclusive Growth: Empirical Evidence ... 34
2.5.1. Has growth been pro-poor and inclusive? ... 34
2.5.2. Pro-poor and inclusive growth: the role of governance ... 38
2.5.3. Other determinants of pro-poor and inclusive growth ... 41
2.6. Nonlinear and threshold estimations ... 45
2.6.1. Exogenous nonlinear estimation ... 45
2.6.2. Endogenous nonlinear estimation: Panel Smooth Transition Regression ... 47
2.7. Conclusion and discussion ... 54
Appendix A ... 56
Reallocating Public Spending to Reduce Income Inequality: Can it work? ... 62
3.1. Introduction ... 64
3.2. Data... 66
3.2.1. Composition of public spending: A new dataset ... 66
3.2.2. Some Stylized Facts on Public Spending and Income Distribution ... 67
3.3. Econometric Analysis: Composition of Public Spending and Income Inequality ... 70
3.3.1. Estimated Model ... 70
3.3.2. Baseline Results ... 76
3.3.3. The Role of Conflict and Institutions ... 84
3.4. Further Robustness Checks ... 86
3.4.1. Long-Run Impact of Public Spending ... 86
3.4.2. Alternative indicators of inequality ... 87
3.4.3. Accounting for local government spending, the efficiency of public spending, and the use of debt to finance public outlays ... 88
XI
Djeneba Doumbia | Three Essays on Inclusive Growth | 2018
3.5. Conclusion ... 90
Appendix B ... 91
Informal Sector Heterogeneity and Income Inequality: Evidence from the Democratic Republic of Congo ... 111
4.1. Introduction ... 113
4.2. Informal sector heterogeneity and inequality: Literature review ... 114
4.3. Data and descriptive statistics ... 117
4.3.1. 1-2-3 survey ... 117
4.3.2. Characteristics of the informal sector in DRC ... 118
4.4. Identification strategy: Informal firms ... 123
4.4.1. Defining a top performer ... 123
4.4.2. Sample selection bias ... 123
4.4.3. Identification of the constrained gazelles and survivalists ... 126
4.5. Heterogeneity in the informal sector ... 132
4.5.1. Individual entrepreneur characteristics ... 132
4.5.2. Firm typology and the choice of sector ... 134
4.5.3. Structural and behavioral factors ... 135
4.6. Urban poverty and income inequality in the informal sector... 136
4.7. Drivers of the performance of informal firms ... 140
4.7.1. Explaining differences in income using Blinder-Oaxaca decomposition ... 140
4.7.2. Drivers of informal firms’ performance ... 142
4.7.3. Explaining differences in performance using Blinder-Oaxaca decomposition .. 145
4.8. Conclusion and Policy Recommendations ... 148
Appendix C ... 150
General Conclusion ... 166
Résumé général ... 169
XII
Djeneba Doumbia | Three Essays on Inclusive Growth | 2018
L
IST OFT
ABLESTable 1.1. Differences in PPP-adjusted GDP per capita estimates across WDI, PWT, and ICP .. 8
Table 1.2. Largest differences of PPP GDP per capita estimates between ICP and PWT ... 11
Table 1.3. Largest differences of PPP- GDP per capita estimates between WDI and PWT ... 11
Table 1.4. Largest differences of PPP GDP per capita estimates between WDI and ICP ... 12
Table 1.5. Correlations between Statistical capacity indicator and differences in real GDP per head across PWT, WDI and ICP ... 13
Table 1.6. Absolute differences of Nominal GDP estimates in percentage of PWT and ICP for the year 2011 ... 16
Table 1.7. Absolute differences of PPP estimates in percentage of PWT and ICP for the year 2011 ... 16
Table 1.8. Illustrative correlations of World Bank control of corruption with real GDP per head as reported in PWT, ICP and WDI for 2011 ... 17
Table 1.9. World and Regional Poverty Estimates ... 20
Table 2.1. Pro-poor growth regressions- income of the poorest 20 percent ... 35
Table 2.2. Pro-poor growth regressions- poverty headcount ratio at $2 ... 36
Table 2.3. Governance and inclusive growth regressions ... 37
Table 2.4. Governance and pro-poor growth regressions ... 40
Table 2.5. Structural determinants of pro-poor growth ... 43
Table 2.6. Structural determinants of inclusive growth ... 44
Table 2.7. Pro-poor growth and governance: non-linearity ... 46
Table 2.8. Inclusive growth and governance: non-linearity ... 47
Table 2.9. Results of linearity for the PSTR models (i) and (ii) ... 51
Table 2.10. Parameter estimates for the PSTR model (i) ... 51
Table 2.11. Results of linearity for the PSTR models (iii) and (iv) ... 54
Table 3.1. Impact of Total Spending and Spending Components on Income Inequality ... 78
Table 3.2. Impact of Spending Components on Income Inequality – Financed by cut in Defense Spending ... 79
Table 3.3. Impact of Spending Components on Income Inequality – Financed by cut in Education Spending... 80
Table 3.4. Impact of Spending Components on Income Inequality – Financed by cut in Health Spending ... 81
Table 3.5. Impact of Spending Components on Income Inequality – Financed by cut in Social Spending ... 82
Table 3.6. Impact of Spending Components on Income Inequality – Financed by cut in Infrastructure Spending ... 83
Table 4.1. Consumption Distribution across Informal Firms ... 120
Table 4.2. Determinants of Capital Ownership among Firms ... 124
Table 4.3. Step 2: Probability of being a Top Performer ... 126
Table 4.4. Percentage Share of Firms, by Province ... 128
Table 4.5. Percentage Share of Firms, within Province ... 131
XIII
Djeneba Doumbia | Three Essays on Inclusive Growth | 2018
Table 4.7. Quintiles of Per Adult Equivalent Consumption, Informal Firms, % ... 136
Table 4.8. Poverty between Informal Firms, Logit Estimates ... 137
Table 4.9. Blinder-Oaxaca Decomposition of Per Adult Equivalent Income, Top Performers versus Constrained Gazelles ... 141
Table 4.10. Blinder-Oaxaca Decomposition of Per Adult Equivalent Income, Top Performers versus Survivalists ... 141
Table 4.11. Drivers of Performance ... 144
Table 4.12. Blinder-Oaxaca Decomposition of firms’ performance, Top Performers versus Constrained gazelles ... 147
Table 4.13. Blinder-Oaxaca Decomposition of firms’ performance, Top Performers versus Survivalists ... 147
Appendix A
Table A1. Country list ... 56Table A2. Description of variables ... 57
Table A3. Descriptive statistics of main variables ... 58
Table A4. Correlations between explanatory variables and lagged and differenced instruments used in the SYS-GMM estimation. ... 58
Table A5. Governance indicators and pro-poor growth regressions ... 59
Table A6. Shared prosperity and structural variables ... 60
Appendix B
Table B1. Summary Statistics ... 91Table B2. Sample Country List ... 92
Table B3. Pairwise Correlation of Different Measures of Income Distribution ... 92
Table B4. Robustness Check: The role of institutions using median value ... 93
Table B5. Robustness Check: Long-term impact of spending (10-year framework) ... 94
Table B6. Robustness Check: Long-term impact of spending (8-year framework)... 95
Table B7. Robustness Check: Long-term impact of spending (5-year framework)... 96
Table B8. Robustness Check: Change in Net Gini as the dependent variable ... 97
Table B9. Robustness Check: Market Gini ... 98
Table B10. Robustness Check: Gini from LIS ... 99
Table B11. Robustness Check: Top 10 percent income share ... 100
Table B12. Robustness Check: Bottom 10 percent income share ... 101
Table B13. Robustness Check: Ratio of Top to Bottom Decile Income Shares ... 102
Table B14. Robustness Check: Advanced vs. Developing Countries ... 103
Table B15. Robustness Check: Use of General Government Data ... 104
Table B16. Robustness Check: Controlling for the efficiency of capital spending ... 105
Table B17. Robustness Check: Controlling for debt financing of public outlays ... 106
Appendix C
Table C1. Definition of the Variables ... 150Table C2. Descriptive Statistics, Capital Distribution, by Sector and Province ... 153
Table C3. Descriptive Statistics, Capital Distribution, by Owner and Firm Characteristics ... 154
XIV
Djeneba Doumbia | Three Essays on Inclusive Growth | 2018
Table C5. Probability of being Top Performers, Constrained Gazelles, or Survivalists, Logit
Model ... 157
Table C6. Income Inequality: Ordered Logit ... 158
Table C7. Income Inequality, Reclassification (1) ... 159
Table C8. Income Inequality, Reclassification (2) ... 160
Table C9. Income Inequality, Reclassification (3) ... 161
Table C10. Income Inequality, Reclassification (4) ... 162
XV
Djeneba Doumbia | Three Essays on Inclusive Growth | 2018
L
IST OFF
IGURESFigure 1.1. Evolution of Income Inequality and Top Income Share ... 5
Figure 1.2. GDP per capita relative to the US ... 6
Figure 1.3. PPP GDP per capita data comparison between WDI, PWT and ICP ... 10
Figure 1.4. Correlations between statistical capacity indicator and abs(WDI-PWT)/PWT in % . 13 Figure 1.5. Correlations between statistical capacity indicator and abs(ICP-PWT)/PWT in % ... 14
Figure 1.6. Correlations between statistical capacity indicator and abs(WDI-ICP)/PWT in % ... 14
Figure 1.7. Health, Representative countries across regions, by Wealth Quintiles ... 18
Figure 1.8. Education, Representative countries across regions ... 18
Figure 1.9. Financial Services, by Income Share, Representative countries across regions ... 19
Figure 2.1. Growth and the income of the poor ... 35
Figure 2.2. Inclusive growth ... 37
Figure 2.3. Marginal impact of income growth on the income of the poor ... 52
Figure 2.4. Average estimated impact of income growth on the income of the poor ... 52
Figure 3.1.Composition of Spending: Functional classification ... 68
Figure 3.2. Progressive Taxation, Public Spending, and Income Inequality ... 69
Figure 4.1. Poverty Incidence among informal Entrepreneurs by province, 2012 (%) ... 119
Figure 4.2. Top Performers, Constrained Gazelles, and Survivalists by Province, 2012 (%) ... 128
Figure 4.3. Distributions across informal firms ... 131
Figure 4.4. Lorenz Curves by Informal Firms ... 137
Appendix B
Figure B1. The Role of Conflict and Institutions: Change in Defense Spending ... 107Figure B2. Social Protection Financed by cuts in Defense: The Role of Conflict and Institutions ... 108
Figure B3. Infrastructure Financed by cuts in Defense: The Role of Conflict and Institutions . 109
Appendix C
Figure C1. Informal Businesses Started Because of Job Shortages in Large Firms ... 151Figure C2. Size of Informal Firms (%) ... 151
Figure C3. Size of Informal Firms (%), by Gender ... 152
Figure C4. Location of Activities, Informal Firms ... 154
Figure C5. Infrastructure and Business Activity, Location by Gender (%) ... 155
Figure C6. Firm Location, by Quartile of Capital ... 155
Figure C7. Distribution of the Log of Value Added per Hours Worked ... 159
Figure C8. Changes in firms’ performance of constrained gazelles and survivalists if they have the same characteristics as top performers (%) ... 164
XVI
1
Djeneba Doumbia | Three Essays on Inclusive Growth | 2018
Chapter 1 General Introduction and
Overview
2
Djeneba Doumbia | Three Essays on Inclusive Growth | 2018
1.1. Context
The world has witnessed a significant decline in extreme poverty since 1990. Mainly thanks to robust growth, the aggregate extreme poverty rate was reduced by more than two-third – from 35 percent in 1990 to 10.7 percent in 2013. This decline was mainly driven by the remarkable economic transformation in East Asia and Pacific, particularly in China and other emerging markets in East Asia. Extreme poverty rate in the region dropped from 61 percent in the 1990s to less than 4 percent in 2013. Extreme poverty also declined in South Asia, although is to a lower extent. Despite progress in poverty reduction globally, the number of extreme poor remains significant. The World Bank estimated that 768.5 million people lived with less than $ 1.90 a day in 2013. More than a half of the extreme poor live in Sub-Saharan Africa. Overall, growth has been pro-poor worldwide as it has reduced poverty. However, growth has been not inclusive as the poorest do not contribute to and benefit equally from economic growth. In contrast, those at the top of income distribution tend to capture the lion’s share of benefits from economic growth.
The empirical literature suggests many factors that could help reduce poverty and income inequality. These factors include economic growth, institutions, technological progress, human capital, and international trade (Dollar and Kraay, 2002; Dollar, Kleineberg and Kraay, 2013; Kaufmann and Aart, 2002; Resnick and Regina, 2006; Woo et al., 2017). However, there is little evidence on policies that promote inclusive growth.
Alleviating poverty and achieving inclusive growth has been a long-standing objective of governments and development partners alike. These issues have been and remain at the forefront of the development policy debate around the world. This dissertation provides some evidenced-based policy lessons focusing on the role of institutional, structural, and fiscal policies in achieving pro-poor and inclusive growth. It has three main contributions. First, it assesses the nonlinear relationship between good governance, pro-poor and inclusive growth. Second, the literature examined the impacts of public spending on growth, poverty and inequality but did not consider the everlasting financing constraints most governments face. This dissertation provides a cross-country analysis investigating how a government can reduce income inequality by changing the composition of public spending while keeping the total level fixed. Third, this dissertation examines the role of structural policies in promoting shared prosperity in a fragile Sub-Saharan African country – the Democratic Republic of Congo, in a context of pervasive informal sector.
3
Djeneba Doumbia | Three Essays on Inclusive Growth | 2018
The following sections briefly present the main data issues and some stylized facts on inequality and poverty (section 1.2), as well as the outline and main results of this dissertation (section 1.3).
1.2. Data issues and Stylized facts
1.2.1. Inequality
When examining inequality, it is important to answer the question: inequality of what? There are many dimensions of inequality: inequality of outcomes – for instance inequality of individual earnings, family income, wealth, consumer spending, or individual economic well-being; and inequality of opportunities. As most studies, this dissertation focuses on inequality of income or consumption within countries, which remains the level at which most policies operate. Besides “within country” income inequality, it exists inequality between countries and global1inequality which represents a combination of the two former types of inequality.
Measuring inequality is not easy or straightforward (World Bank, 2016). Cross-country comparisons can be challenging, particularly when it comes to study income inequality within countries. First, the main source of inequality measures – household surveys covers either consumption or income expenditure. National statistical offices in industrialized countries and Latin America tend to compile statistics on household income while national statistical offices in South Asia, Sub-Saharan Africa (SSA), and the Middle East collect data on consumption expenditure. The World Bank (2016) underlines the fact that data understate the level of inequality in countries where consumption data are used. Second, data from household surveys are likely to underreport incomes (or consumption) at the top of the distribution. Other measurement challenges of inequality include data availability and survey comparability, significant differences in sampling unit used, as well as the definition of income (net or gross) or the time coverage of expenditure and income data.
The following subsections present some stylized facts on different dimensions of inequality and on poverty around the world.
4
Djeneba Doumbia | Three Essays on Inclusive Growth | 2018
1.2.1.1. Inequality within countries
The Gini coefficient is the most widely used measure of inequality within countries. It is derived from the Lorenz curve, which displays the cumulative share of the population versus the cumulative proportion of income (or expenditure). The Gini coefficient considers the entirety of distribution rather than just the extremes. Besides the World Bank Gini coefficient, it exists a number of Gini coefficients from different sources. First, the Gini index from the Luxembourg Income Study (LIS) is based solely on income surveys and its goal is to reach the highest level of harmonization. In addition, it does not include imputed data. However, the LIS database covers relatively few countries and years, mainly high and middle-income countries. The Gini coefficients after taxes and transfers or post-fiscal (net) and pre-fiscal (market) from the Standardized World Income Inequality Database (SWIID) were assembled by Frederik Solt using the LIS data as baseline. The SWIID Gini coefficients have the advantage to (i) maximize the comparability of data on income inequality and (ii) maintain the largest possible coverage across countries and over time. However, it also generates values using model-based imputation for the missing observations.
While the Gini coefficient is over-sensitive to changes in the middle of the distribution, it is less sensitive to changes at the top and bottom of the income distribution. The World Bank PovCalnet database provides detailed information on income distributions. It reports mean income and income shares by decile and quintile from national household surveys. Data on income shares have the advantage to capture income distribution at the tails.
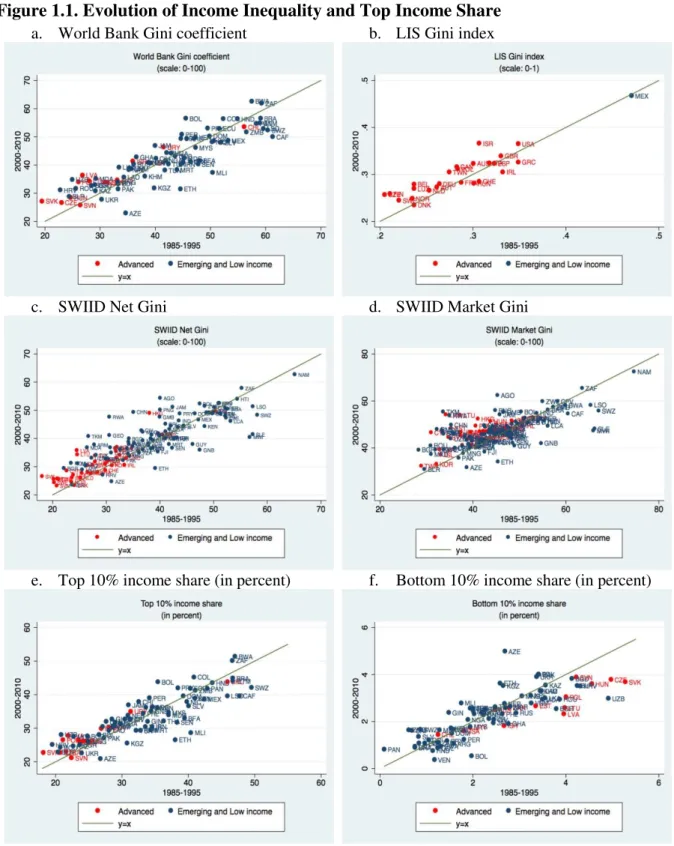
Figure 1.1 shows the evolution of income inequality and top and bottom income shares across the world by income level. Data suggest that since the 1980s income inequality as measured by the World Bank Gini coefficient has increased in most advanced and many emerging and low-income countries (Figure 1.1a). Data on the LIS Gini index cover mainly advanced economies and show the same trend (Figure 1.1b). Disposable income (tax and post-transfer) inequality displays a similar upward trend (Figure 1.1c). However, there is a wider disparity across countries, mostly due to different degrees of progressivity in (income) tax systems and spending policies (Woo et al., 2017, Bastagli et al., 2012 among others). Pre-fiscal income inequality exhibits an upward trend for most advanced economies, but changes in market Gini estimates for many developing countries strikingly differ (Figure 1.1d).
Data suggest that the income share of the top decile in most advanced economies have increased between the period 1985-1995 and 2000-2010, with the exception of Slovenia. In
5
Djeneba Doumbia | Three Essays on Inclusive Growth | 2018
contrast, the bottom 10 percent income share has decreased in most advanced economies (Figure 1.1e and Figure 1.1f). In developing countries, changes in the income share of the top and bottom deciles vary across countries.
Figure 1.1. Evolution of Income Inequality and Top Income Share
a. World Bank Gini coefficient b. LIS Gini index
c. SWIID Net Gini d. SWIID Market Gini
e. Top 10% income share (in percent) f. Bottom 10% income share (in percent)
6
Djeneba Doumbia | Three Essays on Inclusive Growth | 2018
1.2.1.2. Inequality between countries
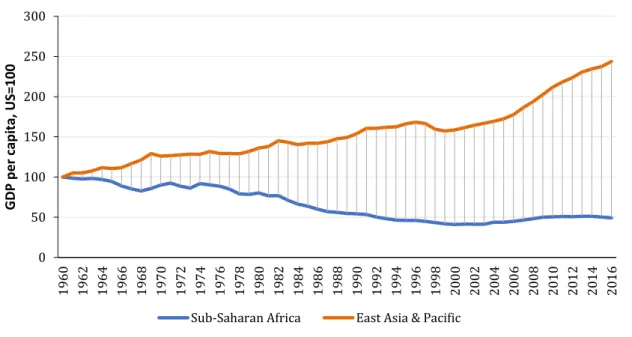
Remarkable economic transformation in parts of the world, especially in East Asia has led to global economic convergence. However, since the 1960s convergence with the United States has been reversed for the Sub-Saharan African region on average, despite substantial progress in some countries, especially this century (Figure 1.2). While Rwanda and Ethiopia have substantially improved their average incomes since 2000, even more than South Asia on average, the income gap with South Asia and East Asia has widened substantially for most Sub-Saharan African countries.
Figure 1.2. GDP per capita relative to the US
(Base 100, 1960, PPP constant 2011 international US dollars)
Source: Calculations using WDI, World Bank.
Assessing between-country inequality rests on properly measuring the wealth of Nations, which can be captured by Gross Domestic Product (GDP). However, GDP is subject to various issues since it is computed by different institutions, including the World Bank and the International Comparison Program (ICP). The ICP compiles detailed expenditure values of GDP for countries around the world. It also estimates purchasing power parities (PPP) exchange rate of countries around the world. The measurement uncertainty in purchasing power parity exchange rate is related to the fact that “relative prices are much more dissimilar between Tajikistan and the US, or China or India and the US, than between Canada and the US.” (Deaton, 2012). This raises questions regarding differences in PPP-adjusted GDP per
0 50 100 150 200 250 300 1 9 6 0 1 9 6 2 1 9 6 4 1 9 6 6 1 9 6 8 1 9 7 0 1 9 7 2 1 9 7 4 1 9 7 6 1 9 7 8 1 9 8 0 1 9 8 2 1 9 8 4 1 9 8 6 1 9 8 8 1 9 9 0 1 9 9 2 1 9 9 4 1 9 9 6 1 9 9 8 2 0 0 0 2 0 0 2 2 0 0 4 2 0 0 6 2 0 0 8 2 0 1 0 2 0 1 2 2 0 1 4 2 0 1 6 GDP p er ca p it a , U S = 1 0 0
7
Djeneba Doumbia | Three Essays on Inclusive Growth | 2018
capita between three reference databases: ICP, World Development Indicators (WDI) and Penn World Table (PWT).
Following the release of the ICP round 2011 by the World Bank (2014, 2015) and the PWT version 9 that incorporates estimates of PPP from ICP round 2011, this section computes differences in PPP-adjusted GDP per capita estimates between the three reference databases: International Comparison Program (ICP) round 2011, World Development Indicators (WDI) version 2016, and Penn World Table (PWT) version 9. This section sheds some light on the sources of these differences.
The release of the ICP round 2011 by the World Bank (2014, 2015) in April 2014 led to surprising results (Dykstra, Kenny, and Sandefur, 2014). According to Deaton and Aten (2017): “Until the publication of these results, the World Bank in its World Development Indicators provided extrapolated PPP exchange rates. For most countries, these were based on the 2005 round of the ICP, updated using relative inflation rates for each country. The new estimates for 2011 from ICP 2011 are quite different from these extrapolations. In particular, most poor countries of the world are estimated to be larger relative to the United States and other rich countries than was estimated from the extrapolations. This aspect of the results has attracted a good deal of attention, particularly the fact that the aggregate Chinese economy is much closer to the United States than previously estimated, and also that the Indian economy is now estimated to be larger than the Japanese economy. The new results also sharply reduce previous estimates of international inequality.”
Deaton and Aten (2017) and Inklaar and Rao (2017) confirmed that the new measures of PPP prices of the ICP round 2011 are more accurate than the measures of the previous round 2005. They emphasize that regions were linked in ICP 2005. In both rounds of ICP, the methodology consists in collecting and comparing prices across countries within a region and then linking the regions (low-income, middle or high-income) to allow international price comparisons. This suggests that changes of prices of lower-income economies relative to higher-income countries are sensitive to changes of the linking approach.
Although impressive progress has been made in computing accurate PPP exchange rates from 2005 to 2011, this section shows that there is not much progress in harmonization among the three main data sources for the benchmark year 2011 with respect to the previous comparison done by Ram and Ural (2013) for the benchmark year 2005 using ICP round 2005, WDI and PWT. Yet, countries that present widely distinct estimates across ICP, WDI and PWT differ between 2011 (this dissertation) and 2005 (Ram and Ural 2013 paper).
8
Djeneba Doumbia | Three Essays on Inclusive Growth | 2018
Countries with significant differences in PPP-adjusted GDP per capita between ICP, PWT and WDI
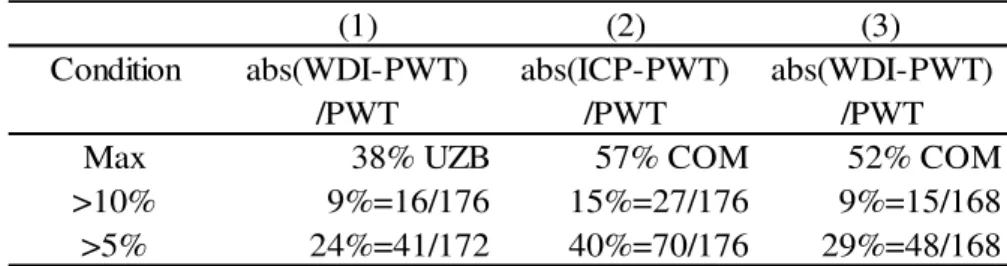
Table 1.1 shows that between 9% (Columns 1 and 3) and 15% (Column 2) of countries have over 10% absolute differences in PPP-adjusted GDP per capita estimates between two databases. Between 24% and 40% of countries have over 5% absolute differences between two databases. Uzbekistan (UZB, 38%) and Comoros (COM, 57% and 52%) have the highest relative differences in PPP-adjusted GDP per capita estimates across the three databases. Table 1.1. Differences in PPP-adjusted GDP per capita estimates across WDI, PWT, and ICP
(In percentage of PWT estimates, in absolute value, year 2011)
Source: Calculations using WDI 2016, PWT 9.0 and ICP round 2011.
While both versions of PWT 9.0 and WDI 2016 use the information of prices found in ICP 2011 as key input, their PPP-adjusted GDP per capita estimates markedly differ from those of ICP for several countries such as Mali. Some countries, for instance Iraq, have measures that differ markedly for each of the three databases. Conversely, other countries have very little differences in PPP-adjusted GDP per capita estimates between ICP and PWT and at the same time significant differences between ICP and WDI or vice versa. Conflict-affected countries, African countries, islands and oil-exporters are over-represented in countries showing large differences between the three data sources. On average, differences in PPP-adjusted GDP per capita estimates between WDI and PWT are smaller than differences between ICP and PWT, and between WDI and ICP.
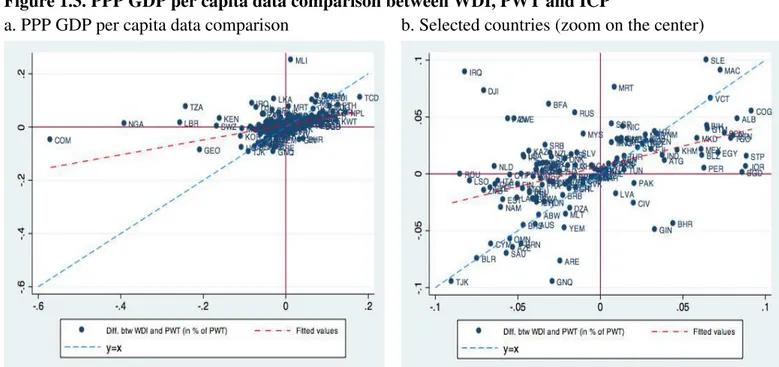
Figure 1.3a illustrates these differences and Figure 1.3b zooms in on some selected countries around the center of Figure 1.3a. These figures include only countries for which the three measures are available. The vertical axis represents (WDI-PWT)/PWT. Countries close to the vertical axis have minor differences in PPP GDP per capita estimates between ICP and PWT. This is the case of Mali (MLI). Countries such as Comoros (COM) and Nigeria (NGA) that are very far from the vertical axis have significant differences between ICP and PWT. For
(1) (2) (3)
Condition abs(WDI-PWT) abs(ICP-PWT) abs(WDI-PWT)
/PWT /PWT /PWT
Max 38% UZB 57% COM 52% COM
>10% 9%=16/176 15%=27/176 9%=15/168
9
Djeneba Doumbia | Three Essays on Inclusive Growth | 2018
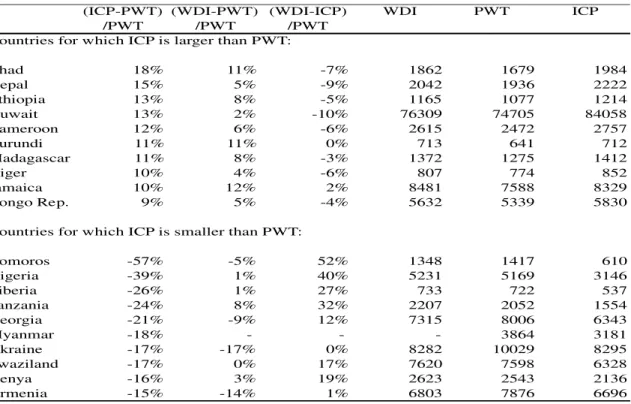
Comoros, estimates of PPP GDP per capita from WDI are 52% larger than PWT estimates. For Nigeria, estimates of PPP GDP per capita from WDI are 40% larger than PWT estimates. Table 1.2 presents 20 countries for which estimates of PPP GDP per capita exhibit the largest differences. Comoros is the country having the largest difference in GDP per capita between ICP and PWT in percentage of PWT. For this country, GDP per capita estimates from ICP are 57% smaller than PWT relative to PWT while the percentage difference between WDI and PWT is only -5%. More than half of the 20 countries displaying the largest percentage differences in PPP GDP per capita between ICP and PWT are African and less developed countries. Yet, a few emerging countries such as Kuwait, Georgia and Ukraine also show significant disparities in PPP-adjusted GDP per capita between ICP and PWT.
The horizontal axis represents (ICP-PWT)/PWT. Countries close to the horizontal axis have small differences in PPP-adjusted GDP per capita estimates between WDI and PWT. This is the case of Comoros (COM) and Nigeria (NGA). For these two countries, PPP-adjusted GDP per capita estimates from WDI widely differ from ICP estimates while differences in PPP-adjusted GDP per capita estimates between PWT and ICP are very small. The first panel of Table 1.3 displays the top 10 countries for which PPP-adjusted GDP per capita estimates from WDI are larger than the ones from PWT. Out of these 10 countries, eight are African countries. For Mali, while WDI PPP-adjusted GDP per capita estimates are larger by about 25% than PWT estimates (relative to PWT), WDI estimates are about 24% larger than ICP estimates but the difference in PPP-adjusted GDP per capita between ICP and PWT is only 1%. This suggests that for this country, corrections made in PWT relative to ICP are minor compared to adjustments made in WDI relative to PWT. The second panel shows countries for which PPP-adjusted GDP per capita estimates from PWT are larger than the ones from ICP. In addition to African countries, some European and Central Asian countries such as Uzbekistan, Turkmenistan, Ukraine and Kyrgyz Republic show significant differences. For instance, PPP-adjusted GDP per capita estimates for Uzbekistan are 38% smaller in WDI than in PWT (in percentage of PWT). However, for countries such as Swaziland (0%), Nigeria (1%) and Liberia (1%) the gaps between WDI and PWT are negligible.
The deviation with respect to the line y=x represents y-x=(WDI-ICP)/PWT. Countries on the line y=x are such that estimates of PPP-adjusted GDP per capita in WDI and ICP are identical. This is the case of Tajikistan (TJK) in Figure 1.3b. WDI PPP-adjusted GDP per capita estimates differ from ICP estimates for countries such as Mali (close to the vertical axis) and Comoros (close to the horizontal axis) – that are far from the line y=x. Table 1.4 presents 20 countries
10
Djeneba Doumbia | Three Essays on Inclusive Growth | 2018
for which estimates of PPP-adjusted GDP per capita in WDI and ICP show the largest differences. 12 African countries are listed in this table. The estimates of PPP-adjusted GDP per capita for Comoros, Nigeria and Tanzania are sizably larger in WDI than in ICP (relative to PWT). For countries such as Chad, Qatar, Bahrain, Nepal, Angola, Kuwait ICP estimates are larger (from 7% to 10%) than WDI estimates.
In Figure 1.3b, Iraq is far from the vertical and horizontal axes as well from the line y=x. This means that fort this country, the three measures of WDI, PWT and ICP are markedly
different. Finally, several countries such as the United States, at the center of the graph have similar measures for the three databases WDI, PWT and ICP.
Figure 1.3. PPP GDP per capita data comparison between WDI, PWT and ICP
a. PPP GDP per capita data comparison b. Selected countries (zoom on the center)
Source: Calculations using WDI 2016, PWT 9.0 and ICP round 2011.
Note: Y-axis presents (WDI-PWT)/PWT and (ICP-PWT)/PWT is shown on X-axis. The deviation with respect to line y=x represents (WDI-ICP)/PWT.
11
Djeneba Doumbia | Three Essays on Inclusive Growth | 2018
Table 1.2. Largest differences of PPP GDP per capita estimates between ICP and PWT (Percentage of PWT, year 2011)
Source: Calculations using WDI 2016, PWT 9.0 and ICP round 2011.
Table 1.3. Largest differences of PPP- GDP per capita estimates between WDI and PWT (Percentage of PWT, year 2011)
Source: Calculations using WDI 2016, PWT 9.0 and ICP round 2011.
(ICP-PWT) (WDI-PWT) (WDI-ICP) WDI PWT ICP
/PWT /PWT /PWT Chad 18% 11% -7% 1862 1679 1984 Nepal 15% 5% -9% 2042 1936 2222 Ethiopia 13% 8% -5% 1165 1077 1214 Kuwait 13% 2% -10% 76309 74705 84058 Cameroon 12% 6% -6% 2615 2472 2757 Burundi 11% 11% 0% 713 641 712 Madagascar 11% 8% -3% 1372 1275 1412 Niger 10% 4% -6% 807 774 852 Jamaica 10% 12% 2% 8481 7588 8329 Congo Rep. 9% 5% -4% 5632 5339 5830 Comoros -57% -5% 52% 1348 1417 610 Nigeria -39% 1% 40% 5231 5169 3146 Liberia -26% 1% 27% 733 722 537 Tanzania -24% 8% 32% 2207 2052 1554 Georgia -21% -9% 12% 7315 8006 6343 Myanmar -18% - - - 3864 3181 Ukraine -17% -17% 0% 8282 10029 8295 Swaziland -17% 0% 17% 7620 7598 6328 Kenya -16% 3% 19% 2623 2543 2136 Armenia -15% -14% 1% 6803 7876 6696
Countries for which ICP is larger than PWT:
Countries for which ICP is smaller than PWT:
(WDI-PWT) (ICP-PWT) (WDI-ICP) WDI PWT ICP
/PWT /PWT /PWT Mali 25% 1% 24% 1863 1489 1509 Jamaica 12% 10% 2% 8481 7588 8329 Gabon 12% 8% 4% 17101 15321 16483 Burundi 11% 11% 0% 713 641 712 Chad 11% 18% -7% 1862 1679 1984 Sri Lanka 10% -3% 13% 9214 8342 8111 Sierra Leone 10% 6% 4% 1415 1286 1369 Macao SAR, 9% 7% 2% 117341 107600 115441 Iraq 9% -8% 17% 13203 12121 11130 Ethiopia 8% 13% -5% 1165 1077 1214 Uzbekistan -38% - - 4412 7072 -Turkmenistan -31% - - 11361 16370 -Ukraine -17% -17% 0% 8282 10029 8295 Maldives -16% -14% -2% 11127 13201 11392 Kyrgyz Repub -15% -11% -4% 2921 3437 3062 Qatar -15% -7% -8% 134117 156909 146521 Armenia -14% -15% 1% 6803 7876 6696 Angola -13% -3% -10% 6524 7528 7288 Congo, Dem. -11% -5% -5% 617 691 655 Bermuda -10% -10% 0% 54985 61338 54899
Countries for which WDI is larger than P
12
Djeneba Doumbia | Three Essays on Inclusive Growth | 2018
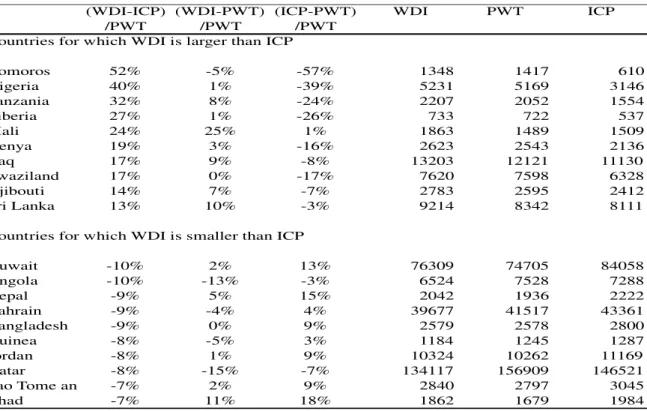
Table 1.4. Largest differences of PPP GDP per capita estimates between WDI and ICP (Percentage of PWT, year 2011)
Source: Calculations using WDI 2016, PWT 9.0 and ICP round 2011.
Understanding differences in PPP-adjusted GDP per capita between ICP, PWT and WDI As GDP per capita is one of the most widely used measures of a country’s standard of living, understanding differences between these three sources is an important matter for researchers and policy makers. For example, Ciccone and Jarociński (2010) and Johnson et al. (2013) highlighted that the variability of vintages of PWT impacts on results of growth studies. One of the causes of the problem may be weak statistical capacity in these countries to collect data (Devarajan, 2013). This dissertation finds correlation coefficients that are rather weak, below 0.1 in absolute value and are not significant. Differences in PPP-adjusted GDP per capita across databases do not seem to be related to the weak statistical capacity of source countries (Table 1.5).
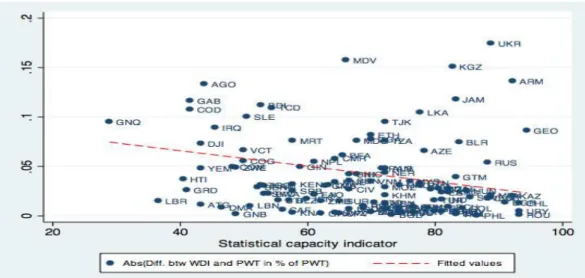
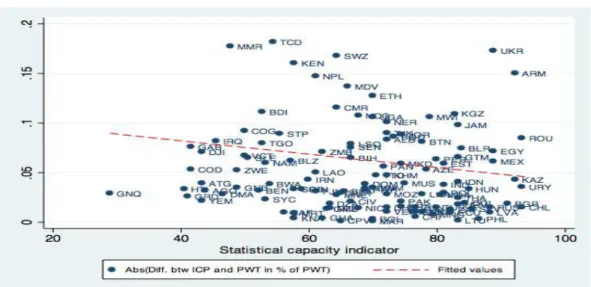
Figure 1.4, Figure 1.5 and Figure 1.6 present correlations between the absolute differences in real GDP per capita across WDI, ICP and PWT (relative to PWT) and the statistical capacity indicator. These figures are zoomed in on countries for which the percentage differences in absolute value are below 20%. Correlations are not significant. However, one observes that some countries (Ukraine, Armenia) with higher levels of statistical capacity indicator report
(WDI-ICP) (WDI-PWT) (ICP-PWT) WDI PWT ICP
/PWT /PWT /PWT Comoros 52% -5% -57% 1348 1417 610 Nigeria 40% 1% -39% 5231 5169 3146 Tanzania 32% 8% -24% 2207 2052 1554 Liberia 27% 1% -26% 733 722 537 Mali 24% 25% 1% 1863 1489 1509 Kenya 19% 3% -16% 2623 2543 2136 Iraq 17% 9% -8% 13203 12121 11130 Swaziland 17% 0% -17% 7620 7598 6328 Djibouti 14% 7% -7% 2783 2595 2412 Sri Lanka 13% 10% -3% 9214 8342 8111 Kuwait -10% 2% 13% 76309 74705 84058 Angola -10% -13% -3% 6524 7528 7288 Nepal -9% 5% 15% 2042 1936 2222 Bahrain -9% -4% 4% 39677 41517 43361 Bangladesh -9% 0% 9% 2579 2578 2800 Guinea -8% -5% 3% 1184 1245 1287 Jordan -8% 1% 9% 10324 10262 11169 Qatar -8% -15% -7% 134117 156909 146521
Sao Tome and -7% 2% 9% 2840 2797 3045
Chad -7% 11% 18% 1862 1679 1984
Countries for which WDI is larger than ICP
13
Djeneba Doumbia | Three Essays on Inclusive Growth | 2018
larger measurement errors in PPP-adjusted GDP per capita between WDI and PWT, and between ICP and PWT (relative to PWT) but a slighter difference between WDI and ICP (0.1% for Ukraine and 1% for Armenia).
Table 1.5. Correlations between Statistical capacity indicator and differences in real GDP per head across PWT, WDI and ICP
Note: Significance level:*** p<0.01, ** p<0.05, * p<0.1.
Figure 1.4. Correlations between statistical capacity indicator and abs(WDI-PWT)/PWT in %
Source: Calculations using WDI 2016, PWT 9.0 and ICP round 2011.
Statistical Capacity
indicator (WDI-PWT)/PWT (ICP-PWT)/PWT
-0.039 0.003 0.439*** -0.081 0.215*** -0.783*** (WDI-PWT)/PWT (ICP-PWT)/PWT (WDI-ICP)/PWT
14
Djeneba Doumbia | Three Essays on Inclusive Growth | 2018
Figure 1.5. Correlations between statistical capacity indicator and abs(ICP-PWT)/PWT in %
Source: Calculations using WDI 2016, PWT 9.0 and ICP round 2011.
Figure 1.6. Correlations between statistical capacity indicator and abs(WDI-ICP)/PWT in %
Source: Calculations using WDI 2016, PWT 9.0 and ICP round 2011.
Major differences in PPP-adjusted GDP estimates may be due to differences in nominal GDP and/or Purchasing Power Parity (PPP) estimates as different agencies use diverse sources of data and different methodologies. For instance, while the World Bank estimates GDP by collecting data from National Statistics Institutes, national accounts and the Organization for Economic Co-operation and Development – OECD’s national accounts data files, PWT relies mainly on data on GDP at current and constant prices, in local currency units from National Accounts. The main source of the National Accounts’ data is the United Nation Main
15
Djeneba Doumbia | Three Essays on Inclusive Growth | 2018
Aggregates Databases. In addition, different countries rely on different definitions, methods and reporting standards in estimating GDP.
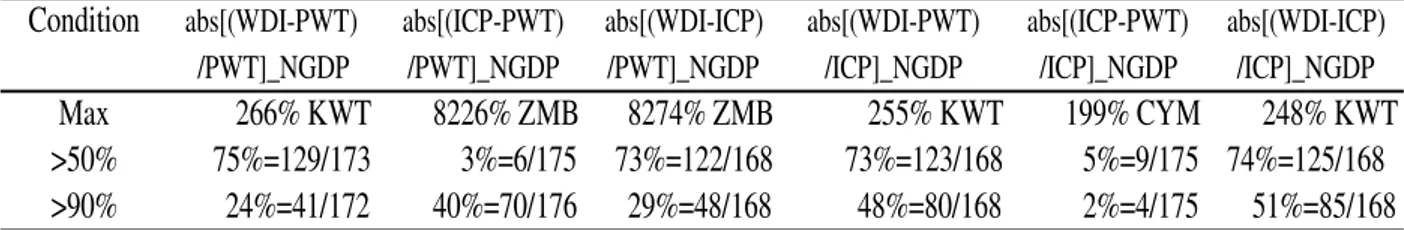
Differences between the three databases in GDP at local currency can be a result of national accounts revisions. Table 1.6 reports absolute differences of nominal GDP estimates across the three databases respectively in percentage of PWT and ICP. For 3% (difference between ICP and PWT) to 75% (difference between WDI and PWT) of countries, percentage differences are higher than 50 percent.
Another cause of significant differences in PPP-adjusted GDP per capita between WDI version 2016, PWT 9.0 and ICP round 2011 may be the different aggregation methods used to compute the Parity Purchase Power (PPP). According to Feenstra, Inklaar and Timmer (2015), low-income countries with lower relative prices of nontraded goods will seem poorer if their expenditures are simply converted at the nominal exchange rate. For example, in 2011 nominal GDP per capita of Cambodia was 1.9% of that of the United States while its real (PPP-adjusted) GDP per capita was 5.9% of that the United States in 2011. To get an estimate of real GDP, PWT statistical agencies rely on an econometrically estimated expenditure function while ICP statistical agencies prefer index-number methods2.
Table 1.7 summarizes absolute differences of PPP estimates between ICP and PWT respectively in percentage of PWT and ICP for the year 2011. 22% of countries have a difference in absolute value of at least 10 percent while three to four percent of countries have more than 50 percent in terms of percentage differences of PPP estimates between ICP and PWT. Countries registering the largest percentage differences include Zambia, Cayman Islands and Kyrgyzstan.
Differences in PPP-adjusted GDP per capita may also be due to discrepancies across databases in population estimates. Devarajan (2013) states that in many countries GDP accounts use old methods and population censuses are out of date.
2 For more details on methods used to compute PPPs by PWT see Feenstra, Inklaar and Timmer (2015),
for methods used by ICP see http://siteresources.worldbank.org/ICPINT/Resources/270056-1255977254560/6483625-1291755426408/01_ICPBook_Framework_NEW.pdf
16
Djeneba Doumbia | Three Essays on Inclusive Growth | 2018
Table 1.6. Absolute differences of Nominal GDP estimates in percentage of PWT and ICP for the year 2011
Source: Authors’ calculation using WDI 2016, PWT 9.0 and ICP round 2011.
Note: Nominal GDP estimates (NGDP) for PWT were estimated using the PPP and real GDP (CGDPE). Table 1.7. Absolute differences of PPP estimates in percentage of PWT and ICP for the year 2011
Source: Authors’ calculations.
Note: PPP estimates were inferred using price level of CGDPO (pl_gdpo=PPP/XR), price level of USA output-side real GDP GDPO in 2011=1 and exchange rate (XR).
Since differences in PPP-adjusted GDP per capita are significant between the three sources especially for some countries, conclusions of research may vary according to which estimates and which sample of countries are used. Table 1.8 reports simple correlations of the World Bank control of corruption index with real (PPP-adjusted) GDP per capita across PWT 9.0, ICP round 2011 and WDI version 2016. Differences in correlations are more pronounced for countries with the largest percentage differences in real GDP per capita between the three sources and low and low-middle income countries than the average country (all the sample). For instance, results show that control of corruption is positively and significantly associated with development in countries with the largest differences in the three GDP estimates when using the ICP real GDP per capita. However, this result does not hold anymore when the real GDP estimates from WDI and PWT are used.
While undertaking international comparison studies, it is important for researchers and policy makers to exercise caution when forming critical recommendations as differences in data sources can impact results.
Condition abs[(WDI-PWT) abs[(ICP-PWT) abs[(WDI-ICP) abs[(WDI-PWT) abs[(ICP-PWT) abs[(WDI-ICP)
/PWT]_NGDP /PWT]_NGDP /PWT]_NGDP /ICP]_NGDP /ICP]_NGDP /ICP]_NGDP
Max 266% KWT 8226% ZMB 8274% ZMB 255% KWT 199% CYM 248% KWT
>50% 75%=129/173 3%=6/175 73%=122/168 73%=123/168 5%=9/175 74%=125/168
>90% 24%=41/172 40%=70/176 29%=48/168 48%=80/168 2%=4/175 51%=85/168
Condition abs[(ICP-PWT) abs[(ICP-PWT)
/PWT]_PPP /ICP]_PPP
Max 94673% ZMB 180% CYM
>50% 3%=5/175 4%=7/175
17
Djeneba Doumbia | Three Essays on Inclusive Growth | 2018
Table 1.8. Illustrative correlations of World Bank control of corruption with real GDP per head as reported in PWT, ICP and WDI for 2011
Note: Significance level:*** p<0.01, ** p<0.05, * p<0.1. Countries with largest differences are those countries reported in Tables 1.3,1.4 and 1.5.
Source: Author’s calculations using WDI 2016, PWT 9.0, ICP round 2011 and World Bank Gini index.
1.2.1.3. Inequality of opportunities
In addition to income inequality, most countries around the world face significant inequality of opportunities. Inequality in outcomes and inequality of opportunities are strongly associated (Lefranc, Pistolesi and Trannoy, 2008 among others). This subsection discusses the evolution of various aspects of inequality of opportunities, including access to education, health and financial services, in different parts of the world.
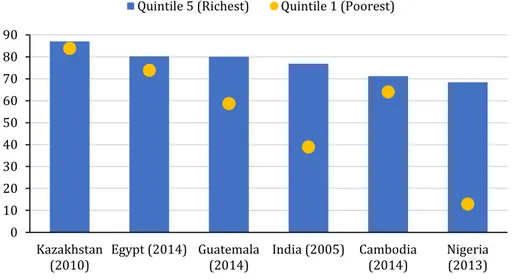
Health. There is a significant gap between the wealthiest and the poorest in terms of access to healthcare, particularly in developing economies. Figure 1.7 displays the coverage of reproductive, maternal, newborn, and child health interventions by income shares. It shows that there is a major difference in health coverage between rich and poor people, particularly in Sub-Saharan Africa. In Nigeria, 68.4 percent of the richest 20 percent have access to these health interventions as compared to only 13 percent for the poorest quintile of income distribution.
Education. There are large disparities in access to education between the richest and poorest 20 percent. As presented in Figure 1.8, the average years of education for individuals aged between 20 and 24 are much higher for the richest quintile than for the poorest quintile. The gap is larger in Nigeria where the average years of schooling for the 20-24 years old are 12 for the top quintile and below 2 for the bottom quintile. Such a gap is smaller in Kazakhstan. Financial services. Access to finance is important for households, particularly low-income individuals. Households, especially poor ones may need credit to afford appropriate health services, adequate education and nutrition. The lack of adequate financial services can thus generate income inequality. There are some disparities in access to financial services across the income distribution. The share of adults in the top 60 percent of the income distribution
PWT ICP WDI
All sample 0.8231*** 0.8320*** 0.8286***
Countries with largest differences in % 0.1527 0.5348** 0.285
18
Djeneba Doumbia | Three Essays on Inclusive Growth | 2018
with a bank account is higher as compared to the share for adults in the bottom 40 percent in the income distribution (Figure 1.9). At the global level, 66 percent of adults in the top 60 percent of income distribution have accounts at a financial institution as compared with 53.3 percent of adults in the bottom 40 percent of the income distribution. The gap is wider in Sub-Saharan Africa than in other regions.
Figure 1.7. Health, Representative countries across regions, by Wealth Quintiles (Reproductive, maternal, newborn and child health interventions, combined, in percent)
Source: World Health Organization, Health Equity Monitor database Figure 1.8. Education, Representative countries across regions
Source: World Inequality Database on Education (WIDE).
0 10 20 30 40 50 60 70 80 90 Kazakhstan (2010) Egypt (2014) Guatemala (2014) India (2005) Cambodia (2014) Nigeria (2013) Quintile 5 (Richest) Quintile 1 (Poorest)
0 2 4 6 8 10 12 14 Kazakhstan (2015)
Egypt (2014) Nigeria (2013) India (2005) Guatemala (2014)
Cambodia (2014) Quintile 5 (Richest) Quintile 1 (Poorest)
19
Djeneba Doumbia | Three Essays on Inclusive Growth | 2018
Figure 1.9. Financial Services, by Income Share, Representative countries across regions (Accounts at a financial institution, percent of total 15+ population, 2014)
Source: Global Findex database, World Bank Note: Developing region only.
1.2.2. Poverty
International comparisons of poverty data entail many issues. First, poverty measurements require household survey data for frequent measures of income or consumption and its distribution across households. However, household surveys are not conducted on each year. Therefore, one needs additional data to produce a reliable length of time for poverty data. Second, sampling weights, which ensure the survey is nationally representative are needed to produce poverty estimates. However, census data, which are required to produce sampling weights are often of low quality or outdated. Third, population data are also required to produce poverty rates and poverty counts. Typically, population censuses are conducted every 10 years (World Bank, 2015). In addition, to estimate the number of extreme poor in the world it is essential to rely on a poverty line that is comparable across countries. Purchasing Power Parity (PPP) index numbers from the International Comparison Program (ICP) are used to adjust differences in the cost of living across different countries. It is worth noting that poverty estimates tend to be sensitive to changes in the PPP data (World Bank, 2015).
Table 1.9 (upper panel) below presents the number of people living on less than $1.25 per day by region. One observes that across the world, the poverty headcount at $1.25 declined from 1990 to 2008, but it remains high essentially in Sub-Saharan Africa and South Asia. Table 1.9 (lower panel) shows the evolution of poverty worldwide and by region. Extreme poverty
0 10 20 30 40 50 60 70 80 East Asia and Pacific
World Europe and Central Asia
South Asia SubSaharan Africa
Middle East
20
Djeneba Doumbia | Three Essays on Inclusive Growth | 2018
declined worldwide over the last two decades particularly in East Asia and Pacific where poverty rates dropped from more than 60 percent in 1990 to less than 4 percent in 2013. The other regions except Europe and Central Asia also experienced reductions in poverty but to a lesser extent. Even with these recorded progress, the number of extreme poor was estimated at 768.51 million in 2013. More than a half of extreme poor lived in Sub-Saharan Africa in 2013. Table 1.9. World and Regional Poverty Estimates
Source: PovCalnet, World Bank
East Asia and Pacific
Europe and Central Asia
Latin America and the Caribbean
Middle East and
North Africa South Asia
Sub-Saharan Africa World 1990 983.59 8.08 70.33 14.2 505.74 278.06 1,864.60 2002 553.74 29.3 69.83 9.46 556.01 396.31 1,619.74 2010 221.19 13.7 37.58 7.99 400.6 400.54 1,087.65 2013 73.86 10.41 30.09 8.27 249.09 390.26 768.51 1990 61.38 1.74 15.96 6.18 44.64 54.37 35.28 2002 29.98 6.24 13.06 3.23 38.68 56.14 25.81 2010 11.26 2.88 6.35 2.36 24.57 45.67 15.69 2013 3.68 2.16 4.91 2.31 14.66 40.98 10.7
Number of Poor (millions), $1.9/ day
21
Djeneba Doumbia | Three Essays on Inclusive Growth | 2018
1.3. Outline and main results
This dissertation provides some evidence-based policy lessons in alleviating poverty and attaining pro-poor and inclusive growth. It comprises three main chapters, in addition to the overview chapter. The second chapter examines the role of institutions in promoting pro-poor and inclusive growth at the macroeconomic level. Using a novel empirical model, it assesses the nonlinear relationship between good governance, pro-poor and inclusive growth. The findings show that growth has been pro-poor – that is, it has reduced poverty. However, growth has been not inclusive, as it did not significantly impact the growth of the income share held by the poorest 20 percent. All features of good governance are pro-poor but only government effectiveness and rule of law promote inclusive growth. While the impact of growth on the income of the poor is nonlinear and increases with the control of corruption, the relationship between government effectiveness and inclusive growth is linear. Education spending, infrastructure improvement, and financial development are key factors for promoting poverty reduction and inclusive growth.
Can a government reduce income inequality by changing the composition of public spending while keeping the total level fixed? This question is of particular relevance given the everlasting financing constraint most governments face, either because of already high public spending, elevated public debt, limited domestic resources, or the combination of the three. The third chapter examines the effects of public spending reallocation on income inequality. Using a newly assembled data on disaggregated public spending for 83 countries across all income groups, it shows that reallocating spending towards social protection and infrastructure is associated with reduced income inequality, particularly when it is financed through cuts in defense spending. However, the political and security situation matters. We do not find evidence that lowering defense spending to finance infrastructure and social outlays improves income distribution in countries with weak institutions and at higher risk of conflict. Reallocating social protection and infrastructure spending towards other type of spending tend to increase income inequality. Accounting for the long-term impact of health spending, and particularly education spending, help to better capture their equalizing effects.
The fourth chapter uses 1-2-3 survey data on the Democratic Republic of Congo to analyze heterogeneity in the informal sector. It empirically identifies three types of entrepreneurs in the sector. The first group of entrepreneurs—top performers—is growth oriented and enjoys greater access to capital. The second group—constrained gazelles—includes entrepreneurs who share many characteristics, especially management skills, with the top performers, but
22
Djeneba Doumbia | Three Essays on Inclusive Growth | 2018
operate with less capital. The third group—survivalists—comprises firms struggling to grow. Based on logit and fixed effect ordinary least squares models, the results presented in this chapter show that poverty and income inequality are more common among constrained gazelles and survivalists. The chapter also shows that income inequality is explained mainly by educational disparities and lack of credit access among entrepreneurs. Additionally, the outcomes of a Blinder-Oaxaca decomposition show that the performance of firms is a key factor in explaining differences in income. Examining the drivers of performance, the chapter finds that human capital and managerial skills are important engines of performance.
23
24
Djeneba Doumbia | Three Essays on Inclusive Growth | 2018
Chapter 2 The Quest for Pro-poor
and Inclusive Growth: The Role of
Governance
25
Djeneba Doumbia | Three Essays on Inclusive Growth | 2018
Abstract: This chapter analyses the role of good governance in fostering pro-poor and inclusive growth. Using a sample of 112 countries over 1975–2012, it shows that growth is generally pro-poor. However, growth has not been inclusive, as illustrated by a decline in the bottom 20 percent of the income distribution. While all features of good governance support income growth and reduce poverty, only government effectiveness and the rule of law are found to enhance inclusive growth. The investigation of the determinants of pro-poor and inclusive growth highlights that education, infrastructure improvement, and financial development are the key factors in poverty reduction and inclusive growth. Relying on the panel smooth transition regression (PSTR) model following Gonzalez, Tersvirta and Dijk (2005), this chapter identifies a nonlinear relationship between governance and pro-poor growth, while the impact of governance on inclusive growth appears to be linear.
26
Djeneba Doumbia | Three Essays on Inclusive Growth | 2018
2.1. Introduction
Poverty remains widespread, particularly in developing countries, notwithstanding recent progress. While the aggregate worldwide poverty rate was reduced by about half between 1990 and 2010 mainly thanks to robust growth, the World Bank estimated that more than 1.22 billion people lived with less than $1.25 a day in 2010. To contrast the encouraging dynamic in poverty reduction, income inequality has risen across the world over the last two decades. How do these two divergent dynamics impact the income opportunities of the less fortunate, namely the poorest 20 percent of the population? This is an important policy question that has led to the development of new concepts for pro-poor growth and increased focus on income distribution with new studies on inclusive growth.
Numerous empirical and statistical studies have identified economic growth as one of the main factors affecting poverty reduction (Dollar and Kraay, 2002; Dollar, Kleineberg and Kraay, 2013). Moreover, there is a growing understanding that economic, political, legal and social institutions are critical for economic prosperity. Since the 1990s the concept of “good governance” has become central in the discussion and design of development policies. Since both governance and pro-poor growth are important in development policies agenda, the question arises as to whether and how they are related to each other.
This chapter provides a cross-country analysis investigating the role of economic growth in poverty reduction and adds two main contributions to the existing literature. First, it contributes to the recent and growing literature on inclusive growth by assessing how pro-poor and inclusive growth has been. It also investigates the main structural factors that impact inclusive growth with a particular attention to an important channel that has received little attention so far: the quality of governance. Second, focusing on governance, the chapter investigates the potential non-linearities in the impact of growth on the poor depending on the quality of governance.
The analysis therefore sheds some light on the role of governance in making growth more poor and inclusive. Following Ravallion and Chen (2003), this chapter defines growth as pro-poor simply if it reduces poverty or increases the income of the pro-poor while inclusive growth refers to growth which is not associated with an increase in inequality (Rauniyar and Kanbur, 2010).
The chapter relies on panel fixed effect estimations and the Generalized Method of Moments in System (SYS-GMM) following Arrellano and Bover (1995). This method attempts to