HAL Id: hal-01352466
https://hal.inria.fr/hal-01352466
Submitted on 8 Aug 2016
HAL is a multi-disciplinary open access
archive for the deposit and dissemination of
sci-entific research documents, whether they are
pub-lished or not. The documents may come from
teaching and research institutions in France or
abroad, or from public or private research centers.
L’archive ouverte pluridisciplinaire HAL, est
destinée au dépôt et à la diffusion de documents
scientifiques de niveau recherche, publiés ou non,
émanant des établissements d’enseignement et de
recherche français ou étrangers, des laboratoires
publics ou privés.
Towards large-scale city reconstruction from satellites
Liuyun Duan, Florent Lafarge
To cite this version:
Liuyun Duan, Florent Lafarge. Towards large-scale city reconstruction from satellites. European
Conference on Computer Vision (ECCV), Oct 2016, Amsterdam, Netherlands. �hal-01352466�
Liuyun Duan and Florent Lafarge
Inria
Abstract. Automatic city modeling from satellite imagery is one of the biggest challenges in urban reconstruction. Existing methods produce at best rough and dense Digital Surface Models. Inspired by recent works on semantic 3D recon-struction and region-based stereovision, we propose a method for producing com-pact, semantic-aware and geometrically accurate 3D city models from stereo pair of satellite images. Our approach relies on two key ingredients. First, geometry and semantics are retrieved simultaneously bringing robustness to occlusions and to low image quality. Second, we operate at the scale of geometric atomic re-gion which allows the shape of urban objects to be well preserved, and a gain in scalability and efficiency. We demonstrate the potential of our algorithm by reconstructing different cities around the world in a few minutes.
Keywords: 3D reconstruction, city modeling, satellite imagery, urban scenes
1
Introduction
Automatic city modeling has received an increasing interest during the last decade. In applicative fields such as urban planning, telecommunications and disaster control, producing compact and accurate 3D models is crucial. Aerial acquisitions with Lidar scanning or multi-view imagery constitute the best way so far to automatically create 3D models on large-scale urban scenes [1]. Because of high acquisition costs and au-thorization constraints, aerial acquisitions are, however, restricted to some spotlighted cities in the world. In particular, Geographic Information System (GIS) companies pro-pose catalogs with typically a few hundred cities in the world. Satellite imagery ex-hibits higher potential with lower costs, a worldwide coverage and a high acquisition frequency. Satellites have however several technical restrictions that prevent GIS prac-titioners from producing compact city models in an automatic way [2].
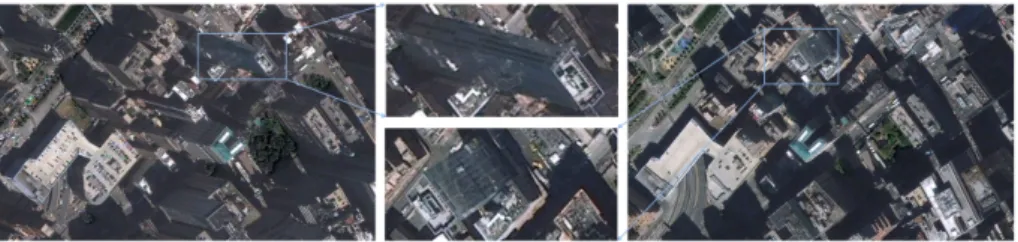
Inspired by recent works on semantic 3D reconstruction and region-based stereovi-sion, we propose a method for producing compact, semantic-aware and geometrically accurate 3D city models from stereo pairs of satellite images. Our approach relies on two key ingredients. First, geometry and semantics are retrieved simultaneously bring-ing robustness to occlusions and to low image quality. Second, contrary to pixel-based methods, we operate at the scale of geometric atomic region: it allows the shape of ur-ban objects to be better preserved, and also a gain in scalability and efficiency. Figure 1 illustrates our goal.
Fig. 1. Reconstruction of Denver downtown. Starting from a stereo pair of satellite images (left), our algorithm produces a compact and semantic-aware 3D model (right) in a few minutes.
2
Related works
Our review of previous work covers three main facets of our problem: urban reconstruc-tion, region-based stereo matching, and object polygonalization.
Urban reconstruction. Reconstruction of urban objects and scenes has been deeply explored in vision, with a quest towards full automation, quality and scalability, and ro-bustness to acquisition constraints [1]. In this field, geometry and semantics are closely related. The most traditional strategy consists in retrieving semantics before geometry. In many city modeling methods [3,4,5], data are first classified so that the subsequent 3D reconstruction can be adapted to the nature of urban objects. Buildings are the most common reconstructed objects, either from multiview imagery [6,7,8] or airborne Lidar [4,9]. Recent works [10,11,12] demonstrate that the simultaneous extraction of geome-try and semantics, also known as semantic 3D reconstruction, outclasses multiple step strategies in terms of output quality. However, these works typically suffer from a low scalability and often produce 3D models without structural consideration. Semantic 3D reconstruction remains a challenge at the scale of satellite images.
Region-based stereo matching. Numerous works have been proposed in stereo match-ing [13]. While well-established methods as the Semi-Global Matchmatch-ing (SGM) algo-rithm [14] reason at the scale of the pixel, some works focus on matching image regions to more accurately preserve object boundaries [15,16]. Beyond boundary accuracy, region-based stereo matching methods can offer high scalability and time-efficiency [17]. Some works [18,19] also combine object segmentation or classification with stereo matching in unified frameworks. Inference for these models is, however, a complex task that requires time-consuming optimization procedures. Overall, most of these meth-ods are not adapted to satellite images whose wide baselines typically produce severe occlusion problems that are not specifically handled. The additional use of geometric primitives as line-segments usually helps to better interpret occluded parts of images [20].
Object polygonalization. Capturing objects by polygonal shapes provides a compact and structure-aware representation of the object contours. It is particularly adapted at
representing regular objects as roofs from images. Object polygonalization methods typically depart from the detection of line-segments which are then assembled into polygons. This second step can be done, for instance, by searching for cycles in a graph of line-segments [21], or by connecting line-segments with a gap filling strategy [22]. Grouping atomic regions [23] is also a possible approach, especially when the number of objects is high, and the input image is big. It requires, however, a post-processing step to vectorize chains of pixels into polygons with typically a loss of accuracy.
3
Positioning and contributions
Satellite context imposes a set of technical constraints with respect to traditional aerial acquisitions, in particular (i) a lower pixel resolution, typically ≥ 0.5 meter, (ii) a lower signal-to-noise-ratio impacting the image quality, and (iii) a wider baseline to guarantee a reasonable depth accuracy. Although these constraints have a low impact on some applications as change detection [24] or generation of dense Digital Surface Models [25], they challenge the automatic reconstruction of compact and semantic-aware city models.
Fig. 2. Satellite context. A wide baseline is a necessity to reach reasonable depth accuracy, but brings severe occlusion problems. A facade side is typically visible only in one image (see close-ups). Note also the high proportion of shadow and the time-varying objects as cars.
We propose an automatic city modeling method from satellite imagery whose output approaches the quality of 3D-models delivered by airborne-based methods. We consider as input a calibrated stereo pair of satellite images. Our output city model is a compact mesh composed of ground and building objects. Buildings are represented with a Level Of Detail 1 (LOD1) of the CityGML formalism [26], ie piecewise planar buildings with flat roofs and vertical facades. Our method proceeds with three main steps illustrated on Figure 3.
Our main contributions are (i) a full pipeline for producing compact and semantic-aware city models from satellite images, (ii) a time-efficient and scalable approach based on geometric atomic regions, and able to reconstruct big cities in a few min-utes, and (iii) a joint classification and reconstruction process that brings robustness to the low quality of input images.
(a) (b) (c) (d) (e)
Fig. 3. Overview. Input stereo images (a) are first decomposed into atomic convex polygons (b) using existing works (Section 4). In a second step detailed in Section 5, the semantic class and the elevation of each polygon are simultaneously retrieved in the two partitions (c). The last step (Section 6) consists in unifying the two partitions enriched by semantic classes and elevation values into a planimetric elevation representation (d) that allows the generation of the output 3D model (e).
4
Polygonal partitioning
Reasoning at the scale of pixel on big satellite images tends to produce non-scalable algorithms that poorly capture geometric information at higher scales [2]. We rather an-alyze satellite images at the scale of atomic regions, whose efficiency has been demon-strated in shape extraction [23] or stereo matching [17]. Instead of using traditional superpixel methods, we rely on a geometric algorithm that decomposes images into atomic convex polygons [27]. This algorithm is applied independently on both stereo images with a polygon size fixed to 5 pixels (average distance to polygon centroids to its edges) in our experiments. As illustrated on Figure 4, it captures geometric regular-ities in images by aligning contours of atomic polygons with linear structures as roof edges. Note that the line-segments embedded into the polygonal partitions will be used further in our approach.
The polygons are enriched with an elevation estimate which corresponds to the al-timetric distance between the observed surface captured in the polygon and the ground. For each polygon, we define its elevation estimate as the difference between the mean of the pixel depths contained inside the polygon (computed by Semi-Global Match-ing [14] with double checkMatch-ing), and the depth of the ground (computed by a standard Digital Terrain Model (DTM) estimation method [28]). Because of the wide baseline of our stereo pairs, polygons without elevation estimates are frequent, especially when associated to facade elements as illustrated in Figure 4. In return, elevation estimates are relatively accurate and present on a very large majority of roofs. Our strategy is thus to couple these elevation estimates with the geometric information contained in the polygonal partitions to retrieve building contours even for partially occluded roofs.
0 100 Ele v ation estimate (in meter)
Fig. 4. Polygonal partitioning and elevation estimates. Left and right polygonal partitions capture linear structures contained in input images, and in particular building edges. Elevation estimates sparsely cover the polygonal partitions (see colored polygons). Each roof contains at least a few elevation estimates.
We denote by Pl and Pr the polygonal partitions produced by [27] for the left
and the right images respectively. P?
l ⊂ Plrepresents the set of polygons in Plwith
elevation estimates. A polygon i ∈ Pl∪ Pr associated with an elevation estimate di
is projected in 3D using the traditional Rational Polynomial Coefficients (RPC) model [29]. Two polygons i ∈ Pland j ∈ Prwith respective elevation estimates diand dj
are said to be imbricate if the orthographic projections into the horizontal plane of the 3D polygons overlap. In this case, we denote by τij ∈ [0, 1] the overlapping ratio of the
orthographic projections, ie the intersection area to union area ratio. These notations are illustrated in Figure 5.
left polygonal partition Pl right polygonal partition Pr
horizontal plane
i
j
(j, dj) (i, di)
Fig. 5. Orthographic projection of polygons. Polygons i and j with respective elevation estimates diand djare projected in 3D using the RPC model. These two polygons are imbricate as their
5
Joint classification and elevation recovery
Starting from the two polygonal partitions and sparsely distributed elevation estimates, our goal is now to retrieve simultaneously the semantic class and the elevation of each polygon of the partitions.
Two semantic classes of interest are considered: roof and other. Class other mainly refers to ground and facade elements. Because of the wide baseline, most of these ele-ments are only visible in one image. As our main objective is to reconstruct buildings, considering only these two classes is sufficient under the assumption that facades are vertical. Contrary to class other, class roof is associated with an elevation value. By considering the classification problem as a labeling formulation, the set of possible la-bels can then be defined as L = {z1, ..., zn, other} where z1, ..., znare the n possible
elevation values of a roof. To set z1, ..., zn, we cluster the set of elevation estimates by
Kmeans with K = n + 1, and associate the n highest centroids to them. As the ground falls into the class other, the centroid with the lowest value is reset to zero. We denote by σ(zk) the standard deviation of the kthcluster.
The quality of a configuration of labels l ∈ Lcard(P)is measured through an energy U of the form: U (l) =X i∈P Ddata(li) + β1 X (i,j)∈Es Vsmoothness(li, lj) + β2 X (i,j)∈Ec Vcoupling(li, lj) (1) where Ddatais the unary data term, and Vsmoothnessand Vcouplingare pairwise
poten-tials favoring respectively label smoothness and label coherence between left and right partitions. Esand Eccorrespond to two sets of pairs of adjacent polygons. β1and β2are
parameters weighting the three terms of the energy.
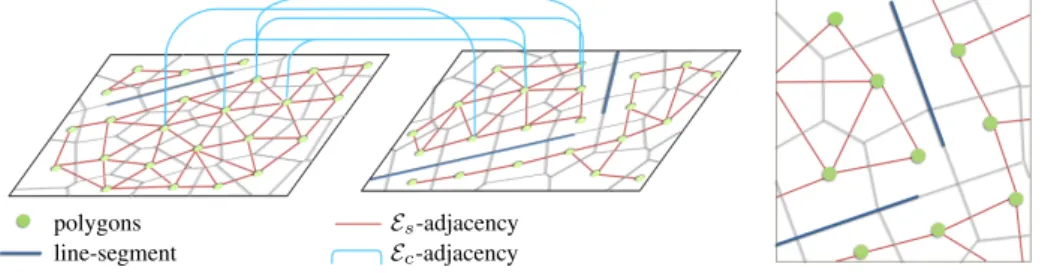
Polygon adjacency. The two adjacency sets Esand Ecimpose spatial dependencies
be-tween polygons, either within the same polygonal partition for the former or in bebe-tween the polygonal partitions for the later, as illustrated on Figure 6.
Escontains pairs of polygons who share a common edge which is not supported by one
of the line-segments embedded into the polygonal partitions. As illustrated in Figure 6-right, this condition on line-segments is particularly efficient for stopping label prop-agation when meeting building edges.
Ec is defined as the set of imbricate polygons, ie the pairs of polygons i ∈ Pl? and
j ∈ P?
r so that τij > 0.
Data term. It measures the coherence between the elevation estimate of a polygon and its proposed label. For polygons without an elevation estimate, we favor the occurrence of the label other as a polygon without a depth estimate is most likely to capture an element visible only in one image such as facade and, to a lesser extent, ground. The data term is expressed as
Ddata(li) = 1 − e −(li−di)2 2σ(li)2 if i ∈ P? α · 1{li6=other} otherwise (2)
Es-adjacency Ec-adjacency line-segment
polygons
Fig. 6. Polygon adjacency. Two types of pairwise interactions between polygons are taken into ac-count in the labeling formulation: within the same partition and in between partitions (left). Line-segments embedded into the partitions prevent neighboring polygons from interacting (right).
where di is the depth estimate of polygon i,1{·}is the characteristic function, and α
is the penalty weight for not choosing other. When label other is attributed to polygon i ∈ P?, we set lito 0.
Smoothness. The smoothness term penalizes Es-adjacent polygons with different labels
using a generalized Potts model:
Vsmoothness(li, lj) = wij· 1{li6=lj} (3)
where the weight wijreduces the penalty of having different labels when the radiometry
of pixels inside the two polygons is not similar. In practice, wijis chosen as one minus
the normalized histogram distance in norm L2.
Coupling. Similarly to the smoothness potential, the coupling term is defined by a generalized Potts model, here, between imbricate polygons.
Vcoupling(li, lj) = τij· 1{li6=lj} (4)
where τij allows polygons with different labels to be penalized proportionally to their
overlapping ratio.
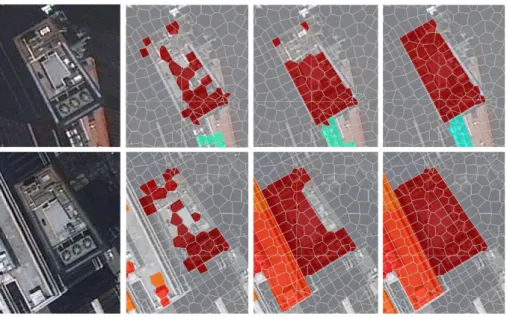
Optimization. An approximation of the global minimum of the energy is found using the α-β swap algorithm [30]. Figure 7 shows the impact of the different terms of the energy. In the sequel, we call enriched partition, a polygonal partition whose polygons have received a class and eventually an elevation value by this energy minimization.
6
Fusion of enriched partitions
The projection in 3D of left and right enriched partitions gives two different interpreta-tions of the shape of objects as (i) some roof parts are frequently occluded between the two images, (ii) the shapes of polygons between left and right partitions do not neces-sarily correspond, and (iii) the coupling term of Eq. 1 is a soft constraint that does not guarantee that imbricate polygons have the same elevation. To unify the two interpreta-tions into a unique 3D model, we project all 3D polygons into the horizontal plane, and relabel elevations inside the new induced horizontal partition.
Fig. 7. Impact of the different energy terms. Roofs are sparsely labeled using the data term only (β1 = β2 = 0, 2ndcolumn). Adding the smoothness potential propagates roof labels while
preserving building edges (β2 = 0, 3rdcolumn). The labeling coherence between the left and
right partitions is enforced considering the complete energy formulation (right column).
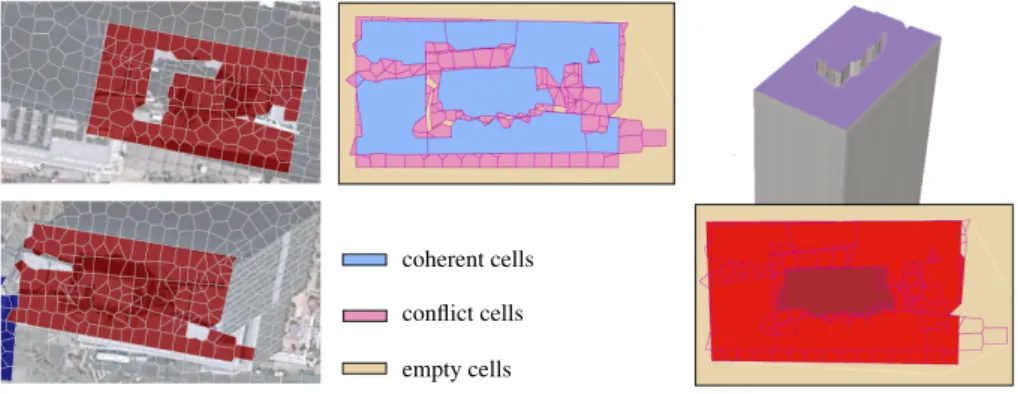
Orthographic projection. Each polygon i ∈ P whose class is not other is projected into the horizontal plane. The superposition of projected polygons from left and right partitions produces a decomposition of the horizontal plane into new polygons that we call cells. Note that the cells are not necessarily convex. We denote by C the set of cells. Each cell inherits the elevations of the polygons that overlap with it. We denote by Zk,
the set of elevations inherited by cell i ∈ C. Different types of cells can be distinguished: – Coherent cells are cells that inherit two identical elevations, one from the left par-tition and one from the right. The elevation value of these cells is not modified further.
– Conflict cells are cells that inherit at least one elevation, and that are not coherent cells.
– Empty cells are cells without inherited elevation. Theses cells, which typically fill in the holes in the cell decomposition, mainly corresponds to ground or small roof parts.
We denote by Ccoherent, Cconf lict and Cempty these three sets of cells respectively,
illustrated in Figure 8.
Cell relabeling. For fusing enriched partitions, each conflict or empty cell must be associated with a unique elevation. We relabel those cells using an energy formulation
coherent cells conflict cells empty cells
Fig. 8. Fusion of enriched partitions. Projecting the enriched partitions (left) into the horizontal plane produces a cell decomposition in which three groups of cells can be distinguished (middle). The relabeling of the elevation of conflict and empty cells gives a unified 3D model (right).
with a standard form:
E(x) = X k∈C? Ak· Ed(xk) + λ X (k,k0)∈N Lkk0· Er(xk, xk0) (5) where C? = C
conf lict∪ Cempty, the label xk of cell k is an elevation value in Z =
{0, z1, ...zn}, and N is the set of pairs of adjacent cells in C that have at least one cell
belonging to C?. E
d, Erand λ are respectively the unary data term, the pairwise
poten-tial and the weighting parameter between the two terms. Akand Lkk0 are respectively
the area of cell k, and the length of the common edge between cells k and k0: they are introduced to normalize the energy with respect to the size of cells.
The intuition behind the data term is that (i) an empty cell is more likely to be ground with an elevation value of 0, and (ii) a conflict cell is more likely to be roof with an elevation value as close as possible to its inherited elevations:
Ed(xk) = 0 if k ∈ Cemptyand xk= 0
min{|xk− z|z∈Zk} else if k ∈ Cconf lictand xk6= 0
γ otherwise
(6)
where γ is a penalty for not respecting this intuition.
The pairwise potential is a generalized Potts model that increases the penalty be-tween two cells when their common edges projected in 3D back-project well into the images. As we consider the pairs of cells with different elevations xkand xk0, each pair
has exactly two common edges in 3D: one at elevation xk, the other at elevation xk0.
The pairwise term is expressed by
Er(xk, xk0) = min(Gl(xk) + Gl(xk0), Gr(xk) + Gr(xk0)) · 1{x
where Gl(xk) (respectively Gr(xk)) is a back-projection measure of the common edge
at elevation xkinto the left (resp. right) image. In practice, the back-projection measure
is defined as the absolute value of one minus the scalar product between the image gradients and the gradients of the back-projected edge.
Optimization. For efficiency reasons, the energy minimization is spatially decomposed into independent subproblems. We regroup the connected conflict and coherent cells into clusters while allowing empty cells to be inside. Each cluster intuitively corre-sponds to a building or a building block. The α-β swap algorithm [30] is then operated over the set of conflict and empty cells of each cluster. Note that, for each cluster, we re-strict the label set Z to the inherited elevations of its cells. Optionally, the optimization can be performed in parallel on each cluster.
Compact city model. The ground is represented in 3D by a mesh surface triangu-lated from the altitude estimates [28]. From the optimal label configuration, roofs are inserted by simply elevated cells to their elevation label from the ground. The facade components are finally added by creating vertical facets between the adjacent cells with different labels.
7
Experiments
We experimented our method with stereo pairs from QuickBird2, WorldView2 and Pleiades satellite images with pixel resolution at 0.6, 0.5 and 0.5 meter respectively. All the experiments have been done on a single computer with Intel Core i7 processor clocked at 2GHz.
Implementation details. Our algorithm is implemented in C++ using the Computa-tional Geometry Algorithms Library (CGAL) [31] for manipulating geometric data structures in 2D and 3D, and the Geospatial Data Abstraction Library (GDAL) [32] for processing basic operations with satellite images. The cell decomposition in Sec-tion 6 is computed using a constrained Delaunay triangulaSec-tion whose constrained edges correspond to the orthographic projection into the horizontal plane of the polygon edges of both partitions. The number of parameters is large, ie 6, but this is the price to pay for a full pipeline combining semantic and geometric considerations in an unsupervised manner. In all our experiments except Fig. 7, we fixed the weights of the two energies to β1= 0.2, β2= 10 and λ = 2.5, and the penalties to α = 0.05 and γ = 2. The number
of possible roof elevations is set to n = 50, except for US cities where skyscrapers requires increasing its value to 100.
Robustness. Our output models provide a faithful LOD1 representation of buildings, as illustrated in Figure 9. With the current satellite resolutions, a more detailed building representation such as LOD2 is not realistic. Cases that challenge our algorithm are the small buildings, typically houses in residential areas, and the textureless and reflective objects which, generally speaking, constitute an important challenge in stereovision. Our method can handle buildings with some parts are visible only in one image. How-ever, large occluded parts can generally not be recovered.
Fig. 9. Reconstruction of buildings. On simple buildings (top examples), left and right enriched partitions (left columns) are relatively similar. For more complex buildings (bottom examples), enriched partitions are more different: their fusion allows us to find a consensual 3D output model. With freeform architectural structures (middle example), curved roofs are roughly approximated by a step-like geometry. The back-projection into the input images of the roof edges from the output 3D model shows a good accuracy of both building elevations and contours (see red lines in right columns).
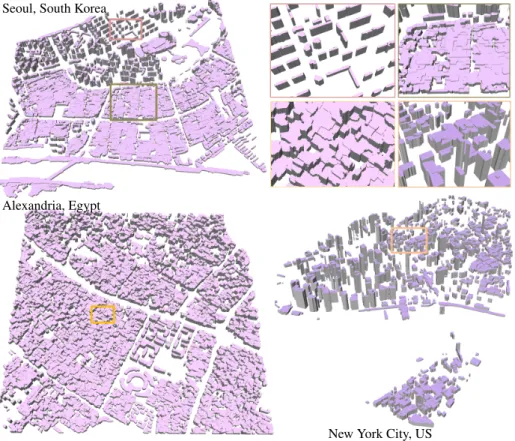
Scalability. Our algorithm has been tested on several cities presenting different urban landscapes, as shown on Figures 3 and 10. Dense downtowns in antique cities such as Alexandria, Egypt, are particularly challenging with narrow streets and small buildings massively connected. Our algorithm sometimes fails separating blocks in between these narrow streets as their width can be smaller than the size of our polygons. Business districts of US cities as Denver or New York is the opposite landscape: buildings are large, tall and fairly separated from each other. Our algorithm typically performs better on such areas. In terms of classification, buildings are globally well detected. One of the main reasons is because we do not rely on a radiometric description of buildings. At the scale of big cities, the radiometric variability of buildings is too high to draw likelihoods. Buildings can be missed when there are not enough elevation estimates. This situation is relatively marginal in practice: a visual comparison between our output
New York City, US Alexandria, Egypt
Seoul, South Korea
Fig. 10. Reconstruction of cities. Our algorithm performs on different types of urban landscapes, including dense downtown (top left), antique city (bottom left), and US downtown (bottom right). Each model was obtained from one stereo pair of satellite images.
3D model of Denver and the building footprints of a cadastral map give us less than 5% of missed buildings and 14% of invalid buildings, ie buildings with at least 20% of their footprints missed or over-detected.
Performance. Timings and complexity of output 3D models are given for different cities in Table 1. Input satellite images have typically around 30Mpixels. Each of the three steps of our method takes a few minutes from a typical stereo pair of satellite images. For very dense cities, fusion is the most time-consuming step as the high den-sity of buildings generates complex cell decompositions. For cities with more space in between the buildings such as New York or Denver, fusion is quite fast. Running times for joint classification and elevation recovery, and polygonal partitioning do not depend on the urban landscape, but on the input image size. Overall, the use of compact and ef-ficient geometric data structures allow us to have very competitive timings with respect to airborne-based methods.
New Yory City, US Denvers, US Seoul, South Korea Alexandria, Egypt Polygonal partitioning 0.5 min 1.0 min 0.8 min 0.5 min Joint classification 2.8 min 4.7 min 3.4 min 2.5 min Fusion 1.5 min 2.8 min 13.7 min 29.2 min Total time 4.8 min 8.5 min 17.9 min 32.2 min Output complexity 0.23M 0.35M 0.89M 1.35M Table 1. Running times and output complexity. The output complexity refers to the number of triangular facets in the output 3D model. Note that the fusion step has been optimized sequentially on each building cluster.
Comparisons. While there is no automatic algorithm producing compact and semantic-aware city models from satellite images, we compared our output models to traditional Digital Surface Models generated from stereo matching, following by structure recov-ery algorithms. As shown in Figure 11, our output model better preserves the building structure while being semantic-aware and compact. We also measure in Figure 12 the geometric accuracy of our method, and compares it with accuracy of an airborne Lidar based algorithm. Although our output is less accurate, the gap is relatively low given the contrast of data accuracy between airborne Lidar and satellite imagery.
DSM DSM + [27] DSM+ [33] ours normal distrib ution (% of the mesh area) 0 ≥ 10
Fig. 11. Comparisons with Digital Surface Models. Traditional DSM derived from stereo match-ing [14] at the pixel scale gives dense and structure-free 3D models. By postprocessmatch-ing a DSM with Voronoi clustering [27] or with structure-aware mesh simplification [33], we obtain more compact meshes, but the building structure cannot be not restored. Our output model is both compact and structure-aware (see the low number of principal directions in the distribution of output normals).
Limitations. Our algorithm has several limitations. First, our output 3D models only contain three semantic labels (ground, roof and facade). The design of our algorithm is, however, flexible enough to account for new urban classes in future works. Second, the limited quality of satellite images makes difficult the reconstruction of small build-ings, typically houses in residential areas. Third, our system is robust to occlusions of
0 ≥ 10
error
(meter)
Ours Airborne Lidar method [3]
Fig. 12. Geometric accuracy. Airborne Lidar scans constitute precise measurements that can be used as Ground Truth to evaluate the geometric accuracy of our outputs (see the distribution of errors on the horizontal histogram). While a state-of-the-art airborne Lidar method [3] produces more accurate results with a lower mean error to Lidar points (0.9m vs 1.7m), the gap is relatively low given the difference of quality between the two types of inputs.
facades, ground and piece of roofs, but cannot handle severe roof occlusions where a roof is only visible in one image. Our LOD1 representation is also less accurate with freeform architectural roofs as domes or peaky structures. In such cases, roofs are ap-proximated by a step-like geometry whose accuracy depends on the amount of elevation estimates.
8
Conclusion
We proposed a full pipeline for producing compact and semantic-aware city models from satellite images. Big cities such as Denver are reconstructed in a few minutes. Our method relies on two key ingredients. First, we reason at the scale of atomic polygons to capture geometry of urban structures while insuring a fast and scalable process. Second, semantics and 3D geometry are retrieved simultaneously to be robust to low resolution and occlusion problems of satellite images. Whereas the quality of our output models is not as accurate as airborne Lidar solutions, our solution outclasses traditional DSM representations, and offers new perspectives in city modeling.
As future work we wish to include more semantic classes into the pipeline, in par-ticular roads and high vegetation. We also would like to investigate the use of geometric regularities at the scale of a district or an entire city as a way to consolidate input data and reinforce the structure-awareness of the models of buildings.
Acknowledgments
This work was supported by Luxcarta. The authors thank Qian-Yi Zhou, Lionel Lau-rore, Justin Hyland, V´eronique Poujade and Fr´ed´eric Trastour for datasets and technical discussions.
References
1. Musialski, P., Wonka, P., Aliaga, D., Wimmer, M., Van Gool, L., Purgathofer, W.: A survey of urban reconstruction. Computer Graphics Forum 32(6) (2013)
2. Poli, D., Caravaggi, I.: 3d modeling of large urban areas with stereo VHR satellite imagery: lessons learned. Natural Hazards 68(1) (2013)
3. Lafarge, F., Mallet, C.: Building large urban environments from unstructured point data. In: ICCV. (2011)
4. Poullis, C., You, S.: Automatic reconstruction of cities from remote sensor data. In: CVPR. (2009)
5. Zhou, Q., Neumann, U.: A streaming framework for seamless building reconstruction from large-scale aerial lidar data. In: CVPR. (2009)
6. Zebedin, L., Bauer, J., Karner, K., Bischof, H.: Fusion of feature- and area-based information for urban buildings modeling from aerial imagery. In: ECCV. (2008)
7. Vanegas, C., Aliaga, D., Benes, B.: Building reconstruction using Manhattan-world gram-mars. In: CVPR. (2010)
8. Verdie, Y., Lafarge, F., Alliez, P.: LOD generation for urban scenes. ACM Transactions on Graphics 34(3) (2015)
9. Zhou, Q.Y., Neumann, U.: 2.5d building modeling by discovering global regularities. In: CVPR. (2012)
10. Haene, C., Zach, C., Cohen, A., Angst, R., Pollefeys, M.: Joint 3D scene reconstruction and class segmentation. In: CVPR. (2013)
11. Lin, H., Gao, J., Zhou, Y., Lu, G., Ye, M., Zhang, C., Liu, L., Yang, R.: Semantic decomposi-tion and reconstrucdecomposi-tion of residential scenes from lidar data. ACM Transacdecomposi-tions on Graphics 32(4) (2013)
12. Cabezas, R., Straub, J., Fisher, J.: Semantically-aware aerial reconstruction from multi-modal data. In: ICCV. (2015)
13. Scharstein, D., Szeliski, R.: A taxonomy and evaluation of dense two-frame stereo corre-spondence algorithms. IJCV 47(1-3) (2002)
14. Hirschmuller, H.: Stereo processing by semiglobal matching and mutual information. PAMI 30(2) (2008)
15. Zitnick, C., Kang, S.: Stereo for image-based rendering using image over-segmentation. IJCV 75(1) (2007)
16. Taguchi, Y., Wilburn, B., Zitnick, C.: Stereo reconstruction with mixed pixels using adaptive over-segmentation. In: CVPR. (2008)
17. Bodis-Szomoru, A., Riemenschneider, H., Van Gool, L.: Fast, approximate piecewise-planar modeling based on sparse structure-from-motion and superpixels. In: CVPR. (2014) 18. Bleyer, M., Rother, C., Kohli, P., Scharstein, D., Sinha, S.: Object stereo - joint stereo
match-ing and object segmentation. In: CVPR. (2011)
19. Ladicky, L., Sturgess, P., Russell, C., Sengupta, S., Bastanlar, Y., Clocksin, W., Torr, P.: Joint optimization for object class segmentation and dense stereo reconstruction. IJCV 100(2) (2012)
20. Bay, H., Ferrari, V., Van Gool, L.: Wide-baseline stereo matching with line segments. In: CVPR. (2005)
21. Zhang, Z., Fidler, S., Waggoner, J., Cao, Y., Dickinson, S., Siskind, J., Wang, S.: Superedge grouping for object localization by combining appearance and shape information. In: CVPR. (2012)
22. Sun, X., Christoudias, M., Fua, P.: Free-shape polygonal object localization. In: ECCV. (2014)
23. Levinshtein, A., Sminchisescu, C., Dickinson, S.: Optimal contour closure by superpixel grouping. In: ECCV. (2010)
24. Gueguen, L., Hamid, R.: Large-scale damage detection using satellite imagery. In: CVPR. (2015)
25. Zheng, E., Wang, K., Dunn, E., Frahm, J.M.: Minimal solvers for 3d geometry from satellite imagery. In: ICCV. (2015)
26. Groger, G., Plumer, L.: Citygml interoperable semantic 3d city models. Journal of Pho-togrammetry and Remote Sensing 71 (2012)
27. Duan, L., Lafarge, F.: Image partitioning into convex polygons. In: CVPR. (2015)
28. Briese, C., Pfeifer, N., Dorninger, P.: Applications of the robust interpolation for dtm deter-mination. In: Photogrammetric Computer Vision. (2002)
29. Hartley, R., Saxena, T.: The cubic rational polynomial camera model. In: Image Understand-ing Workshop. Volume 649. (1997)
30. Boykov, Y., Kolmogorov, V.: An experimental comparison of min-cut/max-flow algorithms for energy minimization in vision. PAMI 26(9) (2004)
31. CGAL. Computational Geometry Algorithms Library. http://www.cgal.org/ 32. GDAL. Geospatial Data Abstraction Library. http://www.gdal.org/
33. Salinas, D., Lafarge, F., Alliez, P.: Structure-Aware Mesh Decimation. Computer Graphics Forum 34(6) (2015)


![Fig. 11. Comparisons with Digital Surface Models. Traditional DSM derived from stereo match- match-ing [14] at the pixel scale gives dense and structure-free 3D models](https://thumb-eu.123doks.com/thumbv2/123doknet/12937988.374751/14.620.48.578.435.601/comparisons-digital-surface-models-traditional-derived-stereo-structure.webp)

