HAL Id: hal-02361011
https://hal.archives-ouvertes.fr/hal-02361011
Submitted on 25 Nov 2019
HAL is a multi-disciplinary open access
archive for the deposit and dissemination of
sci-entific research documents, whether they are
pub-lished or not. The documents may come from
teaching and research institutions in France or
abroad, or from public or private research centers.
L’archive ouverte pluridisciplinaire HAL, est
destinée au dépôt et à la diffusion de documents
scientifiques de niveau recherche, publiés ou non,
émanant des établissements d’enseignement et de
recherche français ou étrangers, des laboratoires
publics ou privés.
subduction-induced subsidence
Frédérique Leclerc, Nathalie Feuillet
To cite this version:
Frédérique Leclerc,
Nathalie Feuillet.
Quaternary coral reef complexes as markers of
long-term subduction-induced subsidence.
Geosphere, Geological Society of America, 2019,
Quaternary coral reef complexes as powerful markers of
long-term subsidence related to deep processes at subduction zones:
Insights from Les Saintes (Guadeloupe, French West Indies)
Frédérique Leclerc*
,†and Nathalie Feuillet*
Institut de Physique du Globe de Paris, Université Sorbonne Paris Cité, Paris Diderot Université UMR 7154, Centre National de la Recherche Scientifique, F-75005 Paris, France
■
ABSTRACT
Geodetic measurements reveal modern rates of tectonic deformation along subduction zones, but the kinematics of long-term deformation are typically poorly constrained. We explore the use of submarine coral reefs as a record of long-term coastal vertical motion in order to determine deformation rate and discuss its origins. The Lesser Antilles arc results from the subduction of the American plates beneath the Caribbean plate and undergoes regional vertical deformation. Uplifted reefs along forearc islands are markers of the interplay be-tween tectonics and sea-level variations since the late Pleistocene. We compared results from a numerical model of reef-island profile development to high-resolu-tion marine geophysical measurements of Les Saintes reef plateau (Guadeloupe, French West Indies), a ~20-km-wide, 250-m-thick submerged platform that lies at 45 m below sea level along the volcanic arc, to constrain its vertical deforma-tion history. Models explore different scenarios over wide parameter domains including start time, basement morphology, sea level variations, reef growth rate, subaerial erosion rate, and vertical motion history. The major features of the plateau (its depth, internal structure, unusual double-barrier) is only repro-duced in a context of subsidence, with a constant rate of −0.3 to −0.45 mm/yr since the late Pleistocene, or in a context of increasing subsidence, presently of ~–0.2 mm/yr. Discussed in the framework of the forearc vertical deformation history, this result indicates subsidence is promoted by local faulting, volcanic, and deep subduction processes. Coseismic deformation accumulation could be a mechanism by which deformation builds up in the long-term. We show that subduction can drive long-term subsidence of a volcanic arc, and demon-strate that submarine reefs are powerful markers of long-term vertical motion.
■
INTRODUCTION
Subduction megathrusts are generally expected to behave elastically over time intervals of years to decades (Savage, 1983). Measurements of surface
deformation above subduction megathrusts using GPS, InSAR (e.g., Chlieh et al., 2004), and coral microatolls (e.g., Zachariasen et al., 2000) are generally consistent with this idea. Along the Sumatra-Andaman megathrust, Indian Ocean, co-, inter-, and post-seismic vertical deformations (called short-term deformation in the following) seem to compensate each other over a few seismic supercycles (Sieh et al., 2008; Philibosian et al., 2017).
But this is not always verified. Instead, the coasts of most active con-verging margins appear to be uplifting (see the review in Pedoja et al., 2014) over several hundreds of thousands of years and more (a time scale termed “long-term” in the following), and many authors are now considering the pos-sibility that megathrust seismic activity can drive short-term deformation that is able to accumulate in the upper-plate (e.g., Taylor et al., 1980, Wesson et al., 2015, and Baker et al., 2013). Other processes that contribute to long-term deformation, which may include subducting seamounts (e.g., Taylor et al., 2005; De Min et al., 2015; Saillard et al., 2011), accretion or erosion processes at the plate interface (e.g., Vannucchi et al., 2013), and upper-plate structures as splay faulting (e.g., Melnick et al., 2012; Wang et al., 2013; Jara-Muñoz et al., 2017), likely influence megathrust mechanical behavior and seismic cycles (Béjar-Pizarro et al., 2013), yet these processes remain poorly understood. One way to improve this situation is to determine the extent, direction, and amplitude of past tectonic movements along subduction zones.
Along active margins, surface features such as alluvial, marine, or reef ter-races are especially valuable as vertical deformation markers (e.g., Saillard et al., 2011; Jara-Muñoz et al., 2015). In tropical areas, Quaternary reef deposits that initially formed offshore can be outcropping on land at several tens to hundreds of meters above sea level (masl), where they form flights of reef terraces along the island coasts. They can be dated and their altitude mea-sured in order to estimate the vertical deformation of the coasts. Along most active margins, such markers are usually rare or they are distributed unevenly. Most of the time, they are only studied on land as they can be identified more easily than offshore (see the worldwide database of such markers in Pedoja et al., 2011), biasing the picture of the deformation along active margins for instance (e.g., Henry et al., 2014).
In this paper, we show that tectonic displacement of shallow-water sub-marine reefs can provide insight into the long-term vertical motion history of subduction zones. We propose a combined methodology to constrain past
GEOSPHERE
GEOSPHERE, v. 15, no. 4 https://doi.org/10.1130/GES02069.1 11 figures; 4 tables; 1 supplemental file CORRESPONDENCE: [email protected] CITATION: Leclerc, F., and Feuillet, N., 2019, Qua-ternary coral reef complexes as powerful markers of long-term subsidence related to deep processes at subduction zones: Insights from Les Saintes (Guade-loupe, French West Indies): Geosphere, v. 15, no. 4, p. 983–1007, https://doi.org/10.1130/GES02069.1. Science Editor: Shanaka de Silva
Guest Associate Editor: David W. Scholl
Published online 5 June 2019 Received 26 September 2018 Revision received 2 January 2019 Accepted 25 March 2019
*E-mail: [email protected]; [email protected]
†Now at Géoazur, Université Nice Sophia Antipolis (Université Côte d’Azur, Centre National de la Recherche Scientifique, Institut de Recherche pour le Développement, Observatoire de la Côte d’Azur), Géoazur UMR 7329, 250 rue Albert Einstein, Sophia Antipolis 06560 Valbonne, France This paper is published under the terms of the
tectonic movements using submarine coral reef morphology and stratigraphy associated with reef growth modeling, applied to Les Saintes volcanic islands, Guadeloupe, French West Indies, in the Lesser Antilles arc.
In the Lesser Antilles, the Caribbean and American plates converge at a rate of only 2 cm/yr (Fig. 1; DeMets et al., 2000). In the Guadeloupe forearc, along the coasts of Marie-Galante, La Désirade, and Grande-Terre islands, quaternary reef deposits are outcropping on land at several tens of masl (Tables 1 and 2). They form flights of reef terraces along the island coasts, surrounding high plateaus formed of Plio–Pleistocene carbonate platform deposits (Andreieff et al., 1989; Cornée et al., 2012; Münch et al., 2014). These geologic evidences indicate the forearc has experienced long-term vertical deformation, during the Plio–Quaternary (e.g., Feuillet et al., 2004; Münch et al., 2014), likely linked to subduction processes (Feuillet et al., 2004; De Min et al., 2015). But the pic-ture of the deformation is incomplete here, in particular along the volcanic arc, to discuss the processes at work. Recent studies have shown that in the Lesser Antilles, the down-dip limit of the seismogenic zone is much deeper and therefore much closer to the volcanic islands than previously thought (Laigle et al., 2013; Weil-Accardo et al., 2016; Paulatto et al., 2017). Therefore, upper-plate deformation could extend farther in the upper-plate, toward the volcanic arc, and needs to be investigated.
Along the coasts of the volcanic islands (Les Saintes and Basse-Terre), no Quaternary reef deposits are found onland (e.g., Vérati et al., 2016, Battis-tini et al., 1986). Offshore, large, submerged reef complexes have developed over the Quaternary (Fig. 1; Macintyre, 1972), along the forearc islands but also along the volcanic arc, and as their counterparts on land, equally retain a record of the islands’ tectonic movements. Les Saintes archipelago partic-ularly exhibits a valuable vertical deformation marker in this tropical area: a drowned reef platform.
Using high-resolution bathymetric data and seismic profiles, we first char-acterize the morphology and stratigraphy of Les Saintes carbonate platform, 280 km away from the trench, where, until now, there have been no estimates of vertical motions. We explore the ways a carbonate platform can gain such morphology and stratigraphy, by investigating in particular the impact of the vertical movements of the coasts. Through extensive reef growth modeling, we explored different scenarios testing the variability of different parameters on the modeled morphology and stratigraphy. These parameters include the start time, the basement morphology (slope and presence of fault scarp) and the sea level variations and their uncertainties that are still debated (e.g., Sid-dall et al., 2007). We also tested over wide ranges, different reef growth rate, subaerial erosion rate, and vertical motion history. We show that the platform acquired its shape and structure in a context of subsidence, and we investigate if and how the subsidence might have changed through time.
This result allows us to complete the pattern of long-term deformation of the Guadeloupe archipelago over the past few hundreds of thousands of years from the forearc to the volcanic arc. We then consider the different mechanisms that could have driven this accumulated deformation over time in Les Saintes, and in the Lesser Antilles arc.
■
MORPHOLOGY AND SEISMIC STRATIGRAPHY OF LES SAINTES
SUBMARINE PLATEAU
Les Saintes archipelago lies between Basse-Terre and Dominica, along the volcanic arc that built since the late Miocene (Jacques and Maury, 1988). Along the coasts of the volcanic islands (Les Saintes and Basse-Terre), no Quaternary reef deposits are found onland (e.g., Vérati et al., 2016 for a recent geological map of Les Saintes, see also Battistini et al., 1986 for a review), except a few
K.S
2 cm/yr
Les
Saintes
St Lucia Ridge Désirade 50 km -59° -60° -61° 16°PRISM
NAM
15º Barracuda R idge Tiburon Rise Marie-Galante C.B.1843
1839
GU ADEL OUPE Grande TerreCAR
17° Ba ck-sto p1946
DOMINICA MARTINIQUE ANTIGUA Basse Terre BARBUDA M o ho -5 0 km -1 00 kmN
Figure 1. Tectonic context of the Guadeloupe archipelago and Les Saintes islands, French West Indies. North American (NAM) and South American (not shown) plates converge toward the Caribbean (CAR) plate at 2 cm/yr (DeMets et al., 2000), generating the Lesser Antilles arc. The forearc islands, capped by Plio–Pleistocene carbonate platforms are mapped in dark gray whereas volcanic islands are in light gray. Submarine coral reef platforms are in orange, with Colombie Bank (C.B.) and Karukera Spur (K.S). Blue lines show back-stop locations estimated from gravity (thick dashed blue line; Bowin, 1976) and seismic studies (dotted thin blue line; Paulatto et al., 2017). Dashed black thin lines are iso-depths of the plate interface and its contact with the over-riding plate’s Moho (Paulatto et al., 2017). The red star shows the epicenter of the Mw>8 1843 earthquake that probably ruptured the plate interface, while gray areas represents the probable rupture extent of the 1843 and 1839 earthquakes (Feuillet et al., 2011a). The white star shows the epicenter of the 21 May 1946 earthquake in front of Martinique (Feuillet et al., 2011a). The active margin is bordered by the up-to 300-km-wide Barbados accretionary prism that is deformed by three subducting ridges Barracuda Ridge, Tiburon Rise, and St. Lucia Ridge (Laigle et al., 2013 and references therein), represented in cyan. Locations of normal faults that accommodate slip partitioning along the plate boundary are indicated (thin black lines, Feuillet et al., 2010).
small deposits that were dragged up by explosive volcanic activity in Basse-Terre, and are therefore non-relevant to this study. Offshore, Les Saintes reef
plateau formed on the remnant of volcanic edifices.
High-resolution bathymetry with a resolution of 10 m/pixel (BATHYSAINTES cruise, Deplus and Feuillet, 2010; see Leclerc et al., 2014, for extensive descrip-tion) and 6-channel seismic reflection profiles from sparker sources (KaShallow cruises, Lebrun, 2009; see Münch et al., 2013 for details on data processing) were acquired on the drowned reef plateau around the Saintes Islands (Fig. 1) allowing morphological and structural studies of the platform.
The bathymetric data show that the reef platform surrounding the Saintes Islands is up to 23 km wide (Figs. 2A, 2B) and has a minimum vertical relief of 250 m (from sea level to the slope break at the base of its cliff, Fig. 2B). The morphology of the reef platform is extensively described in Leclerc et al. (2014) and therefore only summarized in the following. Close to the islands, a small, shallow terrace lies at a mean depth of 25 m below sea level (mbsl, Figs. 2A and 2C). Seaward, the platform forms a plateau that is overall flat and lies between 38 and 60 mbsl, with an average depth of ~45 ± 5 mbsl (Fig. 2). Small NW-SE–striking normal faults crosscut and offset its surface by up to
8 m. They belong to the regional fault system that crosscuts Les Saintes area (Feuillet et al., 2011b; Leclerc et al., 2016).
The plateau displays surface features typical of a reef carbonate platform (Fig. 2A; Leclerc et al., 2014): pinnacles; a barrier reef on the plateau’s edge, including an unusual double barrier to the NE bounding a 0.5–1-km-wide depression. The inner and outer barriers are on average a few meter high above the plateau floor, except where pinnacles developed. This type of dou-ble-barrier forms in particular conditions either where strong currents affect the coral reef (Coudray, 1976) or when reef growth migrates through time from the inner to the outer reef, due to eustatism or tectonics (Andréfouët et al., 2009). Spurs and grooves built behind the double-barrier in the direction of southwestward flowing currents are also present. These features have morphology similar to the ones of modern reefs, and do not show evidence of subaerial erosion. They were built during sea level rise following the Last Glacial Maximum (LGM). They are however presently drowned at ~45 mbsl.
Several seismic profiles were acquired and image the carbonate platform (Figs. 3 and 4). The profiles reveal a stratigraphy composed of seismic units that are stacked vertically and separated by erosion surfaces that naturally dip TABLE 1. DISTRIBUTION AND ALTITUDE OF MIS5 REEF TERRACES
IN THE GUADELOUPE ARCHIPELAGO, FRENCH WEST INDIES Islands Altitude of the terrace
inner-edges (m)
Data type; References
La Désirade
East 10 Dates; Lardeaux et al. (2013)
West 10 Dates; Lardeaux et al. (2013),
Léticée et al. (2019), Battistini et al. (1986), Feuillet et al. (2004)
Marie-Galante
East 10 Dates; Battistini et al. (1986),
Feuillet et al. (2004) West 2–3 Inferred; Battistini et al. (1986),
Feuillet et al. (2004), Bouysse et al. (1993)
Grande-Terre
East (Gros Cap) 5–6 Dates; Battistini et al. (1986) North (Anse Laborde) 3–5 Dates; Battistini et al. (1986) Northwest (Anse Gris-Gris) (30 cm*) Dates; Weil-Accardo (2014) Southwest Not reported on land Battistini et al. (1986) Basse-Terre Not reported on land Battistini et al. (1986) Les Saintes Not reported on land Battistini et al. (1986)
*The MIS5e terrace does not form a morphologic terrace along the western coast of Grande-Terre, no shoreline angle was measured. The MIS5e deposit was found below the mangrove, and a sample recovered at 30 cm was dated.
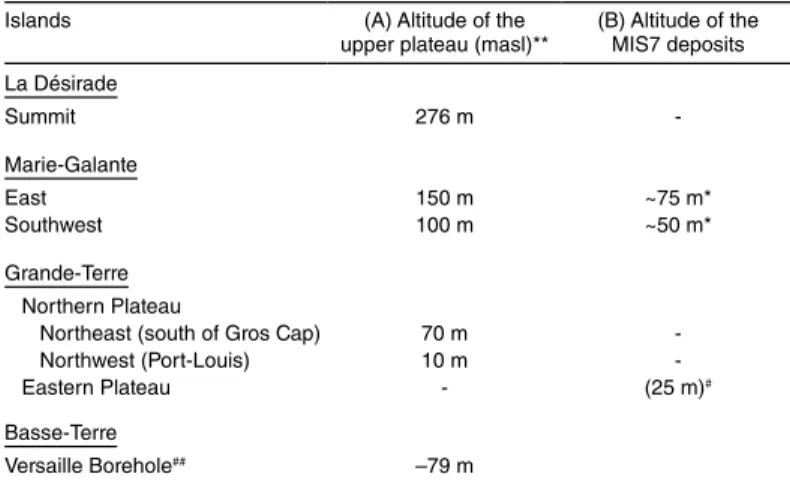
TABLE 2. DISTRIBUTION AND ALTITUDE OF (A) THE UPPER PLATEAUS OF THE GUADELOUPEAN FOREARC ISLANDS, FRENCH WEST INDIES
AND (B) OF THE REEF DEPOSITS OF PROBABLE MIS7 AGE
Islands (A) Altitude of the
upper plateau (masl)** (B) Altitude of the MIS7 deposits La Désirade Summit 276 m -Marie-Galante East 150 m ~75 m* Southwest 100 m ~50 m* Grande-Terre Northern Plateau
Northeast (south of Gros Cap) 70 m
-Northwest (Port-Louis) 10 m
-Eastern Plateau - (25 m)#
Basse-Terre
Versaille Borehole## –79 m
*Villemant and Feuillet (2003) dated several samples from terrace T2, and applied an open-system model that gives an age of 249 ± 8 ka for this terrace (MIS7.5).
**Altitude of the upper plateaus, measured far from faults, or corrected from fault induced offset and elastic flexure when possible (Feuillet et al., 2004).
#Villemant and Feuillet (2003) dated one sample at Pointe des Chateaux, found at 25 m, by U-Th method. This altitude is not a shoreline angle, that must be equal or higher. Without age-model correction, it gives an age of 277 ± 11 ka. Feuillet et al. (2004) propose that it formed at the same time as T2, the sample age being older as not corrected with an open-system model.
##Garrabé and Paulin, 1984. masl—meters above sea level.
−61˚35'
−61˚40'
−61˚30'
15˚50'
15˚55'
2 km
Spurs and Grooves
C
D
E
Beachrocks
−200 −60 −50 −45
−30
−15 0
Double barrier
Normal faults
Shallow terr
ace
Pinnacles
N
Roseau Fault
Les Saintes
A
B
Depth(m)
10 km
20 km
-300
0
300
200
100
-100
-200
A
B
TdB
TdH
2
4
6
8
10
12
-150
-100
-50
0
C
D
E
Elevation (m)
Elevation (m)
Distance (km)
Distance (km)
Shallow
terrace
Plateau (~45 m bsl)
Reef barrier
-39 m
-25 m
-250 m
TdB
TdH
TdB
TdH
A
B
C
Figure 2. Morphology of Les Saintes plateau, Guadeloupe, French West Indies. (A) Bathymetry and (B, C) bathymetric profiles of the reef platform of Les Saintes archipelago, AB and CDE located on (A). The platform displays a fringing reef (in red shades in 2A, with depth >15 mbsl), a shallow terrace at ~25 mbsl (in orange to yellow shades in 2A), and a wide plateau drowned at ~45 mbsl (see text for description, and Leclerc et al., 2014). Vertical gray line in (C) marks the kink in the transect CDE located on the map. TdB—Terre de Bas Island; TdH—Terre de Haut Island.
seaward (Figs. 3 and 4). This structure is typical of reef platforms that have accreted as accommodation space is created by subsidence and/or erosion (Rooney et al., 2008). This is particularly visible on the profile K08_71b that is perpendicular to the fault system (Figs. 4A, 4B), but also on the two radial profiles K08_67 and K08_69 (Figs. 3, 4C, and 4D). Under the uppermost Seismic Unit 1 (SU1) that is composed of the reef features evidenced in the bathymetry, we identify three other sedimentary packages (SU2, SU3, and SU4) whose tops and bottoms are marked by strong reflectors (R1, R2, and R3; Figs. 3, 4C, and 4D). The inner reflectors of SU2 toplap R1, whereas those of SU1 onlap R1 (Fig. 3). Similarly, the inner reflectors of SU3 toplap R2, whereas those of SU2 onlap R2 (Figs. 3, 4D, and 4C). This architecture indicates periods of sea level drop and erosion (forming R1 and R2), followed by transgressions (Fig. 3). The geometric relation of reflector R3 and inner reflectors of SU3 and SU4 are less clear in the seismic profiles. All reflectors R1, R2, and R3 are dipping seaward, and are close to merge landward (Fig. 3). The seismic stratigraphy provides evidence for single or double barrier reef morphology along the plateau’s edge above R3, suggesting that SU2 and SU3 are also constituted by reef units built on the plateau’s edge. Landward, these seismic units present parallel reflectors that can be associated to back-reef and lagoonal sedimentation.
To quantify seismic units’ depth and thickness, seismic travel times were converted to depth assuming a wave velocity of 1500 m/s through the water column. In carbonates, seismic wave velocities have shown to be scattered between 1500 and 6500 m/s (Anselmetti and Eberli, 2001; Camoin et al., 2007), and do not increase systematically with depth (Anselmetti and Eberli, 1993), the last-deglacial carbonate sequence showing smaller Vp than the older Pleisto-cene sequence (Camoin et al., 2007). Taking into account this scattering and its nature, and the fact that in the following we only determine shallow features’ depth and thickness, systematically away from fore-reef structures (that present
higher velocities), but in back-reef environments, we chose to calculate the depth of seismic reflectors by using low seismic velocities, ranging between 1500 and 3000 m/s in the platform.
Along the seismic profiles, close to the island coast and under the back-reef area of SU1, the shallowest reflector lies at a depth ZR1 of 0.06 s two-way travel time (TWTT) (Fig. 3), composed of 0.05 s TWTT in water and 0.01 s TWTT in carbonates.
By using a velocity of 1500 m/s in water and a velocity ranging from 1500 to 3000 m/s in carbonates, the reflector R1 reaches a minimum depth ZR1 of 49 ± 4 mbsl.
Along the seismic profile K08_67b (Fig. 3), we can notice the three reflectors R1, R2, and R3 deepen seaward. Within the domain bracketed by the cliff of the 25 mbsl terrace, and the reef barrier, we estimated the depths of the three re-flectors R1, R2, and R3 at three locations along the profiles: kilometer 2, 5, and 8. Reflector R1 deepens from 0.069 s TWTT landward (at kilometer 2), to 0.08 s TWTT (at kilometer 8) and reflector R2 deepens from 0.069 to 0.093 s TWTT (at kilometer 2 and 8, respectively). Reflector R3 is less easy to follow, but it seems to deepen too, from 0.101 to 0.105 s TWTT (at kilometer 5 and 8, respectively). By using the velocity values discussed above, we can estimate that the three reflectors R1, R2, and R3 lie between 52 and 71 mbsl, 63–90 mbsl, and 76–109 mbsl, respectively.
■
REEF GROWTH MODEL METHODOLOGY
To determine the conditions of vertical coastal movement compatible with these morphologic and stratigraphic observations, we turn to a numerical model of reef growth.
Landward
Seaward
-50 M Toplaps 1 km Onlap K08_67b 1 0.5 1.5 Remnant barriers? Toplaps First multiple Double barrierTwo way time (0.1*s)
1 0.5
1.5
Two way time (0.1*s)
R2 R1 R3 SU1 SU2 SU3 SU4 2 3 4 5 6 7 8 9 10 11 12 13 Distance (km) SE NW ZR1=0.06s TWTT
?
A
B
Figure 3. (A) Seismic data and (B) inter-pretation of the 6-channel seismic profile K08_67b, modified from Leclerc et al. (2014). Inset shows the location of the profile on Les Saintes plateau, Guadeloupe, French West Indies. High-amplitude reflectors marked R1, R2, and R3, separate the four seismic units SU1, SU2, SU3, and SU4, col-ored in light to dark gray. Inner reflectors (dashed gray lines ended by arrows) toplap or onlap the surfaces R1, R2, and R3. TWTT— two-way travel time.
? ? ? 1 km 20 m Vw=1500 m/s 20 mV=2000 m/s West East Onlaps K08_69 SU2 SU3 SU4 0.05 0.1 0.15 0.05 0.1 0.15 SU1 0.5 1 1.5 2 2.5 3 R3 R2 R1 0.1 0.5 1 1.5 CDP x 102 3 2.5 3 3.5 4
Two way travel time (s)
0.02 SW NE K08_71 0.1 0.02 First Multiple R2 R1 ? ? SU1 SU2 SU3 SU4 15 m Vwater=1500 m/s 2 km 15mV=2000 m/s R3 R3 R2 R3 First Multiple
Two way travel time (s)
-50 m 69 71
A
B
C
D
Figure 4. (A) Seismic data and (B) interpretations of profile K08_71. (C) Seismic data and (D) inter-pretations of profile K08_69. Same as Figure 3. Inset shows the location of the profile on Les Saintes plateau, Guadeloupe, French West Indies.
Description of the Model
Numerical experiments used a simple 2-D reef-profile model, adapted from Toomey et al. (2013) where the model is described in detail. The model domain consists of an initial linear island slope (Fig. 5) that is then shaped by reef growth (G), island vertical motion (U), wave erosion and sediment transport, subaerial erosion (E). Changes in sea level occur at 50 year intervals and the model simulation spans a certain period of time starting from an initial time (T0). Vertical motion rate (U>0 for uplift, U<0 for subsidence) is fixed across the entire model domain, while subaerial erosion (E>0) is applied to parts of the model that are standing above the sea. Vertical reef accretion (G) is simu-lated using Bosscher and Schlager’s (1992) parameterization of coral growth as a declining function of water depth and light attenuation, as described in Toomey et al. (2013). Reef accretion and wave erosion only occur between the reef’s seaward edge and a point 200 m landward of the reef crest, with wave erosion occurring only when the reef surface is within 2 m of the sea surface. Sediment generated by wave erosion of the reef is deposited either within the lagoon if one exists, or offshore, on the reef front, at the angle of repose. Primary production of carbonate sediment in the water column also occurs in the lagoon at a fixed rate (0.2 m/k.y., Zinke et al., 2001).
On the basis of the morphological analyses and seismic reflection data of Les Saintes plateau, we consider a model good, and therefore a param-eter combination satisfying, when the model generates a set of constraints: a fringing reef, a plateau drowned at 45 ± 5 mbsl, and an internal structure composed of vertically stacked units, with the shallower surface of erosion reaching a depth landward of 49 ± 4 mbsl (equivalent to the depth of ZR1 close to the coast, and named in the models ZE1, Fig. 5).
Free Variables for Les Saintes Simulations
Little is known about the values of certain parameters to be applied in order to reproduce Les Saintes plateau morphology, and to constrain the vertical motion rate that is our main unknown parameter. To counterbalance this, we carried out sensitivity tests on these free variables: age and bathymetry of the initial condition (T0 and slope), sea level history, maximum reef growth rate, subaerial erosion rate, all of them are described below (see also Table 3 that sums up variables names). We changed the value of one parameter at a time, over a wide range, and explored the model results in order to reproduce Les Saintes plateau morphology and to estimate vertical motion rate with the least prejudice.
Start Time T
0Les Saintes reef plateau formed on the remnant of volcanic edifices that are several Ma old. The youngest volcanic edifices are dated at 600 ka (Jacques and
Maury, 1988), revised recently at 800 ka (Zami et al., 2014). Reef construction might have started along the submarine volcanic slopes at shallow depth as soon as substrates were adequate for coral growth, but we lack constraints on this start time in Les Saintes, such as dates or seismic stratigraphy of the plateau deeper than 100 mbsl.
In the Lesser Antilles, Adey et al. (1977) noticed that reefs are poorly devel-oped along the slopes of active volcanoes (also evidenced in Martinique on the basis of shallow bathymetric data; Leclerc et al., 2015). Volcanic activity induces acidic and turbid waters as well as poorly consolidated slopes that do not favor reef growth (Adey and Burke, 1976; Adey et al., 1977). Therefore, a time delay can exist between the arrest of the volcanic activity and the settlement of reefs.
Vertical motion U
Sea level variation Reef growth rate G Vertical Subaerial Erosion rate E Initial slope Basement Depth of the plateau
Z
E1Erosion surface
Wave erosion of Reef crest
Primary production & product of erosion
Lagoon sedimentation
TABLE 3. LIST AND VALUES OF PARAMETERS USED IN THE REEF GROWTH MODEL
Name Significance and units Tested values G Reef growth rate (m/k.y.) 0.5 to 10, every 0.5 U Vertical motion (m/k.y.) 0 to –0.8, every 0.05 E Subaerial erosion rate (m/k.y.) 0 to 0.15, every 0.05 T0 Start time of the model (ka) 600–400–330 ZR1 Depth of the shallowest reflector interpreted
as a surface of erosion 45 to 71 mbsl ZE1 Depth of the shallowest modeled surface of
erosion, at its intersection with basement See Figure 7 Note: mbsl—meters below sea level
Figure 5. Conceptual sketch of the reef growth model we used to reproduce the morphology of Les Saintes plateau, Guadeloupe, French West Indies. See main text and Toomey et al. (2013) for full description of the model.
Thus, we focused our models on reasonable start times that postdate the end of volcanic activity. We set T0 at 600 ka, 400 ka, and 330 ka. Our choice is also motivated by the fact that if we assume a constant vertical motion story, the older the start time T0 the thicker the modeled plateau, exceeding 250 m in thickness. In the following, we test different T0 in order to quantify and dis-cuss the sensitivity to this parameter on the vertical motion rates needed to reproduce Les Saintes plateau morphology and stratigraphy.
Initial Bathymetry: Slope and Fault
It has been shown that basement morphology can influence the morphol-ogy of the carbonate platform, offering a wider or thinner surface on which the reef can develop (Cabioch, 2003). We therefore tested the influence of the initial basement shape on reef construction. The islands in the Saintes archipelago are the remnants of ancient volcanoes. We consequently hy-pothesized the shape of the volcanic construction prior to platform growth to be conical (or linear along a transect) like modern subaerial or submarine active volcanoes (see for example the nearby submarine Colibri volcano, in the Les Saintes channel in Leclerc et al. (2016)). A batch of models was run with this linear slope, for two initial slope values, 0.075 m/m and 0.02 m/m, which would correspond, respectively, to the western and eastern slope of the islands, calculated between the coast and the slope break at ~250 mbsl. We also ran models that take into account the fact that the mod-ern Les Saintes plateau is offset by small normal faults. These faults have 5–8-m-high scarps on the plateau, whereas they can have scarps up to 50 m high southward, in the Saintes Trough (Leclerc et al., 2016, see Marigot and Pompierre faults). This system initiated after the main volcanic construction in the area, and faulting has certainly offset the volcanic slopes of the Les Saintes volcanic edifice prior to reef settlement. To understand how faulting has influenced platform development and morphology, we ran a model for an initial slope of 0.02 that is offset in its middle by a 20-m-high scarp, and in another batch by a 40-m-high scarp. Slip rate on these faults is probably only a few tenths of a meter per k.y. (or tenths of mm/yr, Leclerc et al., 2016). Consequently, we did not model the fault activity during the reef accretion, as fault slip rate is one order of magnitude slower than the reef accretion rate (discussed below).
Sea-Level History
Over the past few hundreds of thousands of years, the sea level has varied in relation with climate, being low during glacial periods (~120 mbsl, during LGM, ~20 k.y. ago), and high during interglacial periods as today. For the last 500 k.y., independent proxies have allowed to document the sea level varia-tions through time (e.g., Rohling et al., 2014). But due to the proxies’ nature and sampling locations, large variations for a single sea level highstand exist
in the different data sets (e.g., Siddall et al., 2007), uncertainties increasing with age. During the last interglacial period (ca. 125 ka), called MIS5e, the sea level was higher than today, and several authors estimate it peaked at ~5–6 masl, and might have exceeded 8 m (Kopp et al., 2009) or even 9 masl (Dutton and Lambeck, 2012). Siddall et al. (2007) reviewed the constrains on the sea level for the last interglacials. The sea level during MIS7a (193–201 ka), and also during MIS7c and MIS7e, probably reached an altitude between −5 and −15 m. During MIS9c, the sea level highstand occurred 331 ka, and might have reached −3 to +8 m (Schellman and Radtke, 2004). The estimation of MIS11 highstand sea level is also uncertain. This sea level highstand occurred between 398 and 410 ka ago, and its altitude is estimated to be close to the present sea level, within ± 10 m. Considering the older highstands, they have probably been lower than the present sea, and certainly not higher.
Here, three batches of experiments were performed with different sea level curves (Fig. 6): (1) the sea-level curve of Waelbroeck et al. (2002), starting the model at 400 ka; (2) the sea-level curve of Waelbroeck et al. (2002) between 0 and 430 ka, and that of Shakun et al. (2015) between 430 and 600 ka (named sea level curve “W+S”); (3) the sea level curve of Cutler et al. (2003) since 600 ka, modified with the sea level of Khan et al. (2017) determined from Caribbean data for the last 8 k.y. (named sea level curve “C+K”).
The three curves particularly take into account the fact that no sea level highstand is observed in the Caribbean during the Holocene. The different curves consider a MIS5e sea level at 6 m (Cutler et al., 2003, and Waelbroeck et al., 2002, respectively), which is close to the lowest sea level peak deter-mined by Kopp et al. (2009). The curves also exhibit variabilities for the older sea level highstands (Siddall et al., 2007). The peaks altitudes differ by 5 m for MIS7b, 6 m for MIS9c, 11 m for MIS11, and 10–25 m for MIS15. Therefore, the different results of the models obtained with these three different curves
600 -60 0 100 0 -140 -20 -100 -40 400 -80 300 20 -160 500 -120 200
Waelbroeck et al., 2002 Shakun et al., 2015 Cutler et al., 2003 Khan et al., 2017 Elevation (m) MIS11 MIS13 MIS15 Age (ka) W+S C+K 7a MIS5e 5c 5a 7c 7e 9a MIS9c T0 =600ka T0 =400ka MIS1
Figure 6. Sea-level curves used and tested by the reef growth models. See main text for description.
will describe the vertical motion history of Les Saintes in a most conserva-tive way, taking into account sea level uncertainties. They are discussed in the Results section.
Maximum Reef Growth Rate (G)
During the last transgression, reef accretion rate primarily determined whether a reef was able to keep growing with sea level rise (keep-up trajectory), to follow partially the sea level rise by retrograding along the coast (catch-up mode) or to be drowned (give-up growth trajectory, Neumann, 1985). Dullo (2005) reviewed the coral and Holocene reef growth rates measured in the Caribbean, and showed that the latter span 0.7–15.2 m/k.y., with an average rate of 6.1 m/k.y. (Dullo, 2005). The reef growth rate variability is greatly influenced by local hydrodynamic effects that influence for instance the dis-tribution and development of coral species, and the erosion of the reef (see e.g., Barrett and Webster, 2017). Therefore, modeling the growth and mor-phology of the entire Les Saintes plateau with a high (>10 mm/yr) maximum reef growth rate is unrealistic. Recent considerations on the dependency of reef growth rate on water-depth also led several authors to review the Holo-cene reef growth rate in the Caribbean (Gischler, 2008; Hubbard, 2009) and found most of their measures fall below 4 m/k.y. Regarding these results, we used and tested maximum reef accretion rates between 0.5 and 10 m/k.y. in increments of 0.5 m/k.y.
Vertical Subaerial Erosion Rate (E)
Estimating a vertical subaerial erosion rate is not straightforward. Few studies present weathering or karst erosion rates, and the few measurements that exist are not easy to link to vertical subaerial erosion rate. On Grand Cay-man, Cayman Islands, Spencer (1985) used micro-erosion meters to measure weathering rates of the Pleistocene outcropping reef, and found a rate spanning 0.09–0.62 m/k.y. In northern Florida, USA, Opdyke et al. (1984) estimated a karst erosion rate from spring and seepage of CaCO3 to be between 0.026 and 0.08 m/k.y. These rates are of the same order of magnitude as subsidence rates discussed in the following section. Vertical subaerial erosion must therefore be taken into account in our models, and was added to the model presented in Toomey et al. (2013).
In the Guadeloupe archipelago, the MIS5e reef deposit outcrops on Ma-rie-Galante and Grande-Terre islands are just 20 km east and northeast of Les Saintes archipelago (Battistini et al., 1986; Feuillet et al., 2004). The preservation of MIS5e and older Pleistocene terraces suggests quite low subaerial erosion rates. Consequently, models were run with reasonable values ranging between 0 and 0.15 m/k.y. in increments of 0.05 m/k.y., in agreement with the lower range of Grand Cayman weathering rates (Spencer, 1985) and with northern Florida karstic erosion rates (Opdyke et al., 1984).
Methodology to Constrain the Vertical Motion Rate (U)
In order to explore and constrain the vertical motion history of Les Saintes, two different sets of models were designed and run: the 2-D model with con-stant vertical motion rate, and the model in its 1-D version with time-varying vertical motion rate.
In details, at first, we considered the simple assumption that vertical motion rate (U) is constant through time. Scenarios with a vertical motion positive (i.e., uplift) were tested, producing models with a morphology resembling the ones of uplifting islands, exhibiting staircase of fossil or erosive terraces (see Koelling et al., 2009, and Toomey et al., 2013 for several examples). However, on Les Saintes Islands, neither reef terraces nor erosion terraces are found onland. Even the well-developed MIS5e terrace found on the other islands of the archipelago (Table 1) is not outcropping. This indicates that the deforma-tion is either of subsidence, or that no or slow deformadeforma-tion is accumulating and counterbalanced by a high subaerial erosion rate that would have washed away the reef deposits.
In this paper, we therefore only show results for values of U varied between 0 and −0.8 m/k.y. in increments of 0.05 m/k.y. (refer to Koelling et al., 2009, and Toomey et al., 2013, for examples of models obtained with positive values of U). We ran more than 4000 models that generated synthetic reef morphology and stratigraphy, for different subaerial erosion rate, maximum reef growth rate, vertical motion rate, sea level history, basement shape, and start time, as described above. We analyzed every model outcome in order to identify the parameter combinations that generate the closest match to Les Saintes plateau. We extracted from the models the depths of the plateau and of the shallower surface of erosion (ZE1), in order to represent graphically the results over the model domain (e.g., Fig. 7). Results are described in the next section. Second, we explored if and how the vertical motion rates can have varied through time in Les Saintes. In these tests, we used the model in its 1-D ver-sion, equivalent to model synthetic cores. They reproduce the reef stratigra-phy taking into account reef growth (2.5, 5, and 7.5 m/k.y.), subaerial erosion (0.05 m/k.y.), the sea level history (“W+S”), a start time (T0 = 330 ka), an initial basement depth (z0 tested at 0, 75, and 150 mbsl), and a subsidence rate that can vary through time, U = f(t). We tested 3 scenarios: (1) subsidence is constant through time (to compare and validate our approach with the 2-D models); (2) subsidence rate increases through time; (3) subsidence rate decreases through time. Linear and quadratic subsidence variations were tested. Results are presented in the last section of the following part.
■
RESULTS
With a constant vertical motion rate, we explored the model outputs ob-tained for different parameter settings described above. At first, we only tried to reproduce the morphology of Les Saintes plateau, composed of a fringing reef and a drowned plateau.
-0.2 -0.3 -0.4 -0.5 2 -30 m -32 m -34 m -36 m -38 m -40 m -42 m -44 m -46 m -48 m -50 m -52 m -54 m -56 m -58 m -60 m
Z
E1-38
-44
-50
-55
Ver tical M otion U (m/k .y .)Maximum Reef Growth rate G (m/k.y.) -0.2 -0.3 -0.4 -0.5
-26
-34
-43
-49
-55
-62
-37
-43
-49
-54
-61
-67
3 4 5 6 7-36
-42
-48
-54
-60
Z
E1Z
E1Z
E1Z
E1Z
E1Z
E1Z
E1Z
E1Z
E1Z
E1Z
E1Elevation of the plateau (m)
-20
-25
-31
-38
-44
-50
-55
-24
-31
-37
-43
-49
-56
-62
-31
-37
-43
-49
-55
-61
-67
-36
-42
-49
-54
-60
-66
-72
-19
-25
-30
-37
-42
-49
-55
-24
-30
-36
-42
-48
-54
-60
-29
-35
-41
-47
-53
-59
-65
-34
-40
-46
-52
-59
-64
-70
T
0= 400 ka
Sea level : Waelbroeck et al., 2002
Sea level : W+S
T
0= 600 ka
Sea level : C+K
T
0= 600 ka
E=0.0
m/k.y
.
E=0.05
m/k.y
.
E=0.1
m/k.y
.
E=0.1
5
m/k.y
.
U -0.2 -0.3 -0.4 -0.5 U -0.2 -0.3 -0.4 -0.5 U -0.2 -0.3 -0.4 -0.5 U -0.2 -0.3 -0.4 -0.5 U -0.2 -0.3 -0.4 -0.5 U -0.2 -0.3 -0.4 -0.5 U G 2 3 4 5 6 7 G 2 3 4 5 6 7 2 3 4 5 6 7 G 2 3 4 5 6 7G 2 3 4 5 6 7 G 2 3 4 5 6 7 G 2 3 4 5 6 7 G 2 3 4 5 6 7G 2 3 4 5 6 7 G 2 3 4 5 6 7 G 2 3 4 5 6 7 G -0.2 -0.3 -0.4 -0.5 U -0.2 -0.3 -0.4 -0.5 U -0.2 -0.3 -0.4 -0.5 U -0.2 -0.3 -0.4 -0.5 UA
B
C
D
E
F
G
H
I
J
K
L
Figure 7. Variation of the elevation of the modeled plateau for different sets of parameters. For each plot, depth of the plateau is represented in color with regards to subsidence (U) and reef growth rate (G). Depths fitting with Les Saintes plateau are outlined in black, and depths of the shallower surface of erosion (ZE1) are indicated on the side. Columns: models run for different values of initiation time T0, and for different sea level curves. Rows:
models run for different values of subaerial erosion rates. Open white circles indicate models that present a double reef barrier along the seaward edge of the plateau. W+S—Waelbroeck et al., 2002, and Shakun et al., 2015; C+K—Cutler et al., 2003, and Khan et al., 2017.
Modeling the Saintes Morphology
The morphology of the models mainly depends on the combination of two parameters: the reef growth rate G, and the subsidence rate U.
For a combination of slow reef growth (about G<2.5 m/k.y.) and high subsidence rates (about U<–0.4 m/k.y.), the model produces a series of sub-marine reef terraces, looking like a drowned flight of stairs. In such a setting, the reefs are not able to keep up with relative sea-level rise through time, and give up quickly (see Supplemental Material1 for examples, Fig. S1A). For a combination of high reef growth rates (about G>6.5 m/k.y.) and slow sub-sidence (about U>–0.25), the model produces wide carbonate platforms that form plateaus similar to Les Saintes. However, they are systematically lying at present sea level (0 m), and not drowned at 45 ± 5 mbsl (Fig. S1B). In this second setting, reef growth rates are high enough for reefs to keep up with relative sea level rise. Finally, for a combination of low reef growth and low subsidence, moderate reef growth and moderate subsidence, or high reef growth and high subsidence, the model reproduces a morphology close to that of Les Saintes: a drowned plateau generally associated with a fringing reef. Consequently, over the entire parameter domains, only a third of the models reproduced the “catch-up” morphology of the Saintes carbonate platform that we intend to compare to our bathymetry data (examples are shown in Figs. 8 and 9).
Figure 7 presents the compilation of the sensitivity tests carried out on different parameters, for a basement slope of 0.02 m/m. The models that were producing a fringing reef and a drowned plateau are represented in colored squares; color scale showing the depth of the drowned plateau (as indicated on Fig. 5). Next to each plot, a table indicates the depth of the first modeled surface of erosion at its intersection with the basement, marked ZE1 (indicated on Fig. 5) that will be compared with ZR1, the depth of the reflector R1 (Fig. 3), close to the land, in a following section. Finally, open white dots are super-imposed on the grid if the model output presents a double reef barrier along the seaward edge of the plateau (Fig. 7).
For combinations of reef growth and subsidence rates, the same trend is verified with the different vertical subaerial rates (Fig. 7, each row corre-sponds to a different erosion rate) as well as with the different start time (T0 = 400 ka in Figs. 7A–7D else T0 = 600 ka) and sea level curves used (Waelbroeck et al., 2002 in Figs. 7A–7D, “W+S” in Figs. 7E–7H, and “C+K” in Figs. 7I–7L).
Among these models, only a few can reproduce a plateau drowned at 45 ± 5 mbsl (framed by black boxes in Fig. 7), the subsidence values span −0.2 to −0.45 m/k.y.
Sensitivity Tests Analyses and Influence on the Vertical Motion Rate
Variability exists among the different models, depending on the param-eter setting.
Variability from Vertical Subaerial Erosion Rate
For any of the start times and sea level curves used, the vertical subaerial erosion rate influences the result as such: the more accommodation space is created by subaerial erosion during sea-level lowstands, the less subsidence is needed to model a drowned plateau. For E = 0 m/k.y., closest-matches are modeled for −0.45<U<–0.30 m/k.y. (Figs. 7A, 7E, and 7I), while for E = 0.15 m/k.y., closest matches are obtained for −0.4<U<–0.2 m/k.y. (Figs. 7D, 7H, and 7L).
Variability from the Start Time T
0A discrepancy is also seen when the models are starting at 400 ka (Figs. 7A– 7D) or 600 ka (Figs. 7E–7L). If the model starts just before a high sea level highstand (as for T0 = 600 ka), the model will produce an aggrading deposit that can gain rapidly the shape of a plateau (see Fig. 9A, the deep brown iso-chrones have the shape of the plateau). Once this plateau shape is reached, the following deposits develop as flat units that stack vertically, and preserve the plateau shape of the carbonate platform.
On the contrary, if the model starts during a sea level drop (as for T0 = 400 ka), prograding deposits will form along the coast, as a staircase (see the brown deposits in Fig. 9C). From then, younger deposits will grow, aggrading and prograding (red to blue isochrones, Fig. 9C), to gain the shape of a plateau (see the dark blue and purple deposits, Fig. 9C). When a staircase morphology exists and persists, a double reef barrier can form along the seaward edge of the plateau (Fig. 9C; Fig. S2 [see footnote 1]). During the sea level rise following a sea level drop, reef built on the lower stair can keep up with sea level and form an outer barrier, while reef also develop on the upper stair and can form an inner barrier. Once both inner and outer barriers reach the same elevation, the reef gets a plateau shape.
Several hundreds of thousands of years can be needed for the reef to gain a plateau shape. On the entire model domain, when the start time is fixed at 600 ka (MIS15), the modeled platform usually gets a plateau shape very early (at 570 ka, as in Fig. 9A) or by maximum 400 ka. For models started at 400 ka, the plateau shape is reached only during MIS5. Therefore, on the entire model domain, for T0 = 400 ka, the couples of reef growth rate and subsidence rate able to produce the morphology of a drowned plateau are fewer (Figs. 7A–7C to compare with Figs. 7E–7J) but, the models presenting a double barrier are more numerous than for models started at 600 ka. The double barriers form when a stair exists in the morphology, and with reef growth rate high enough (>4.5 m/k.y.) for the reef on the lower stair to keep up with sea level rise. Fig-ure 7 shows that for T0 = 600 ka, high erosion rate seems to be a requirement to promote double barrier development, and must modify enough of the morphology of the platform along its seaward edge to favor double barrier development (Figs. 7G, 7H).
For any T0, the different models reproduce the same highest bound of sub-sidence rates: −0.45 m/k.y. for E = 0 m/k.y. (Figs. 7A, 7E, and 7I) and E = 0.05 1 Supplemental Figures. Showing additional results
obtained with the reef growth models. Please visit https://doi.org/10.1130/GES02069.S1 or access the full-text article on www.gsapubs.org to view the Sup-plemental Figures.
m/k.y. (Figs. 7B, 7F, and 7J), −0.4 m/k.y. for E = 0.1 m/k.y. (Figs. 7C, 7G, and 7K) and –0.35 m/k.y. for E = 0.015 m/k.y. (Figs. 7D, 7H, and 7L).
Variability from Sea Level History
When all parameters are equal except the sea level curve, we can notice that models run with the composite sea level curve W+S (Figs. 7E–7H) produces overall good models for the same range of reef growth rates and subsidence rates than the models run with the composite sea level curve C+K (Figs. 7I–7L). A slight difference exists though; models produced with W+S curve can match the plateau’s depth for smaller values of reef growth rates and subsidence rates. This is probably due to the fact that during the MIS7, MIS9c, and MIS11 the sea level is slightly higher in the W+S curve than in the C+K curve (Fig. 6). Therefore, less accommodation space is created during glacial periods when
using the W+S curve, and the reef is better able to keep up with relative sea level rise during interglacial periods as the base level is higher.
These slight differences in rates of sea level change, and peaks of sea level during interglacial periods between the two curves used do also influence the presence or absence of double barriers, as the models run with the curve W+S generate a few models presenting double barrier along their seaward edge, while models run with the curve C+K do not.
Influence of the Basement Morphology
Basement morphology can influence the growth and therefore the mor-phology of a reef carbonate platform, as it offers for the reef to develop wider or narrower surfaces (Cabioch, 2003). We tested the influence of the basement slope and shape on the reef models.
Models were run with two basement slopes of 0.02, and of 0.075, similar to the eastern and northwestern basement slope of Les Saintes plateau, respec-tively. We explored the different parameters in the model domain in order to reproduce the morphology of Les Saintes plateau. We found overall similar results: the model reproduces Les Saintes plateau’s depth for intermediate values of reef growth rates and subsidence rates for both slope values.
In details though, for steeper basement, the model reproduces the pla-teau’s depth for narrower ranges of reef growth and subsidence rates. Figure S3 (footnote 1) presents for instance a comparison of the model outcomes run with different slopes (slope of 0.02: Figs. S3A–S3D; slope of 0.075: Figs. S3E–S3H), during the last 600 k.y. with the sea level curve W+S, for different subaerial erosion rates. For a slope of 0.02, the models fitting Les Saintes pla-teaus’ depth are obtained for reef growth rates G that spans 2–7.5 m/k.y. and subsidence rates between –0.2 and –0.45 m/k.y., while for a steeper slope of 0.075, G spans 2.5–7 m/k.y. and U spans –0.25 to –0.45 m/k.y.
We tested the influence of the presence of a scarp in the basement, in order to take into account the fault system that crosscuts Les Saintes plateau,
0 5 10 15 20 −300 −200 −100 0 Distance(km) Elevation(m) No scarp U (m/k.y .) G (m/k.y.) -0.2 -0.3 -0.4 -0.5 2 3 4 5 6 7 No Scarp 0 5 10 15 20 −300 −200 −100 0 Distance(km) Elevation(m) Scarp : 20 m high 20 m high Scarp U G -0.2 -0.3 -0.4 -0.5 2 3 4 5 6 7 0 5 10 15 20 −300 −200 −100 0 Distance(km) Elevation(m) -30 m -32 m -34 m -36 m -38 m -40 m -42 m -44 m -46 m -48 m -50 m -52 m -54 m -56 m -58 m -60 m Elevation of the plateau (m)
40 m high Scarp U G -0.2 -0.3 -0.4 -0.5 2 3 4 5 6 7 Scarp : 40 m high U=-0.4 m/k.y. G=5.5 m/k.y. E=0.05 m/k.y.
Sea level : Waelbroeck et al. 2002 T0=400ka 0 ka 20 40 60 80 100 120 140 160 180 200 220 240 260 280 300 320 340 <360ka Time scale
A
B
C
D
E
F
Figure 8. Test on the modeled plateau’s depth with regards to a linear basement shape (A) and the presence of faulting prior to reef growth (B, C). These models have been run with a subaerial erosion rate of 0.05 m/k.y., an initial time (T0) of 400 ka, and the sea level curve of Waelbroeck
et al. (2002). (D, E, and F) show the internal stratigraphy of the platforms for different basement shapes and for a subsidence rate (U) of −0.4 m/k.y. and a reef growth rate (G) of 5.5 m/k.y. The depths of the shallowest surface of erosion ZE1 are unchanged.
0 5 10 15 20 25 −400 −300 −200 −100 0 Distance(km) Elevation(m)
U=−0.4m/k.y.
G=5.5m/k.y.
Basement
E=0.05 m/k.y.
T
0=600ka − SeaLevel W+S
600 -60 0 100 0 -140 -20 -100 -40 400 -80 300 20 -160 500 -120 200 Elev ation (m) MIS5 MIS7 MIS9 MIS11 MIS13 MIS15 Age (ka) 5e 5c 5a MIS1 E2 E3 E 4E 5 E6 E7 E8 E9 E10 E11U=−0.35m/k.y.
G=4.5m/k.y.
E=0.1 m/k.y.
T
0=400ka − SeaLevel W
-49 m -26 m E1=-49 m 0 ka 20 40 60 80 100 120 140 160 180 200 220 240 260 280 300 320 340 E1 E1 EE2 3 E4 E5 E6 E7 Period of Erosion MIS1 MIS5a MIS5c MIS5e MIS9 Time scale Erosion surface <360ka 0 ka 20 40 60 80 100 120 140 160 180 200 220 240 260 280 300 320 340 e1 e2 e3 e4 e5 e6 e7 Period of Erosion Period of growth at x=12 km MIS1 MIS5a MIS5c MIS5e MIS7c MIS7e MIS9 Time scale Erosion surface <360ka c b a c d b a 7a 7b Period of growth at x=15 km MIS7c MIS7e 0 5 10 15 20 25 −300 −200 −100 0 Distance(km) Elevation(m)
Basement
e
2e
3e
4 e4c e4b e4ae
5e
6 e6c e6d e6a e6be
7 -45 m -33 me
1=-49 m
e
1 Outer barrier Inner barrier First isochrone with a plateau shapeFirst isochrone with a plateau shape
A
C
D
B
Figure 9. (A, C) Internal stratigraphy (1 k.y. isochrones) and (B, D) chronology of erosion and deposition of two of the best-fitting reef growth models for Les Saintes plateau, Gua-deloupe, French West Indies, for different T0.
(A) The model is obtained with an initial time T0 = 600 ka, slope = 0.02, maximum
reef accretion rate of 5.5 m/k.y., subaerial erosion rate of −0.05 m/k.y. and vertical mo-tion rate of −0.4 m/k.y., and modeled with the W+S sea level curve colored in the inset (Waelbroeck et al., 2002 and Shakun et al., 2015). (C) The model is obtained with an ini-tial time T0 = 400 ka, slope = 0.02, maximum
reef accretion rate of 4.5 m/k.y., subaerial erosion rate of −0.1 m/k.y. and vertical mo-tion rate of −0.35 m/k.y., modeled with the sea level curve of Waelbroeck et al. (2002). Black lines: Erosion surfaces, numerated (E or e) formed during period of erosion indi-cated in (B) and (D).
and whose activity is older than the reef construction (Leclerc et al., 2016). As their slip rates are very likely to be one order of magnitude smaller than the reef growth rates, we did not model the scarp growth through time. We modified the linear basement shape and added a 20-m-high and a 40-m-high scarp, at different places along the basement. Models repro-duced Les Saintes plateau’s depth and the depth of the shallower erosion surface ZE1 for the same ranges of parameters with or without faults (Fig. 8). The presence of a scarp influences the reef growth structure around the scarp but as sea-level highstands have amplitudes of ~120 m, that is 3–6 times the height of the scarps, it seems not to influence much the overall morphology of the platform.
These different tests allow us to be confident in the range of the parameter values, and in particular in the subsidence rate range, needed to model Les Saintes reef plateau, for reasonable basement slopes and shapes.
Modeling the Saintes Carbonate Platform Structure
One way to tighten our estimation of the subsidence rate in which a car-bonate platform such as Les Saintes plateau formed is to use the structure of the platform as a constraint. In particular, we can use the depth ZR1 of the reflector R1 close to the land as a marker of the deformation. Reflector R1 is a surface of erosion. The intersection of R1 and the basement is similar to the inner edge (or shoreline angle) of uplifted terraces that mark the highest level of the sea at the time of formation of the terrace (e.g., Lajoie, 1986; Armijo et al., 1996). This marker is therefore a relevant marker of the vertical deforma-tion of a coast. Onland, in uplifting context, inner edges can be easily identi-fied on topography, as it consists of slope breaks. On the contrary, offshore, and in such subsiding context, reef units are vertically stacked, and the inner edges are hidden by and buried under the subsequent reef growth. Therefore, accessing inner edge depth is only possible using seismic reflection profiles. In our seismic data, we do not image the contact of the reef deposits with the basement. However, we do image R1 at only a few hundreds of meters from the island coasts, lying at 49 ± 4 mbsl, considering a velocity of 1500–3000 m/s in the backreef. Without more information, we can only hypothesize that the inner edge of the seismic unit SU2 is presently at a maximum depth of ~49 ± 4 mbsl.
We measured the depth of the first surface of erosion ZE1 identified under the post-LGM deposit in the models, where it intersects the basement. We compared ZE1 to ZR1. Values matching 49 ± 4 mbsl are marked in green on Figure 7. We can notice that the modeled inner edge depth can vary greatly in the model domain, but matches the 49 ± 4 mbsl for subsidence rates in the range of −0.3 to −0.45 m/k.y.
By combining both criterions: (1) a modeled plateau at 45 ± 5 mbsl and (2) ZE1 at 49 ± 4 mbsl, and analyzing the entire set of models, we propose that Les Saintes reef plateau morphology and structure can be modeled in a sub-sidence context, with a subsub-sidence rate of −0.3 to −0.45 m/k.y.
Description of the Best-Fit Results
Figure 9 represents two of our best-fit models, obtained for initial times of 600 and 400 ka. They were obtained for a constant subsidence rate of −0.4 and −0.35 m/k.y., a reef growth rate of 5.5 and 4.5 m/k.y., a subaerial erosion rate of 0.05 and 0.1 m/k.y., respectively. The models are composed of several stacked sediment packages separated by erosion surfaces, drawn in black and named E1/E11 and e1/e7, respectively.
The bathymetric profiles of both models are close to the profile of Les Saintes plateau (Fig. 2A). The modeled platform obtained with T0 = 600 ka presents a fringing reef, a small terrace at 26 mbsl, a wide plateau drowned at 49 mbsl and a 10-m-high barrier along the edge of the plateau. The other model, obtained with T0 = 400 ka also present these features: a fringing reef, a small terrace at 33 mbsl, a wide plateau drowned at 45 mbsl. Furthermore, it shows a 4-m-high double barrier built along the edge of the plateau, similar to the one seen in the bathymetric data (Leclerc et al., 2014).
Both models share common history. The shallower unit is the post-LGM deposit (MIS1, in purple) that built on top of the MIS5 deposits (in blue). The post-LGM unit deposited on a surface of erosion E1/e1 that lies at 49 mbsl close to the island and deepens seaward to 59 mbsl. This surface constitutes the upper bound of the MIS5 reef units. Overall, the MIS5 deposit is almost 40 m thick and presents two inner erosion surfaces, E2/e2 and E3/e3, which result from sub-stages sea level lowstands, during MIS5b and MIS5d, respectively. Below, the MIS7e and MIS7c are stacked vertically (in green) over either the horizontal reef unit built during MIS9 (in red, Fig. 9A) or, above prograding reef units built between MIS9 highstand and MIS8 lowstand (red to yellow, Fig. 9C). When comparing these models to the seismic profiles we described above (Figs. 3 and 4), the seismic unit SU1 corresponds to the post-LGM deposit, and the reflector R1 corresponds to the erosion surface E1/e1 that formed through the LGM period. As no age controls are available to constrain the age of the deeper seismic units, we cannot validate the stratigraphy at depth that is modeled here. We can only note that above 90 mbsl, three surfaces of erosion are imaged in the seismic profiles, and three surfaces of erosion are modeled. For reasonable and constant reef growth rate, subaerial erosion rate, and sub-sidence rate, the deeper seismic units SU2, SU3, and SU4 could correspond to the reef deposited during the substages of MIS5, and R2 and R3 could be related to erosion during the MIS5 sub-stages sea level lowstands, here E2/e2 and E3/e3, respectively.
Exploring Possible Subsidence Rate History
With the first sets of models described above, we showed that Les Saintes plateau morphology and stratigraphy can be modeled in a context of subsid-ence, and for constant subsidence rates of −0.3 to −0.45 m/k.y., since at least the last-glacial maximum (i.e., time of R1 formation). Coring and isotopic or biostratigraphic dates as well as deeper seismic reflection imaging are needed
to constrain the deep structure of Les Saintes plateau, as well as its entire vertical motion history, that might have varied through time. For comparison, the nearby islands of Marie-Galante and La Désirade underwent uplifts that slowed down during Upper-Pleistocene (Feuillet et al., 2004, Léticée et al., 2019). Being aware of our lack of constraints on the subsidence history of Les Saintes, we therefore propose to simply test if Les Saintes plateau can have formed in a context of subsidence that has slowed down or accelerated through time.
As described above, we used the reef model in its 1-D version, and modeled reef accretion along a subsiding coast, whose subsidence rate is a function of time. As discussed earlier, the start time of the model does not affect much the upper section of the plateau (only the presence or absence of double barriers), where we have seismic stratigraphic constrains. Moreover, as we can notice in Figure 10, Figure S4 (footnote 1), and similarly to the results of our best fit 2-D model (Fig. 9), the seismic units are associated in these models to MIS5 substages reef deposits only. Therefore, for these reasons we set up our model starting only 330 k.y. ago. Figure 10 shows the results of these models for z0 = 75 mbsl, a reasonable initial basement depth that allows us to compare the synthetic cores with the Les Saintes plateau stratigraphy, seaward of the 25 mbsl terrace, below the 45 mbsl plateau.
On Figure 10, the synthetic cores are represented as a function of subsid-ence rates, colored by reef age. Surfaces of erosion are plotted as black dots, and are named Ei only when cited in the text. For comparison, we superim-posed the Saintes plateau’s depth (pink horizontal bar), as well as the depth’s range of the three reflectors R1, R2, and R3 (represented as colored boxes at 52–71 mbsl, 63–90 mbsl, and 76–109 mbsl, respectively). We consider a syn-thetic core compatible with our data when it is 45 ± 5 mbsl deep, and presents at least two surfaces of erosion, each within the depth domains of R1, and R2, i.e., falling in the colored boxes (R3 is also represented for reference). Table 4 summarizes the results of the three vertical motion history scenarios.
First, we modeled the synthetic cores for a constant subsidence rate (Figs. 10A–10D), in order to compare with our 2-D simulations. We obtained cores compatible with the data for reef growth rates of 5 and 7.5 m/k.y., and subsidence rates of about −0.4, and about −0.55 m/k.y., respectively (Figs. 10B, 10C). For G = 5 m/k.y., this is in very close agreement with the 2-D models. For G = 7.5 m/k.y., the 1-D model produces a plateau at 45 ± 5 mbsl, while the 2-D simulations produce a plateau much deeper (>60 mbsl, Fig. 7B). This discrep-ancy is probably due to the fact that reef growth rate decreases horizontally in the 2-D simulation, away from the open-sea, a process that is certainly critical on reef morphology for such a reef growth rate. For G = 2.5 m/k.y. (Fig. 10A), we modeled a synthetic core at a depth of 45 ± 5 mbsl, for a subsidence rate of about −0.2 m/k.y., however, the stratigraphy does not match our data, as the erosion surface E2 is deeper than the depth range of R2. Synthetic cores modeled with G = 10 m/k.y. show systematically a surface of erosion E1 deeper than R1 (Fig. 10D).
Using a subsidence rate that increases linearly from 0 m/k.y. at 330 ka to U at 0 ka (Figs. 10E–10H), the model produced a good stratigraphy for low reef growth rates. With G = 2.5 m/k.y., we obtained 4–5 stacked units for a
final subsidence rate close to −0.2 m/k.y. (Fig. 10E). However, the upper de-posit (equivalent to SU1) is only a few meters thick, that is not realistic as not comparable with our seismic profiles. With G = 5 m/k.y., we also obtained a core presenting 4–5 vertically stacked units, with reasonable thicknesses, for a final subsidence rate of about −0.27 m/k.y. (Fig. 10F). For higher reef growth rates (Figs. 10G, 10H), E1 or E2 are too deep in the few models that generate synthetic cores at appropriate depths.
Using a subsidence rate that decreases linearly from U at 330 ka to 0 m/k.y. at 0 ka, the model generated a reasonable stratigraphy only for G = 2.5 m/k.y. and U = −0.26 ± 0.01 m/k.y. However, the upper unit is again only a few meters thick, which does not correspond to the observations made along the seismic profiles. When using higher reef growth rates, the reef is able to keep up with sea level, and a plateau forms at sea level.
We also tested a quadratic function for subsidence variations that showed the same trend (Fig. S4 [footnote 1]): for models with decreasing subsidence through time, no appropriate cores were modeled (Figs. S4E–S4H), while for subsidence rate increasing through time, several parameters combinations reproduce the stratigraphy: (1) for G = 2.5 m/k.y., cores were compatible for final U of −0.28 ± 0.01 m/k.y., but the upper unit is only a few meters thick (Fig. S4A); (2) for G = 5 m/k.y., cores were good for final U of −0.24 ± 0.01 m/k.y. (Fig. S4B); (3) for G = 7.5 m/k.y., cores were compatible with data for final sub-sidence of about −0.26 m/k.y. (Fig. S4D).
Therefore, these tests tend to indicate that if subsidence has varied through time (here modeled since 330 ka only, as we lack information about the deep stratigraphy of the plateau) subsidence may have increased rather than de-creased recently. Further tests and age constraints are required to confirm such a trend.
■
DISCUSSION
This reconstructed accretion history of Les Saintes reef plateau offers a new perspective on long-term deformation along the Lesser Antilles volcanic arc. The morphological and structural agreements between the geophysical data
imaging the reef plateau and the models of late Quaternary plateau growth indicate that the archipelago has experienced a subsidence that we are able to quantify. All the models performed and presented above, for any sea level curve, basement morphology, range of appropriate reef growth rates, and subaerial erosion rates show that Les Saintes plateau cannot be modeled in neutral tectonic context, but in subsiding context only. Interpretation of these models implies that the subsidence rate, if constant through time, is of the order of −0.3 to −0.45 m/k.y., and if varying through time, is probably increasing to about −0.2 m/k.y. since several hundreds of thousands of years (modeled here since 330 ka only).
While Leclerc et al. (2014, 2015) had suggested subsidence in Les Saintes and in Martinique, along the volcanic arc, this study confirms this vertical motion history, in Les Saintes.
Subsidence is constant Subsidence increases linearly Subsidence decreases linearly G =2.5 m/k.y . G =5 m/k.y . G =7.5 m/k.y . G =10 m/k.y . -0.8 -0.6 -0.4 -0.2 0 -0.8 -0.6 -0.4 -0.2 0 -0.8 -0.6 -0.4 -0.2 0 -0.8 -0.6 -0.4 -0.2 0 -0.6 -0.8 -0.4 -0.2 0 -0.8 -0.6 -0.4 -0.2 0 -0.8 -0.6 -0.4 -0.2 0 -0.8 -0.6 -0.4 -0.2 0 -0.8 -0.6 -0.4 -0.2 0 -0.8 -0.6 -0.4 -0.2 0 -0.8 -0.6 -0.4 -0.2 0 -0.8 -0.6 -0.4 -0.2 0 Elevation (m) 0 0 -50 -100 -150 -200 -50 -100 -150 -200 0 -50 -100 -150 -200 0 -50 -100 -150 -200 0 -50 -100 -150 -200 0 -50 -100 -150 -200 0 -50 -100 -150 -200 0 -50 -100 -150 -200 0 -50 -100 -150 -200 0 -50 -100 -150 -200 0 -50 -100 -150 -200 0 -50 -100 -150 -200 No match No match No match 330 ka 300 250 200 150 100 50 0 ka Depth range of U (m/k.y.) U (m/k.y.) U (m/k.y.) E2 E2 R1 R2 R3 E2
E
1E
1 Synthetic core for Zplateau =45±5 mbslB
C
D
A
F
G
H
J
K
L
E
I
Figure 10. 1-D modeling producing stratigra-phy of synthetic cores as a function of sub-sidence rates (U) for different reef growth rates (G). Subsidence can be constant (A–D), can increase linearly through time from 0 m/k.y. to U (E–H) or can decrease linearly through time from U to 0 m/k.y. (I–L). Deposits are colored by age. Surfaces of erosion are represented as black dots. Superimposed on the synthetic cores are benchmarks to compare with the geophys-ical data: pink box represents the depth of Les Saintes plateau at 45 ± 5 mbsl, the red square indicates R1’s depth: 45–71 mbsl;
the orange box indicates R2’s depth: 63–90
mbsl; the orange box represents R3’s depth:
76–109 mbsl. Black bars indicate synthetic cores that are at depths comparable with Les Saintes plateau’s depth. E1 and E2 are