A comparison between single gate and multigate
ultrasonic Doppler measurements for the assessment of
the velocity pattern in the human ascending aorta
R. JENNI, A. VIELI, K. RUFFMANN, H.-P. KRAYENBUEHL AND M. ANLIKER
Medical Policlinic, Cardiology and Institute for Biomedical Engineering, University of Zurich and Swiss Federal Institute of Technology, Zurich, Switzerland
KEYWORDS: Velocity pattern in the human ascending aorta, multigate Doppler.
The velocity pattern in the ascending aorta of 15 healthy adults was measured quasisimultaneously from the Doppler-shifts produced in 16 gates distributed equally within the cross-section along a narrow ultrasound beam which centrally traversed the vessel upstream of the brachiocephalic trunk. A comparison between the time integrals of the velocities in gates 9 (centre line), 4 and 13 (off centre) and the time integral of the weighted mean of the velocities of all gates correlated with r = 0-90, SEE= 105 (gate 9), r = 0-90, SEE 0-88 (gate 4) and r = 0-92, SEE 0-94 (gate 13). A better correlation (r = 0-96, SEE=0-60) was found between the linear mean of all gates and the weighted mean.
These results show that Doppler measurements in single small gates are not appropriate to determine the average cross-sectional blood flow velocity in healthy adults.
Introduction
Although the potential of utilizing a combi-nation of ultrasonic imaging data and Doppler shift determinations in the ascending aorta to evaluate cardiac output has been recognized""31, no clinical procedure has been generally agreed upon so far. Major problems impeding the development of such a procedure include the quantitation of all three spatial velocity com-ponents, the evaluation of the cross-sectional area of the vessel lumen and the determination of the cross-sectional mean blood flow velocity from the spatial velocity distribution along a single beam direction through the centre of the lumen141. The purpose of this study is to examine the differences one obtains for the values of the volume flow rate when one varies the position of a single gate within the lumen and interprets the instantaneous velocity within the small volume corresponding to this gate as the instantaneous cross-sectional mean velocity. The methods applied until now to assess cardiac output by means of Doppler echocardiography are
Received for publication on 23 May 1984 and in revised form 24 August 1984.
Address for correspondence- Rolf Jenni, M.D.. M.S.E.E.. Medical
Policlinic, Cardiology, Uimeraty Hospital. Raemistrassc 100, CH-8091 Zurich. Switzerland
based on placing the gate in the centre of the aortic lumen and on defining the observed velocity as the cross-sectional mean value11 "31. Invasive studies based on multigate Doppler131 or hot film anemometry16-71 have shown that the velocity profiles in the ascending aorta are flat but skewed in dogs.
Fisher et a/.'1' have addressed the question whether the position of a single sampling volume and its length along the beam axis is crucial to the calculation of cardiac output in dogs with open chests. Their study showed excellent correla-tions between the results obtained by single gate Doppler measurements and those by beaker and stopwatch for each sampling volume and each site. In contrast to Fisher1", we investigated healthy human subjects noninvasively with a multigate Doppler instrument providing quasisimultaneous velocity information from 16 gates distributed equally along the beam axis within the cross sec-tion of the vessel (Fig. 1). 'Quasisimultaneously' refers to the fact that there is a time shift between the sampling of gates 1 to 16. For all practical pur-poses this time shift is negligible. The 16 velocities measured define an instantaneous spatial velocity profile and permit simultaneous volume flow rate determinations for 16 different individual gate locations. Three representative individual results
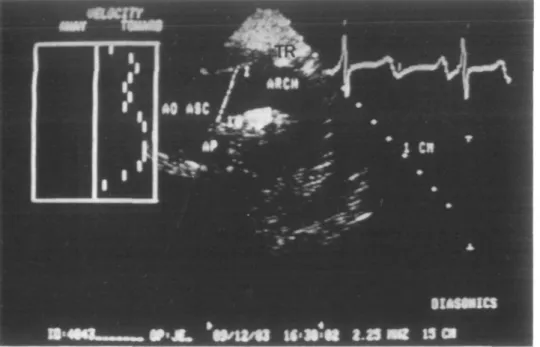
Figure 1 Echogram of the aortic arch. The Doppler beam is placed upstream of the brachiocephalic trunk (TR) in the ascending aorta (AO ASC). The range in which the 16 sampling volumes are distributed is marked with a white bar (AP = pulmonary artery).
are normalized with respect to the mean volume flow rate found by integrating the instantaneous spatial velocity profile along the beam direction over the cross-section of the aorta as illustrated in Fig. 2.
We thereby assume that in each individual case the angle of incidence and the vessel lumen remain constant throughout the cardiac cycle. Thus we do not calculate the true stroke volume but merely the time integrals of the measured average velocity (i.e. the relative volume flow rate) within the vessel cross-section over the heart cycle.
Methods
PATIENTS
Our noninvasive investigations were carried out in 15 normal subjects, 8 females (mean age 25 years) and 7 males (mean age 26 years). Each sub-ject was placed in supine position and the trans-ducer was positioned in the suprasternal notch so that the echogram depicted the ascending aorta, the aortic arch and the great vessels (Fig. 1).
Figure 2 Ring approach for the calculation of the instan-taneous mean velocity. The vessel lumen is subdivided into half annular segments (A^) with their width corresponding to the distance between adjacent gates. Each velocity value (vj is considered to be representative for one of these half annuli and therefore weighted with the corresponding area. The resulting Q, represents the flow rate through the area segment A,. These segmental flow rates are summed and normalized with respect to area in order to yield the instantaneous mean velocity.
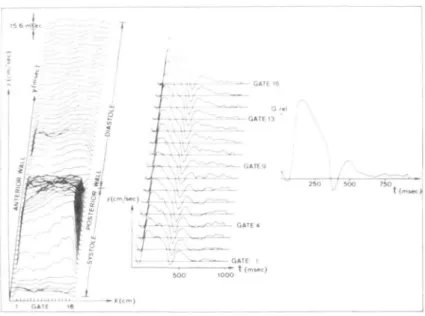
Figure 3 Velocity patterns in the ascending aorta. The plot of the results contains the full set of velocity profiles of a 30-year-old healthy female subject on the left side. The x-axis corresponds to the depth divided into 16 gates, the y-axis to the time within the cardiac cycle and the z-axis to the velocity. On the right the velocity waveforms as a function of time are plotted for the sixteen single-gate velocities and for the weighted instantaneous mean velocity (Qrtl).
INSTRUMENTATION
A Diasonics CV-3400R Sector Scanner with an integrated multigate Doppler subsystem was used with its standard 2-25 Mhz transducer. Beam profile data kindly supplied by Diasonics Inc., Milpitas, CA, U.S.A., indicate that the half max-imum beam width in the waterbath is of the order of 3 to 7 mm in the depth range of 4 to 10 cm and at an angle of less than 30 degrees which includes the region within which the Doppler measurements were made. In addition the axial length of the sam-pling volume is given as being 2 mm. The 16 gates the interspace of which is adjustable were dis-tributed equally along the Doppler beam axis between the anterior and the posterior aortic wall (Fig. 1). If the distance between the anterior and the posterior aortic wall is more than 32 mm this results in a gap between adjacent gates, if the dis-tance is less than 32 mm the gates overlap partially. The pulse repetition frequency for the Doppler beam was between 3-7 kHz and 2-35 kHz depend-ing on the depth of the posterior wall. The velocity information from each gate was sampled by an external microcomputer (Motorola, 6800) and the instantaneous velocity profiles were displayed on the monitor of the CV-3400R. The microcomputer
digitises the velocity information from each of the gates 1 to 16 with a frequency of MHz and a resolution of 8 bits. Furthermore, it averages these data for each of the gates at corresponding instants in the heart cycle over 8 successive heart beats. During the data acquisition the instantaneous maximum velocity versus time is displayed on a monitor for each heart cycle separately. This allows the operator to eliminate data sets contain-ing velocity information associated with ectopic beats and excessive motion of the vessel relative to the transducer. The averaged profiles are stored on floppy disc for offline analysis.
DATA ACQUISITION
After echographic visualization of the ascending aorta and the aortic arch in their maximum diameter (Fig. 1), the Doppler beam was placed upstream of the brachiocephalic trunk in such a way that (1) the angle of incidence near the anter-ior aortic wall was nearly the same as near the posterior aortic wall and (2) no aliasing occurred. Then, gate number 1 was placed near the aortic wall closer to the transducer, and gate number 16 near the one farther away from it. Thereafter the two-dimensional image was frozen to allow for the
weiocny ratio velocity ratio ( »4/ v , ) at cnar.r.ei 4 v vl 3/ v9) at channel 13
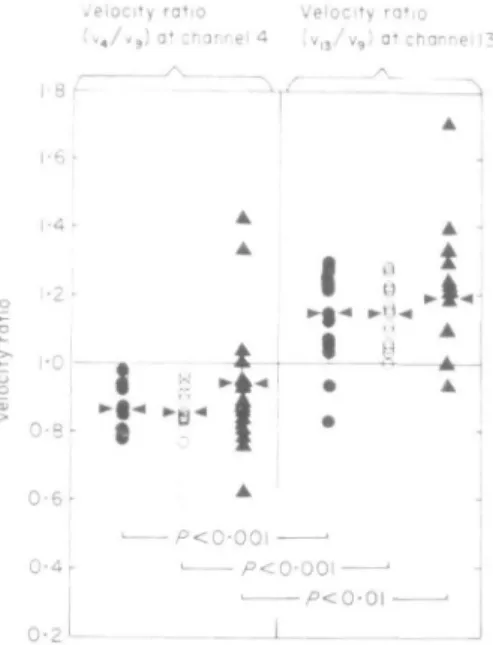
Figure 4 Anterior-posterior skewness of the velocity pro-files. For 30% ( • ) , 50% ( O ) and 70% (A) systolic ejection period (SEP) the velocities of channel 4 (left side) and 13 (right side) are plotted normalized to the centre line velocity (gate 9). At all three instants a statistically significant skew-ness with increased velocities near the posterior and decreased velocities near the anterior vessel wall can be observed.
higher acquisition rate of the Doppler signal. In all subjects the beam could be placed such that the Doppler signal did not exhibit aliasing.
DATA ANALYSIS
Five approaches were used to determine the cross-sectional average of the instantaneous velocities:
(1) Each velocity value within a profile is assumed to be representative of the corresponding semi-annular segment of the vessel cross-section (Fig. 2). Based on this assumption each of the measured velocities is weighted by the area of its segment. Their sum is normalized with respect to the circular cross-section denned by gates 1 and 16 to yield an instantaneous mean velocity. This method is called a ring approach. The corresponding M-shaped weighing function has its minimum at the gates 8 and 9 in the centre of the vessel and increases linearly with the distance from the vessel axis. The ring approach is taken as a reference for all measurements as it is based on the total available velocity information.
(2) The velocity measured in gate 9 (Fig. 3) near the centre of the vessel is interpreted as the instantaneous mean velocity.
(3), (4) Velocity measurements in the gates 4 and 13 (Fig. 3) in the anterior and posterior segment of the cross-section, respectively, are interpreted as the instantaneous mean velocity analogues to approach (2).
(5) The velocities measured in gates 1 through 16 were averaged to yield the cross-sectional linear mean.
Fig. 3 shows a typical plot of these velocities as a function of time. The skewness of the profile was evaluated at different instants with the systolic ejection period (SEP) by comparing the velocities measured in gates 4 and 13 to the centre line velocity (gate 9). To allow for a comparison of the stroke volumes one would obtain by interpreting the individual values of the five velocities as the cross-sectional average velocity, each of the five velocity-time curves is integrated over time during the heart cycle. Each of the five time integrals represents an estimate for the stroke volume except for a factor depending on the angle of incidence and the cross-sectional area.
Results
VELOCITY PROFILES
In Fig. 4 the average skewness of the velocity profiles of the 15 subjects is characterized by the relative deviation from the centre line velocity. Gate 4 anterior to the centre line shows at 30% SEP a deviation of - 6 % t o - 2 2 % , at 50% SEP one of + 4 % to - 4 0 % and at 70% SEP one of + 14% to - 3 8 % . In contrast, gate 13 posterior to the centre line yields at 30% SEP a deviation of - 1 8 % to + 3 3 % , at 50% SEP one of 9% to + 27% and at 70% SEP one of - 6 % to + 7 1 % . Accordingly the velocity profiles in the ascending aorta are skewed insofar as the velocities near the anterior wall are lower than in the centre of the vessel and higher near the posterior wall.
TIME INTEGRALS OF THE MEAN VELOCITY
Fig. 5 illustrates the differences between approach 1 and approaches 2 to 5. Based on the centre line velocity (gate 9) the time integral or volume flow rate is overestimated by 7% to 45% (mean 14%, r = 0-90, SEE =1-05). The time integral based on the velocity in gate 4 yields values between 19% under- and 12% overestimation (mean - 5 % , r = 0-90, SEE = 0-88) as compared
14 12 10 o" 8 6 4 2 0 o ) y = l-676x-0-2062 ^ = 0-90 SEE = 1-05 /V = 15 14 12 10 = 8 6 4 2 ( c) • , ' ' y = H824x + 0-655l SEE = 0-94 i i 1 • • 1 2 4 6 8 10 12 14 2 4 6 8 10 12 14 4 12 10 8 6 4 2 ( b)
• y
/
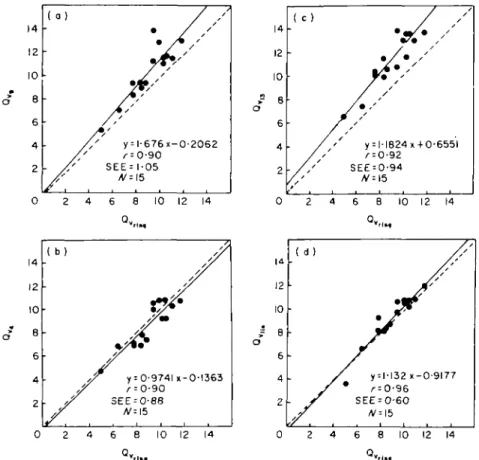
,f y = 0-974U-0-l363 3EE = 0-88 ^=15 8 10 12 14 4 2 0 8 6 4 2 ( d ) / • • / / / y = 1-132 x-0-9177 SEE = 0-60 _i 1 1 i i 0 2 4 6 8 10 12 14 Q».,_.Figure 5 Correlation between the time integrals of v9, v4> v1 3, vUn and vrill|. The plots (a), (b), (c) and (d) respectively summanze the values of the time integrals of v9, v4, v1 3 and vlln versus the ones of vrln§ for 15 healthy subjects. The time integrals are symbolized by Qv, indi-cating a measure of the stroke volume per unit area. For both coordinates the same arbitrary units are used. The line of identity is indicated by a dashed line. The line corresponding to the regression equation given in the lower right corner of each figure is drawn solid, r represents the correlation coefficient, SEE the standard error of the estimate and N the number of sub-jects. The deviations of Qv, from Q,rlmt range from + 7 % to + 4 5 % (mean + 14%), the ones
of Qv< range from - 1 9 % to + 12% (mean - 5 % ) the ones of g ,M range from + 14% to + 45% (mean + 2 7 % ) and the ones of Q,nm range from —26% to + 19% (mean + 3 % ) .
with the nng approach. The comparison of the time integral of gate 13 and the ring approach results in an overestimation of 14% to 45% (mean
21%, r = 0-92, SEE = 0-94).
The comparison of the time integral of the linear mean and the ring approach yields results between - 2 6 % and + 1 9 % (mean = 3%, r = 0-96, SEE = 0-60).
Discussion
The goal of our study was similar to that of Fisher et a/."1 in that we also investigated the
influence of the sampling site on estimations of the time integral of the velocity. However, in contrast to providing results obtained in open chest dogs, our data were recorded noninvasively from healthy human subjects. Our results differ to some extent from Fisher's insofar as we find a variation of the time integral of the velocity with the location of the sampling volume within the lumen of the ascend-ing aorta. Reasons for this difference may include the following factors. The transducer position and orientation with regard to the flow direction used by Fisher et al., differed from ours. Due to their smaller angle of incidence the different gate
pos-itions are selected more along the vessel axis than across the vessel diameter. It is recognized that the most sizable error in the ultrasonic measurement of the stroke volume probably arises from inac-curacies in the echographic determination of the cross-sectional area of the vessel and the direction of the flow relative to the ultrasound beam but this problem was neither addressed in our study nor fully explored in ref*11. We have assumed that in each individual case this angle is the same in all points of the cross-section. Within the framework of this assumption our different approaches in caculating the time integral of the instantaneous mean velocity become independent of the true direction of flow.
It may be argued that the angle of incidence tends to be smaller in gate 13 than in gate 4, which would result in higher velocities in gate 13. However, to produce a skewness of the measured amount with an angle of incidence of roughly 50 degrees, the angular difference between the anterior and the posterior vessel wall would need to be about 20 degrees, which is considerably more than what we could observe in our echograms.
The result of Paulsen and Hasenkam'61 show that there is a left to right skewness in addition to the antero-posterior one. Although our beam direction was not exactly the same as the one of Paulsen and Hasenkam161, our results can roughly be compared with their antero-posterior skewness which appears to be predominant.
By placing a single gate proximal to our measurement site13' additional problems due to motion of the aorta relative to the fixed gate position are encountered. During the cardiac cycle different portions of the vessel diameter are interrogated.
!t is of interest that the best correlation is obtained between the linear mean and the ring approach. From this it can be concluded that a
'giant' gate including the whole vessel diameter gives the best single gate estimate of the cross-sectional mean velocity. It should be noted that the velocity profiles in the ascending aorta can become much more irregular as a consequence of disease processes as illustrated in ref181. This can com-pound the error of the stroke volume determi-nations based on velocity measurements in a single small gate. In summary our results indicate that even in healthy subjects flow estimates based on single gate Doppler measurements in the ascending aorta depend on the sampling site within the lumen.
References
[1] Fisher DC, Sahn DJ, Friedman MJ et al. The effect of variations on pulsed Doppler sampling site on calcula-tion of cardiac output: An experimental study in open chest dogs. Circulation 1983; 67: 370-6.
[2] Steingart RM, Meller J, Barovick RN, Patterson R, Herman MV, Teichholz LE. Pulsed Doppler echo-cardiographic measurement of beat-to-beat changes in stroke volume in dogs. Circulation 1980; 62: 542-84. [3] Goldberg SJ, Sahn DJ, Allen HD, Valdes-Cruz LM.
Heonecke H, Carnahan Y. Evaluation of pulmonary and systemic blood flow by two-dimensional Doppler echocardiography using fast Fourier transform spectral analysis. Am J Cardiol 1982; 50: 1394-460.
[4] Schuster AH, Nanda NC. Doppler echocardiographic measurement of cardiac output: comparison with a non-golden standard. Am J Cardiol 1984; 53: 257-9. [5] Perroneau PA, Sandmann W, Xhaard M. Blood flow
patterns in large arteries. In: White DN, Brown RE, eds. Ultrasound in medicine, Vol 3B. New York: Plenum Press, 1977: 1193-208.
[6] Paulsen PK, Hasenkam JM. Three-dimensional visu-alization of velocity profiles in the ascending aorta in dogs, measured with a hotfilm anemometer. J Biomechanics 1983; 16: 201-10.
[7] Seed WA, Wood NB. Velocity patterns in the aorta. Cardiovasc Res 1971; 5: 319-29.
[8] Jenni R, Vieli A, Anliker M, Krayenbuehl HP. Doppler echocardiography; its advantages and limitations in adult cardiology. In: Roelandt J, ed., The practice of M-mode and two-dimensional echocardiography. Den Haag: Martinus Nijhoff, 1983: 90-7.