Binomial Sampling of Western Flower Thrips Infesting Flowering
Greenhouse Crops Using Incidence-Mean Models
TODD A. UGINE,1JOHN P. SANDERSON,1STEPHEN P. WRAIGHT,4LES SHIPP,5 K. WANG,5
ANDJAN P. NYROP3
Environ. Entomol. 40(2): 381Ð390 (2011); DOI: 10.1603/EN10085
ABSTRACT Accurate assessments of thrips density are important for effective thrips management programs. Complicating the development of sampling plans for western ßower thrips (WFT)
Franklin-iella occidentalis(Pergande) in greenhouse crops are the facts that they are small, difÞcult to detect, and attack a variety of crops, which may be grown concurrently within the same greenhouse. Binomial sampling was evaluated as an alternative to sampling plans based on complete enumeration. This work included comparison of incidence-mean models across diverse plant species (impatiens, cucumber, and marigold) to determine the possibility of using a generic model for sampling WFT in mixed crops. Data from laboratory-processed ßower samples revealed that infestation rates calculated using a tally threshold of three thrips per ßower provided the best estimates of thrips population densities in each tested crop and in the combined crops (composite data set). Distributions of thrips populations were similar across the three plant species, indicating potential for development of a generic sampling plan for mixed ßoral crops. Practical sampling methods for simple and complex ßowers tested in the greenhouse (in situ) were evaluated via construction of binomial count operating characteristic functions. In the case of simple ßowers (impatiens), visual inspections provided adequate estimates of thrips infestation rates at a low tally threshold, which ultimately enabled accurate estimation of thrips densities. However, visual inspection and tap-sampling of complex ßowers (marigold) provided unreliable results. These Þndings indicate that use of binomial sampling methods in mixed ßoral crops will require development of more accurate sampling techniques.
KEY WORDS binomial sampling, ßower taps, visual inspection, classiÞcation sampling, operating characteristic
Western ßower thrips, Frankliniella occidentalis Per-gande, are a polyphagous species (Yudin et al. 1986) with a host range of over 250 plant species (Bryan and Smith 1956, Haselwood 1983), which contributes to its status as a key pest in numerous greenhouse-grown vegetable and ßoriculture crops around the world (Steiner 1990, Higgins 1992, Seaton et al. 1997). Abun-dance of F. occidentalis in crops can be highly variable and as a result, assessment of thrips density is impor-tant for effective management.
Sampling procedures for thrips have been devel-oped for many outdoor crops including apple (Malus
domesticaBorkh.), cotton (Gossypium spp.), soybeans [Glycine max (L.) Merr.], onions (Allium spp.), to-matoes (Solanum Lycopersicum L.), and nectarines [Prunus persica (L.) Batsch] (Lewis 1973, Chander and Verma 1978, Irwin and Yeargan 1980, Edelson 1985, Terry and DeGrandi-Hoffman 1988, Pearsall and
Myers 2000, Boll et al. 2007), and for some greenhouse crops including cucumbers (Cucumis sativus L.), sweet pepper (Capsicum annuum L.), chrysanthemum (Chrysanthemum spp.), Cyclamen spp., and garden impatiens (Impatiens spp.) (Steiner 1990, Shipp and Zariffa 1991, Taylor et al. 1998, De Courcy Williams 2001, Wang and Shipp 2001, Ugine et al. 2006). The two most common thrips sampling techniques are sticky cards (Steiner 1990, Shipp and Zariffa 1991, Taylor et al. 1998), which are placed directly above or within the crop canopy, and direct observation of thrips on plant material (i.e., leaves or ßowers) (Henneberry et al. 1964, Terry and DeGrandi-Hoffman 1988, Rosenheim et al. 1990, Wang and Shipp 2001, Williams 2001, Ugine et al. 2006). In crops of greenhouse cucumber and sweet pepper, sticky card catch can predict thrips density in the crop (Yudin et al. 1987, Shipp and Zariffa 1991) and has historically been the recom-mended method of assessment (Steiner 1990, Gillespie and Vernon 1990). Sticky traps have the added beneÞt of detecting small populations of thrips before they can be easily found on the various types of plant samples and before certain types of plant samples are available (i.e., before ßowering). However, the rela-tionship between sticky card catch and thrips density 1Department of Entomology, Cornell University, Ithaca, NY 14853.
2Corresponding author, e-mail: [email protected]. 3Department of Entomology, Cornell University, Geneva, NY
14456.
4USDAÐARS, Ithaca, NY 14853.
5Agriculture and Agri-Food Canada, Harrow, Ontario N0R 1G0,
Canada.
on foliage is often highly variable and can be depen-dent on the host plant (Higgins 1992, Jacobson 1997, Lewis 1997, Pearsall and Myers 2000, Rhainds and Shipp 2003).
Taylor et al. (1998) in a study of Þve independent data sets collected from sticky cards placed directly above the canopies of greenhouse cucumbers, sweet peppers, chrysanthemums, garden impatiens
[Impa-tiens wallerana(Hook) F], and mixed potted plants, determined that the spatial aggregation of thrips as measured by TaylorÕs power law (Taylor 1961) was the same across all plant species tested. It was suggested that a sampling scheme using set parameters for Tay-lorÕs law “is probably the best practical approach to pest management decision-making for F. occidentalis in the greenhouse.” However, in only one of the Þve data sets analyzed Shipp and Zariffa (1991), is there any measure of the correlation between trap catch and thrips density.
Flowers are often attractive to thrips (Gonzalez et al. 1982, Gonzalez and Wilson 1982, Pickett et al. 1988), and sampling ßowers is a common method of assessing both thrips presence and density. It has been used in apples (Terry and DeGrandi-Hoffman 1988), cucumber (Rosenheim et al. 1990, Wang and Shipp 2001) cyclamen (Williams 2001), and roses (Rosa spp.) (Henneberry et al. 1964) and may be a better estimator of thrips density compared with sticky trap catch; immature and adult thrips can be observed in ßower samples, whereas only adult thrips (ßying) can be sampled with stick cards. One drawback of sam-pling ßowers is that there is a period of time in the production of most crops in which no ßowers are present, making sticky traps the only practical method of thrips detection.
Because thrips are small and difÞcult to count, bi-nomial count sampling is preferred to complete enu-meration. Binomial sampling relates, via statistical models, the proportion of sample units with more than a threshold count, T, to the mean density. The under-lying statistical models are known as incidence-mean models. Complicating the development of such sam-pling plans for thrips in ßoriculture production is the fact that numerous crop species are often grown con-currently within the same greenhouse. It is impractical and not cost effective to develop and use a different incidence/mean model and associated sampling plan for all the different types of greenhouse ßoriculture crops. This suggests that there is a need for a generic model and sampling plan. Greenhouse ßoriculture crops generally fall into two distinct categories, those that have simple ßowers and those with composite ßowers, implying that there may be a need for two generic sampling plans. Our objectives in this study were to determine 1) whether incidence-mean mod-els describe the relationship between incidence of F.
occidentalis-infested ßowers and mean thrips density, and if this relationship is affected by plant species; and 2) what thrips sampling technique provides the best relationship (minimizes sampling uncertainty) be-tween incidence of infested ßowers and mean thrips density for composite and simple ßowers in situ.
Be-cause of our extensive experience with thrips infesting both garden impatiens and marigolds (Tagetes patula L.), we choose these ßowering plants as our model simple and complex ßowers, respectively. In addition, for comparison with our ßoriculture crops, we in-cluded a data set from a commonly grown greenhouse vegetable, English cucumber Cucumis sativus L.
Materials and Methods
Our work broadly consisted of two steps. First, we estimated incidence-mean models for counts of F.
oc-cidentalis from the three crops and determined whether the crop from which samples were collected inßuenced the parameters of the estimated models. We found that crop did not have such an effect and proceeded to the second step, which entailed evalu-ations of practical sampling techniques that could be used in situ.
We developed sampling techniques and corre-sponding incidence-mean models for simple and com-posite ßowers, and assessed how use of the sampling techniques affected binomial count sampling plan per-formance. Sampling plan performance was measured via operating characteristic (OC) functions for clas-siÞcation and via variances for estimated mean den-sity. In both cases, Þxed sample size procedures were used because they are simple yet allow for the same conclusions as if more complicated sequential proce-dures were used.
Greenhouses, Plants, and Insects. Three different
greenhouse arrangements were used to collect data from impatiens and marigolds. The Þrst consisted of three adjacent glass greenhouses (⬇3 m ⫻ 5m) with 9 m2of bench space per house. These were Þlled with 350 Ð 400 potted garden impatiens plants, variety ÔSu-perElÞn; whiteÕ as described in Ugine et al. (2006). All data from these greenhouses were used exclusively in the model validation aspect of these studies (see be-low). The second arrangement, used in the investiga-tion of incidence-mean models and approximately half of the plants used in the test of operational sampling techniques (in situ) of complex ßowers were grown in a set of Þve plastic-covered greenhouses with dimen-sions of 5⫻ 4 m. The Þnal experimental arrangement was a single large glass greenhouse that was subdi-vided with dividing walls into three bays (10.4 m⫻ 8 m), each with independent environmental controls. Each subdivision contained two sets of four rolling benches (1.5 m ⫻ 2.7 m) situated to maximize the distance between plots of plants. Impatiens plants used in the test of operational sampling techniques (in situ) were grown and maintained in the subdivided greenhouse as described in Ugine et al. 2007. Mari-golds, variety ÔBonanza Bolero,Õ were grown from seed purchased from Park Seed Wholesale, Inc. (Green-wood, SC). All of the marigold plants used in the remaining half of the operational sampling technique tests were maintained in the 3-bay glass greenhouses described above, under similar conditions. Plots of marigolds and impatiens in both the small plastic-covered greenhouse and the three-bay greenhouse
contained 25 ßats of plants arranged on benches to form a contiguous plot of 3.7 m2. The growing condi-tions for cucumber plants (cultivar ÔFlamingoÕ) and methods for insect rearing and release are described by Shipp and Zariffa (1991). Plants were either nat-urally infested with thrips migrating into the green-houses or were infested with a small number of thrips (⬇20) from a laboratory colony (Ugine et al. 2006). In each instance, the distribution of plants and thrips within plants closely represented distributions that a scout or grower would likely encounter upon entering any thrips-infested greenhouse.
Influence of Plant Species on Incidence-Mean Mod-els. Fully-opened, nonsenescent impatiens, marigold
and cucumber ßowers were chosen from arbitrarily selected locations throughout the plant canopy, ex-cised, and immediately placed individually into 20-ml scintillation vials or 100-ml snap-cap polycarbonate vials containing 70% EtOH. Flowers were dissected in the laboratory under alcohol in a 100-mm glass petri dish using a stereomicroscope, and the numbers of adult and immature thrips were recorded for each sample. Thrips that were obviously dead before being placed into alcohol (i.e., dry and shriveled in appear-ance) were rare and were not quantiÞed. One hun-dred and seventeen, 67, and 20 sample collections of impatiens, marigolds, and cucumbers were made, re-spectively, and n⫽ 21Ð60, n ⫽ 10Ð60, and n ⫽ 20Ð60 ßowers were collected from each crop for each bout, respectively. Counts of thrips in cucumber ßowers were made in research greenhouses at the Green-house and Processing Crops Research Center, Har-row, Ontario, Canada from 1996 to 1998. Counts of thrips in impatiens ßowers were made in research greenhouses at Cornell University from 1999 to 2003, as were counts of thrips in marigolds from 2005 to 2006.
Operational Sampling Techniques (In Situ). Composite flower (marigold). In practice, in situ counts of thrips are more feasible than the examina-tion of ßowers in a laboratory after collecexamina-tion. Two techniques were tested to determine the utility of in situ counts of thrips with respect to incidence-mean models; ßower tapping and visual inspection. Twenty fully-expanded, nonsenescent marigold ßowers were arbitrarily selected by each of two samplers from all areas of the plot including edges and the center, to test the two sampling techniques (n ⫽ 10 ßowers per sampler per technique). The ßower tapping technique involved picking and holding the ßower head at its base and then subjecting the ßower head to Þve vig-orous ßicks with the middle Þnger over a single sheet of 21⫻ 28-cm white paper. The visual enumeration technique entailed picking a ßower and searching for thrips among and within the inßorescences and de-veloping seeds. All in situ thrips enumeration was conducted with the unaided eye and a maximum of Þve thrips were counted before moving to the next ßower. All ßower samples were ultimately placed into a 100-ml snap-cap vial Þlled with 70% ethanol, brought into the laboratory and the actual number of thrips per ßower assessed with the aid of a microscope by de-structive sampling; these samples are referred to later
as complete counts. Laboratory counts of thrips were paired with in situ counts of thrips to estimate bias for each thrips sampling technique and for use in gener-ating incidence-mean models. Sampling was per-formed weekly on Þve separate dates in 3, 3, 2, 1, and 1 greenhouse(s) per date, respectively, for 20 sam-pling bouts in total.
Simple Flower (Impatiens). Because thrips are eas-ier to locate in simple ßowers, a single technique, visual inspection, was tested to determine the utility of in situ counts in incidence-mean models. Forty-six samples of n⫽ 30 impatiens ßowers were made in three replicate greenhouses over a 21-d period by Þve samplers. The total time required to complete a sam-pling bout was recorded for each samsam-pling bout to determine if there was a relationship between sam-pling duration and the degree of bias in in situ esti-mates. A single impatiens ßower was picked from an arbitrary location within the plot (we sampled ßowers from the center and the edges of the plot) and the number of thrips up to a maximum of Þve, was deter-mined by visual inspection. After visual inspection, ßowers were immediately placed individually into 20 ml scintillation vials Þlled with 70% EtOH. All ßowers were ultimately brought back into the laboratory and the number of thrips per ßower counted under a dissecting microscope. Laboratory counts of thrips were paired with in situ counts of thrips to estimate the rate of bias for this thrips sampling technique and for use in generating incidence-mean models.
Influence of Incidence-Mean Models on Sampling Performance. While incidence-mean models serve as
the foundation for binomial sampling plans and to a large extent determine the performance of these plans, these models alone do not provide interpretable measures of sampling plan performance. Instead, one must examine OC functions when classiÞcation sam-pling is used and when parameter estimation is the objective, a measure of precision of the parameter estimate. In classiÞcation sampling, the objective is to place a population parameter into one of two or more categories (e.g., above or below an action threshold). ClassiÞcation sampling, in a management context, pro-vides explicit considerations of the likelihood of po-tential actions. If the objective is to classify a popu-lation as above or below some critical density (CD), the OC provides the probability of a below CD clas-siÞcation given any true density (Binns et al. 2000). There are several ways that estimation sampling plans can be evaluated, but a simple one is to determine the variance of the estimated parameter, which can in turn be used to construct conÞdence intervals (Binns et al. 2000). We calculated OC functions and conÞdence intervals for estimated means for candidate sampling plans and compared those to gauge the effects of the underlying incidence-mean models.
Classification Sampling. A critical density of two
thrips per ßower (Wang and Shipp 2001) was used to construct binomial count classiÞcation sampling plans based on 25 samples. Generation of OC functions requires a critical pest density, and while a critical thrips density has not yet been experimentally
deter-mined for cucumbers, marigolds or impatiens, we chose a critical pest density of two thrips per ßower as this represents a level of infestation considered intol-erable by many growers for a variety of crops. Bino-mial-count sample plans make use of a tally threshold (T) that is used to deÞne which sample observations are scored as infested or occupied and which are not. For example if T⫽ 0 then samples having one or more organisms will be scored as occupied. In general, the precision of incidence-mean models, as measured by model mean squared error (MSE), increases with in-creasing tally threshold up to some limit and then precision declines with further increase in T (Binns et al. 2000). Often binomial sampling becomes more dif-Þcult as T becomes larger. Operating characteristic functions were calculated using the methods de-scribed by Binns et al. (2000).
Statistical Analysis. For each sample bout for each
crop tested, we calculated the proportion of sample observations with⬎0 through Þve thrips (e.g., T ⫽ 0 through 5) and the mean number of thrips per ßower. Linear regression was used to relate the proportion of infested ßowers for each tally threshold (PT) to the mean number of thrips per ßower (m) (e.g., an inci-dence-mean model). The model was Þt for each level of T within a crop using the equation ln(m)⫽ a ⫹ b*ln(-ln[1-pT]), as well as for a composite data set comprised of all the crops that included crop as a factor to determine if plant species affected the inci-dence-mean relationship. Sample bouts with means in excess of 25 thrips per ßower were omitted from all
data sets to minimize the effect of the leverage of these high means on the Þt of the line to the incidence-mean model. The proportion of infested ßowers that was equal to 1, was replaced with 0.999999 as the natural log of one is 0. This served to keep these data points in the statistical model.
Incidence-mean models were Þt for the different in situ sampling techniques tested for impatiens and marigolds as above. Operating characteristic functions were generated using the methods described by Binns et al. (2000) for binomial count sample plans as well as for plans that used complete enumeration. In gen-eral, binomial count sampling plans perform poorer than those based on complete enumeration because complete enumeration provides greater information about each sample observation. Estimates of variance of the sample mean for complete counts were deter-mined using TaylorÕs Power Law and complete count 95% conÞdence intervals were calculated using these estimates. Binomial count (BC) 95% conÞdence in-tervals were estimated using variances generated as per Schaalje et al. (2001), which includes a combina-tion of biological, prediccombina-tion and sampling variance.
Results
Test of Incidence-Mean Model Fit as a Function of Crop Species. The results of incidence-mean modeling
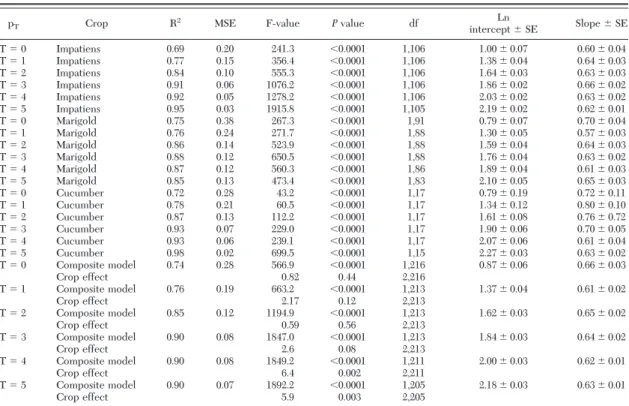
of laboratory-based counts of thrips in ßowers are presented in Table 1. Generally, the range of inci-dences (proportion of infested ßowers) for each tally Table 1. Regression parameters of laboratory-based counts of thrips for the incidence mean models for impatiens, marigolds, cucumbers and a composite model at six tally thresholds
pT Crop R
2
MSE F-value Pvalue df Ln
intercept⫾ SE Slope⫾ SE T⫽ 0 Impatiens 0.69 0.20 241.3 ⬍0.0001 1,106 1.00⫾ 0.07 0.60⫾ 0.04 T⫽ 1 Impatiens 0.77 0.15 356.4 ⬍0.0001 1,106 1.38⫾ 0.04 0.64⫾ 0.03 T⫽ 2 Impatiens 0.84 0.10 555.3 ⬍0.0001 1,106 1.64⫾ 0.03 0.63⫾ 0.03 T⫽ 3 Impatiens 0.91 0.06 1076.2 ⬍0.0001 1,106 1.86⫾ 0.02 0.66⫾ 0.02 T⫽ 4 Impatiens 0.92 0.05 1278.2 ⬍0.0001 1,106 2.03⫾ 0.02 0.63⫾ 0.02 T⫽ 5 Impatiens 0.95 0.03 1915.8 ⬍0.0001 1,105 2.19⫾ 0.02 0.62⫾ 0.01 T⫽ 0 Marigold 0.75 0.38 267.3 ⬍0.0001 1,91 0.79⫾ 0.07 0.70⫾ 0.04 T⫽ 1 Marigold 0.76 0.24 271.7 ⬍0.0001 1,88 1.30⫾ 0.05 0.57⫾ 0.03 T⫽ 2 Marigold 0.86 0.14 523.9 ⬍0.0001 1,88 1.59⫾ 0.04 0.64⫾ 0.03 T⫽ 3 Marigold 0.88 0.12 650.5 ⬍0.0001 1,88 1.76⫾ 0.04 0.63⫾ 0.02 T⫽ 4 Marigold 0.87 0.12 560.3 ⬍0.0001 1,86 1.89⫾ 0.04 0.61⫾ 0.03 T⫽ 5 Marigold 0.85 0.13 473.4 ⬍0.0001 1,83 2.10⫾ 0.05 0.65⫾ 0.03 T⫽ 0 Cucumber 0.72 0.28 43.2 ⬍0.0001 1,17 0.79⫾ 0.19 0.72⫾ 0.11 T⫽ 1 Cucumber 0.78 0.21 60.5 ⬍0.0001 1,17 1.34⫾ 0.12 0.80⫾ 0.10 T⫽ 2 Cucumber 0.87 0.13 112.2 ⬍0.0001 1,17 1.61⫾ 0.08 0.76⫾ 0.72 T⫽ 3 Cucumber 0.93 0.07 229.0 ⬍0.0001 1,17 1.90⫾ 0.06 0.70⫾ 0.05 T⫽ 4 Cucumber 0.93 0.06 239.1 ⬍0.0001 1,17 2.07⫾ 0.06 0.61⫾ 0.04 T⫽ 5 Cucumber 0.98 0.02 699.5 ⬍0.0001 1,15 2.27⫾ 0.03 0.63⫾ 0.02 T⫽ 0 Composite model 0.74 0.28 566.9 ⬍0.0001 1,216 0.87⫾ 0.06 0.66⫾ 0.03 Crop effect 0.82 0.44 2,216 T⫽ 1 Composite model 0.76 0.19 663.2 ⬍0.0001 1,213 1.37⫾ 0.04 0.61⫾ 0.02 Crop effect 2.17 0.12 2,213 T⫽ 2 Composite model 0.85 0.12 1194.9 ⬍0.0001 1,213 1.62⫾ 0.03 0.65⫾ 0.02 Crop effect 0.59 0.56 2,213 T⫽ 3 Composite model 0.90 0.08 1847.0 ⬍0.0001 1,213 1.84⫾ 0.03 0.64⫾ 0.02 Crop effect 2.6 0.08 2,213 T⫽ 4 Composite model 0.90 0.08 1849.2 ⬍0.0001 1,211 2.00⫾ 0.03 0.62⫾ 0.01 Crop effect 6.4 0.002 2,211 T⫽ 5 Composite model 0.90 0.07 1892.2 ⬍0.0001 1,205 2.18⫾ 0.03 0.63⫾ 0.01 Crop effect 5.9 0.003 2,205
threshold covered ⬎90% of the possible range (i.e., from 0 to 1.0). In only one instance did the range of incidences cover ⬍50% of the possible range; this occurred for cucumbers at T⫽ 0 (e.g., saturation of incidence in the model). As expected, the relationship between incidence of infested ßowers and mean thrips per ßower improved as T increased, as indicated by lower mean squared errors (MSE); this was true for all three crops as well as for the composite model, which was Þt across plant species. MSE was relatively stable at T⫽ 3, T ⫽ 4 and T ⫽ 5 for all three crops and the composite model. Because thrips can be difÞcult to count, we would like to choose the level of T that balances the number of thrips needing to be counted while maximizing sample precision. We judged this to occur at T⫽ 3 for each crop based on the steepness of the OC functions (Fig. 1) as this takes into account the intercept, the slope and variation about the inci-dence-mean model. When the composite model was Þt for T⫽ 3, there was not a signiÞcant effect of crop on the relationship between incidence of infested ßowers and mean thrips per ßower (F[2,213]⫽ 2.6, P ⫽
0.08); however, at T ⫽ 4 and T ⫽ 5 there was a signiÞcant crop effect (Table 1).
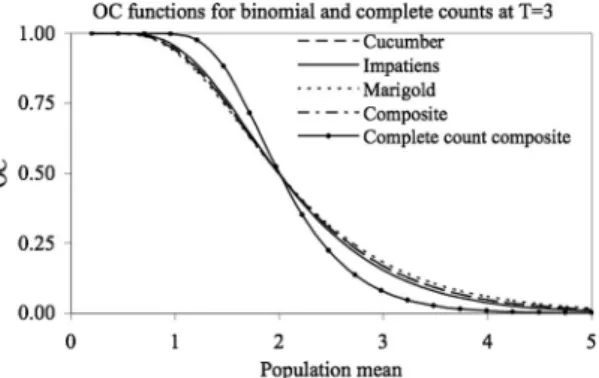
The OC functions for the three crops and the com-posite model at T⫽ 3 (Fig. 2) are nearly identical indicating that use of the composite model when sam-pling thrips for classiÞcation in impatiens, marigold or cucumber would not affect sample outcomes. Maxi-mizing information from each sample by counting all of the thrips results in improved sample plan perfor-mance as reßected in the OC function for complete counts with a composite model (Fig. 2). However, the difference between binomial and complete counts does not preclude use of binomial count sampling. Although we chose an unconÞrmed critical density (i.e., not related to actual damage) informed only by the opinions of growers and scouts, this will not ap-preciably affect the inferences drawn regarding the inßuence of plant species (ßower type) on sample plan performance.
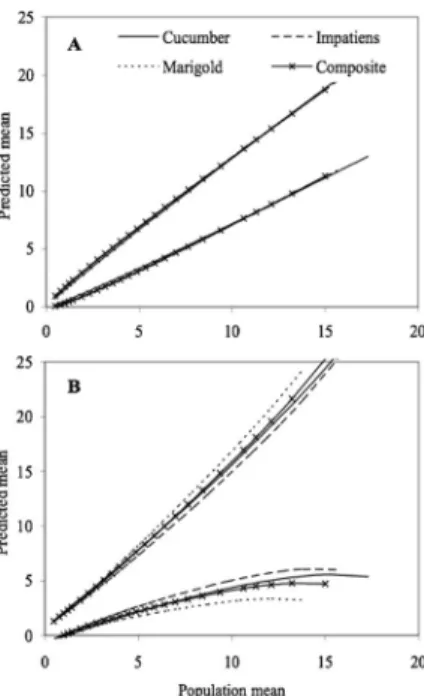
Ninety Þve percent binomial and complete count conÞdence intervals of thrips abundance predicted from the composite incidence-mean model are also not substantially different from those for the crop-speciÞc models (Fig. 3) especially in the area of in-terest (0 Ð5 thrips per ßower). TaylorÕs power law (TPL) regressions yielded similar slopes for impatiens, marigolds and the composite model (1.25, 1.20 and 1.24, respectively) whereas the slope for cucumbers was slightly higher at 1.52. The TPL regression for the composite model was not affected by crop (F[2,216]⫽ 1.6, P⫽ 0.21).
Operational Sampling Techniques (In Situ). The
results of incidence-mean modeling of in situ-counts of thrips in simple and complex ßowers using different sampling techniques are presented in Table 2. Several of the ranges of incidences within a crop and sampling technique were not large, covering only⬇50% of the possible range (i.e., impatiens visual T⫽ 5, marigold tap T⫽ 4, T ⫽ 5, marigold visual TÕs ⫽ 2Ð5). As the tally threshold of thrips per ßower increased from 0 to 5, the relationship between the proportion of ßowers clas-siÞed as infested and the mean number of thrips
im-Fig. 1. Operating characteristic functions at tally thresh-olds (T) 1Ð5 for laboratory-based binomial counts of thrips in a) cucumber, b) impatiens, and c) marigold ßowers.
Fig. 2. Operating characteristic function at a tally thresh-old of three (T⫽ 3) for laboratory-based binomial counts of thrips in cucumber, marigold, and impatiens ßowers and a composite data set comprised of counts from all three plant species.
proved when marigolds were sampled but was variable for impatiens. The tally thresholds for the two sam-pling methods by ßower type combinations that pro-vided the best relationship between incidence and mean as measured by the steepness of the OC func-tions were T⫽ 1, T ⫽ 0, and T ⫽ 1 for impatiens visual inspections, marigold visual inspections and marigold ßower taps, respectively (Fig. 4). Visual binomial counts of thrips on impatiens in situ (T⫽ 1) compared with estimates of laboratory-based incidence
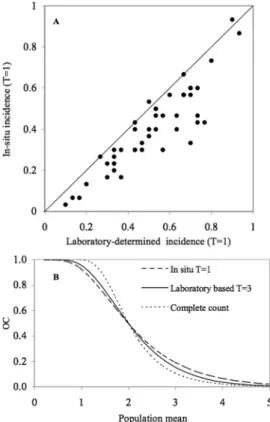
esti-mates of thrips in impatiens ßowers showed that in situ counts are biased, underestimating actual thrips abun-dance (Fig. 5a). The in situ OC function and the laboratory-based binomial count OC function were nearly identical (Fig. 5b). The difference between plots of binomial and complete count OC functions represent the added variability associated with using binomial count models versus complete count models, which are always more precise (Fig. 5b).
A very pronounced difference was found in the effectiveness of the two sampling methods tested for marigold ßowers in situ. Inspection of the relationship between in situ incidence and laboratory-determined incidence reveals that using counts of thrips from ßower taps to determine the incidence of infested marigold ßowers provided a less biased estimate of actual thrips density compared with visual inspections (Fig. 6a). The shape of the binomial count OC func-tions for the two sampling methods (Fig. 6b) shows a much ßatter OC function for visual inspection of mari-golds compared with ßower tapping and laboratory-based count models. Thus, visual inspection of mari-golds will lead to increased erroneous classiÞcation compared with tapping. All binomial count proce-dures were less precise than making complete counts of thrips (Fig. 6b).
Discussion
Because thrips are small and can be difÞcult to count, binomial count sampling is preferred to com-plete enumeration. Complicating the development of such a sampling plan is the fact that numerous crop species are often grown concurrently within the same greenhouse. It is impractical to use a different inci-dence mean model and hence sampling plans for each crop; a generic sampling plan would be much more useful. We compared incidence-mean models for thrips in ßowers from three different greenhouse crops, garden impatiens, fresh market cucumber and
Fig. 3. Plots of a) 95% complete count conÞdence limits and b) 95% binomial count conÞdence limits for laboratory-based counts of thrips in cucumber, marigold, and impatiens ßowers and a composite data set comprised of counts from all three plant species at a tally threshold of three thrips per ßower (T⫽ 3).
Table 2. Regression parameters of in situ counts of thrips infesting impatiens and marigolds and the effect of tally threshold and sampling method
pT Crop Sampling method R2 MSE F-value Pvalue df
Ln intercept⫾ SE Slope⫾ SE T⫽ 0 Impatiens Visual 0.74 0.14 124.8 ⬍0.0001 1,44 1.37⫾ 0.06 1.10⫾ 0.10 T⫽ 1 Impatiens Visual 0.81 0.11 185.7 ⬍0.0001 1,44 1.83⫾ 0.07 0.80⫾ 0.06 T⫽ 2 Impatiens Visual 0.70 0.14 102.7 ⬍0.0001 1,43 2.05⫾ 0.10 0.64⫾ 0.06 T⫽ 3 Impatiens Visual 0.64 0.17 73.7 ⬍0.0001 1,42 2.17⫾ 0.12 0.54⫾ 0.06 T⫽ 4 Impatiens Visual 0.63 0.18 67.3 ⬍0.0001 1,39 2.34⫾ 0.14 0.57⫾ 0.07 T⫽ 5 Impatiens Visual 0.52 0.24 9.7 0.01 1,9 2.52⫾ 0.36 0.49⫾ 0.16 T⫽ 0 Marigold Visual 0.67 0.52 85.9 ⬍0.0001 1,43 2.34⫾ 0.16 0.95⫾ 0.10 T⫽ 1 Marigold Visual 0.47 0.50 28.9 ⬍0.0001 1,32 2.92⫾ 0.26 0.75⫾ 0.14 T⫽ 2 Marigold Visual 0.34 0.33 11.7 0.002 1,23 2.94⫾ 0.29 0.51⫾ 0.15 T⫽ 3 Marigold Visual 0.66 0.14 29.7 ⬍0.0001 1,15 3.89⫾ 0.33 0.87⫾ 0.16 T⫽ 4 Marigold Visual 0.54 0.17 15.2 0.002 1,13 3.82⫾ 0.43 0.77⫾ 0.20 T⫽ 5 Marigold Visual InsufÞcient samples
T⫽ 0 Marigold Tap 0.84 0.28 255.6 ⬍0.0001 1,49 1.61⫾ 0.08 1.07⫾ 0.07 T⫽ 1 Marigold Tap 0.73 0.19 103.0 ⬍0.0001 1,38 2.15⫾ 0.09 0.73⫾ 0.07 T⫽ 2 Marigold Tap 0.67 0.20 70.0 ⬍0.0001 1,35 2.51⫾ 0.13 0.73⫾ 0.09 T⫽ 3 Marigold Tap 0.54 0.29 38.8 ⬍0.0001 1,33 2.61⫾ 0.17 0.62⫾ 0.10 T⫽ 4 Marigold Tap 0.47 0.35 23.6 ⬍0.0001 1,27 2.85⫾ 0.24 0.64⫾ 0.13 T⫽ 5 Marigold Tap 0.69 0.10 45.9 ⬍0.0001 1,21 3.07⫾ 0.17 0.57⫾ 0.08
marigolds, to evaluate the possibility of using a generic model for sampling thrips. As a Þrst step toward the development of a sampling plan for F. occidentalis infesting ßowering greenhouses crops, it was Þrst nec-essary to determine whether or not incidence-mean models precisely described the relationship between the proportion of ßowers infested and mean thrips abundance. This relationship was determined for tally thresholds of thrips per ßower ranging from⬎0Ð5 to determine which tally threshold best described the relationship. All counts of thrips were conducted in the laboratory and we determined that proportions of infested ßowers calculated using a tally threshold of three thrips per ßower was best for each crop tested as well as for a composite data set, suggesting that a generic sampling plan may be possible for multiple ßowering plant species.
Because it is impractical for growers and or scouts to collect ßowers and count thrips with the aid of a microscope, it became necessary to develop sampling techniques for use in greenhouses. Given that there are two distinct ßower architectures, simple versus
composite, we decided to test sampling techniques for both ßower types to determine if a single sampling technique could be used across ßower types. We dis-covered that in our complex ßower (marigolds) counts of thrips made by visual inspection were not good predictors of mean thrips abundance. Visual in-spections were difÞcult to conduct and immature thrips, which range in color from white to yellow to orange, were exceptionally difÞcult to discriminate against the marigold ßower petals, which range in color from yellow to dark-orange. Additionally, the architecture of marigold ßowers is such that the total surface area needing inspection is large and irregular, and immature thrips moved quickly among the achenes, ray and disk ßowers adding to the difÞculty of quantiÞcation. This led to an underestimate of in-cidence, and when our in situ counts were conÞrmed in the laboratory, we discovered a large degree of bias in our counts. The OC curve for binomial counts of thrips in marigold ßowers as determined via visual inspection was much ßatter than ßower taps and that of the complete count (laboratory conÞrmation) OC function. Visual inspections of fully opened, nonse-nescent impatiens ßowers, while easier than visual inspection of thrips in marigolds, presented a few minor problems; speciÞcally, quantiÞcation of Þrst
in-Fig. 4. Operating characteristic functions at tally thresh-olds (T) raging from 0 to Þve for greenhouse-based a) visual inspections of impatiens, b) visual inspections of marigold ßowers, and c) marigold ßower taps.
Fig. 5. A) Scatter plot of incidences generated from binomial counts of thrips conducted in situ versus the lab-oratory, and b) binomial count and complete count operating characteristics of in situ, laboratory-based and complete counts of thrips in impatiens. The diagonal line represents the zero bias line.
stars. White impatiens were used in this study, and Þrst instars range in color from a translucent white to light yellow making it difÞcult to detect them on the ßower petals. While we did not categorize any of our in situ counts of thrips into groups of adults and immatures, we did split our laboratory-based counts. Generally, immature thrips in crops of both marigolds and im-patiens comprised 70 Ð 80% of the total population on average across the entire cropping cycle (data not shown), indicating that the largest amount of bias associated with in situ counts occurs in the quantiÞ-cation of immature thrips. Presumably bias could be decreased by improving the training of scouts, and by providing an inexpensive, easy to use OptiVISOR (Donegan Optical Company Inc., Lenexa, KS) or hand lenses, which were not used in this study.
An important criterion of a well-designed sampling plan is practicality and time efÞciency (Binns et al. 2000). In this study, samplers were asked to sample 10 marigold ßowers, or 30 impatiens ßowers using the in situ methods previously described with a stop bound-ary of six thrips/ßower (i.e., stop counting if you reach
a tally of six thrips/ßower). Time per sample bout was recorded to provide estimates of time per sample. Generally, visual inspection of impatiens ßowers was the most time efÞcient (30 s/ßower), followed by marigold ßower taps (44 s/ßower) and visual inspec-tions of marigolds (1.2 min/ßower). Given that 1) marigold ßower taps were more effective than visual inspection of marigold ßowers, 2) we used a stop boundary of six thrips per ßower and 3) that for mari-gold ßower taps and visual inspection of impatiens ßowers a tally threshold of T⫽ 1 provided the best relationship between incidence of infested ßowers and mean thrips abundance, the estimates of time actually required to conduct a sampling bout/time per ßower are overestimated as a stop boundary of T⫽ 1 has been deemed most appropriate.
One of the limitations of this study is that it is speciÞc for F. occidentalis, whereas thrips infestations in greenhouses may be mixed species. While this is true, the spatial aggregation pattern of some of the most common ßower thrips species occurring in greenhouses (e.g., F. tritici [Fitch]) have been shown to be aggregated within ßowers (Salguero Navas et al. 1994). The spatial distribution of an organism as mea-sured by TaylorÕs power law has been demonstrated to be remarkably robust when the sampling technique/ unit is the same across distribution areas (e.g., thrips in ßowers, thrips on sticky traps) (Taylor et al. 1998) suggesting that this sampling plan may be useful for additional thrips species, however, this would need to be veriÞed.
When counts of thrips are made with virtually no observer bias, as in laboratory-based counts, binomial count sampling using a composite incidence-mean model provides nearly equal classiÞcation precision as compared with making complete counts. In situ counts of thrips from simple ßowers were able to produce acceptable classiÞcation precision when us-ing binomial count samplus-ing as seen in the nearly identical OC functions for in situ-binomial and com-plete count data. However, in situ counts of composite ßowers lead to an unacceptable level of observer bias, which in turn decreases classiÞcation precision result-ing in OC functions for binomial count samplresult-ing that are likely unacceptable. This problem could be rem-edied by the development of in situ thrips sampling procedures that minimizes observer bias. Addition-ally, given that the in situ counts of thrips in simple ßowers produced acceptable levels of classiÞcation precision, it may be possible to use these counts to estimate the level of thrips infestation within a green-house, including complex ßowers. However, a suitable indicator plant would need to be at least as attractive to thrips as production plants, must be located throughout a greenhouse, and must give true indica-tions of thrips abundance. Given the complicated nature of greenhouse operations, staggered cropping cycles, frequent moving of plants between green-houses as they require greater spacing, and a host of other factors, this may prove difÞcult. The alternative to assessing thrips population densities in mixed ßoral
Fig. 6. A) Scatter plot of incidences of in situ binomial counts versus laboratory-based binomial counts of incidence, and b) binomial count operating characteristic functions calculated from visual, tapping and laboratory assessments of thrips per ßower and laboratory determined complete count OC functions. The diagonal line represents the zero bias line.
crops that include both simple and complex ßowers is to use the current industry standard, sticky cards.
Acknowledgments
This research was funded in part through a SpeciÞc Co-operative Agreement between the USDA-ARS Biological In-tegrated Pest Management Research Unit and the Cornell University Department of Entomology, Ithaca, NY (SpeciÞc Cooperative Agreement 58-1907-4-447) funded by the USDA-ARS, as part of the Floriculture and Nursery Research Initiative.
References Cited
Binns, M. R., J. P. Nyrop, and W. van der Werf. 2000.
Sam-pling and monitoring in crop protection: the theoretical basis for developing practical decision guides. CABI Pub-lishing, Wallingford, UK.
Boll, R., C. Marchal, C. Poncet, and L. Lapchin. 2007. Rapid
visual estimation of thrips (Thysanoptera: Thripidae) densities on cucumber and rose crops. Econ. Entomol. 100: 225Ð232.
Bryan, D. E., and R. F. Smith. 1956. The Frankliniella
occi-dentalis (Pergande) complex in California (Thys-anoptera: Thripidae). University of California Publica-tion: Entomol. 10: 359 Ð 410.
Chander, R., and K. L. Verma. 1978. A technique of
sam-pling blossom thrips of apple. Ind. J. Entomol. 40: 453.
De Courcy Williams, M. E. 2001. Biological control of thrips
on ornamental crops: Interactions between the predatory mite Neoseiulus cucumeris (Acari: Phytoseiidae) and western ßower thrips, Frankliniella occidentalis (Thys-anoptera: Thripidae), on cyclamen. Biocontrol Sci. Tech. 11: 41Ð55.
Edelson, J. V. 1985. A sampling method for estimating
ab-solute numbers of thrips on onions. Southwest Entomol. 10: 103Ð106.
Gillespie, D. R., and R. S. Vernon. 1990. Trap catch of
west-ern ßower thrips (Thysanoptera: Thripidae) as affected by color and height of sticky traps in mature greenhouse cucumber crops. J. Econ. Entomol. 83: 971Ð975.
Gonzalez, D., and L. T. Wilson. 1982. A food-web approach
to economic thresholds: A sequence of pests/predaceous arthropods on California cotton. Entomophaga 27: 31Ð 43.
Gonzalez, D., B. R. Patterson, T. F. Leigh, and L. T. Wilson. 1982. Mites: A primary food source for two predators in
San Joaquin Valley cotton. Calif. Agric. 36: 18 Ð20.
Haselwood, E. L. 1983. Handbook of Hawaiian weeds.
Uni-versity of Hawaii, Honolulu.
Henneberry, T. J., F. F. Smith, and D. Shriver. 1964. Flower
thrips in outdoor rose Þelds and an improved method of extracting thrips from rose ßowers. J. Econ. Entomol. 57: 410 Ð 412.
Higgins, C. 1992. Western ßower thrips (Thysanoptera:
Thripidae) in greenhouses: population dynamics, distri-bution on plants and associations with predators. J. Econ. Entomol. 85: 1891Ð1903.
Irwin, M. E., and K. V. Yeargan. 1980. Sampling
phytopha-gous thrips on soybean, pp. 283Ð304. In M. Kogan (ed.), Sampling methods in soybean entomology. Springer, New York.
Jacobson, R. J. 1997. Integrated pest management (IPM) in
glasshouses, pp. 639 Ð 666. In T. Lewis (ed.), Thrips as crop pests. CAB International, Wallingford, United Kingdom.
Lewis, T. 1973. Thrips: their biology, ecology and economic
impatience. Academic, London and New York.
Lewis, T. 1997. Thrips as crop pests. CAB International,
Wallingford, United Kingdom.
Pearsall, I. A., and J. H. Meyers. 2000. Evaluation of
sam-pling methodology for determining the phenology, rela-tive density, and dispersion of western ßower thrips (Thysanoptera: Thripidae) in nectarine orchards. J. Econ. Entomol. 93: 494 Ð502.
Pickett, C. H., L. T. Wilson, and D. Gonza´lez. 1988.
Popu-lation dynamics and within-plant distribution of the west-ern ßower thrips (Thysanoptera: Thripidae), an early-season predator of spider mites infesting cotton. Environ. Entomol. 17: 551Ð559.
Rhainds, M., and L. Shipp. 2003. Dispersal of adult western
ßower thrips (Thysanoptera: Thripidae) on chrysanthe-mum plants: impact of feeding-induced senescence on inßorescences. Environ. Entomol. 32: 1056 Ð1065.
Rosenheim, J. A., S. C. Welter, M. W. Johnson, R.F.L. Mau, and L. R. Gusukuma-Minuto. 1990. Direct feeding
dam-age on cucumber by mixed-species infestations of Thrips
palmi and Frankliniella occidentalis (Thysanoptera: Thripidae). J. Econ. Entomol. 83: 1519 Ð1525.
Salguero Navas, V. E., J. E. Funderburk, T. P. Mack, R. J. Beshear, and S. M. Olson. 1994. Aggregation indices and
sample size curves for binomial sampling of ßower-in-habiting Frankliniella species (Thysanoptera: Thripidae) on tomato. J. Econ. Entomol. 87: 1622Ð1626.
Schaalje, G. B., R. A. Butts, and T. Lysyk. 2001. Simulation
studies of binomial sampling: a new variance estimator and density predictor, with special reference to the Rus-san wheat aphid. J. Econ. Entomol. 84: 140 Ð147.
Seaton, K. A., D. F. Cook, and D. C. Hardie. 1997. The
effectiveness of a range of insecticides against western ßower thrips (Frankliniella occidentalis) (Thysanoptera: Thripidae) on cut ßowers. Aust. J. Agric. Res. 48: 781Ð787.
Shipp, J. L., and N. Zariffa. 1991. Spatial patterns of and
sampling methods for western ßower thrips (Thys-anoptera: Thripidae) on greenhouse sweet pepper. Can. Entomol. 123: 989 Ð1000.
Steiner, M. Y. 1990. Determining population characteristics
and sampling procedures for the western ßower thrips (Thysanoptera: Thripidae) and the predatory mite
Am-blyseius cucumeris(Acari: Phytoseiidae) on greenhouse cucumber. Environ. Entomol. 19: 1605Ð1613.
Taylor, L. R. 1961. Aggregation, variance and the mean.
Nature 189: 732Ð755.
Taylor, R.A.J., R. K. Lindquist, and J. L. Shipp. 1998.
Vari-ation and consistency inspatial distribution as measured by TaylorÕs power law. Environ. Entomol. 27: 191Ð201.
Terry, L. I., and G. DeGrandi-Hoffman. 1988. Monitoring
western ßower thrips (Thysanoptera: Thripidae) in “Granny Smith” apple blossom clusters. Can. Entomol. 120: 1003Ð1016.
Wang, K., and J. L. Shipp. 2001. Sequential sampling plans
for western ßower thrips (Thysanoptera: Thripidae) on greenhouse cucumber. J. Econ. Entomol. 94: 579 Ð 585.
Yudin, L. S., J. J. Cho, and W. C. Mitchell. 1986. Host range
of western ßower thrips, Frankliniella occidentalis (Thy-sanoptera: Thripidae), with special reference to Leucaena
glauca.Environ. Entomol. 15: 1292Ð1295.
Yudin, L. S., W. C. Mitchell, and J. J. Cho. 1987. Color
preference of thrips (Thysanoptera: Thripidae) with reference to aphids (Homoptera: Aphididae) and leafminers in Hawaiian lettuce farms. J. Econ. Entomol. 80: 51Ð55.
Ugine, T. A., J. P. Sanderson, and S. P. Wraight. 2006.
With-in-plant and temporal distribution of nymphal and adult western ßower thrips, Frankliniella occidentalis
(Thys-anoptera: Thripidae), on ßowers and foliage of green-house impatiens, Impatiens wallerana, and implications for pest population sampling. Environ. Entomol. 35: 507Ð 515.
Ugine, T. A., S. P. Wraight, and J. P. Sanderson. 2007. Effects
of manipulating spray-application parameters on efÞcacy
of the entomopathogenic fungus Beauveria bassiana against western ßower thrips, Frankliniella occidentalis, infesting greenhouse impatiens crops. Biocontrol Sci. Tech. 17: 193Ð219.