© The Author 2014. Published by Oxford University Press on behalf of the Maryland Psychiatric Research Center. All rights reserved. For permissions, please email: [email protected]
Aberrant Current Source-Density and Lagged Phase Synchronization of Neural
Oscillations as Markers for Emerging Psychosis
Avinash Ramyead1, Michael Kometer2, Erich Studerus1, Susan Koranyi1, Sarah Ittig1, Ute Gschwandtner3, Peter Fuhr3, and Anita Riecher-Rössler*,1
1University of Basel Psychiatric Clinics, Center for Gender Research and Early Detection, Basel; 2Neuropsychopharmacology and
Brain Imaging Research Unit, Psychiatric University Hospital, Zurich; 3Department of Neurology, University Hospital Basel, Basel,
Switzerland
*To whom correspondence should be addressed; Center for Gender Research and Early Detection, University of Basel Psychiatric Clinics, Kornhausgasse 7, CH-4051 Basel, Switzerland; tel: +41-61-325-81-61, fax: +41-61-325-81-60, e-mail: [email protected]
Background: Converging evidence indicates that neural
oscillations coordinate activity across brain areas, a process which is seemingly perturbed in schizophrenia. In particu-lar, beta (13-30 Hz) and gamma (30–50 Hz) oscillations were repeatedly found to be disturbed in schizophrenia and linked to clinical symptoms. However, it remains unknown whether abnormalities in current source density (CSD) and lagged phase synchronization of oscillations across distrib-uted regions of the brain already occur in patients with an at-risk mental state (ARMS) for psychosis. Methods: To further elucidate this issue, we assessed resting-state EEG data of 63 ARMS patients and 29 healthy controls (HC). Twenty-three ARMS patients later made a transition to psychosis (ARMS-T) and 40 did not (ARMS-NT). CSD and lagged phase synchronization of neural oscillations across brain areas were assessed using eLORETA and their relationships to neurocognitive deficits and clinical symptoms were analyzed using linear mixed-effects models.
Results: ARMS-T patients showed higher gamma activity
in the medial prefrontal cortex compared to HC, which was associated with abstract reasoning abilities in ARMS-T. Furthermore, in ARMS-T patients lagged phase synchro-nization of beta oscillations decreased more over Euclidian distance compared to ARMS-NT and HC. Finally, this steep spatial decrease of phase synchronicity was most pro-nounced in ARMS-T patients with high positive and nega-tive symptoms scores. Conclusions: These results indicate that patients who will later make the transition to psychosis are characterized by impairments in localized and synchro-nized neural oscillations providing new insights into the pathophysiological mechanisms of schizophrenic psychoses and may be used to improve the prediction of psychosis.
Key words: schizophrenia/at-risk mental state
(ARMS)/resting state/EEG
Introduction
Converging evidence suggests that an impaired dynamic coordination of activity across distributed brain areas underlies the cognitive and behavioral abnormalities that characterize psychosis.1–4 Neural oscillations coordinate distributed activity through phase synchronization,5 and patients with schizophrenia display altered neural oscil-lations, particularly in the beta (13–30 Hz) and gamma (30–50 Hz) frequency bands.3,6 Together, these findings suggest that alterations in higher frequency oscillations and their phase synchronization may disrupt coordinated activity across distributed cortical areas, thereby leading to the formation of psychotic symptoms and cognitive impairments.
Gamma oscillations are strongly associated with the integration of cognitive information7–9 and have been shown to be consistently perturbed in patients with schizophrenia.3,10,11 Interestingly, both an elevated and reduced gamma activity has been reported in patients with schizophrenia.12 However, an increase has consistently been found in unmedicated patients experiencing positive symptoms (such as hallucinations and delusions), while the reverse is apparent in those suffering from negative symptoms (such as social withdrawal, lack of motiva-tion, and flat affect).11,12 Although both gamma and beta oscillations synchronize with enhanced precision over small distances, the beta oscillations have been shown to be particularly important in modulating long-range syn-chronization,13,14 which is the interaction among widely distributed neocortical regions. For instance, the phase synchronization of beta oscillations between extra-striate areas15 and between temporo-parietal areas16 have been shown to mediate attentional processes. Interestingly, all these processes are deeply perturbed in patients with
schizophrenia,17–19 further suggesting a disturbed long-ranged neural communication. As a coordinator of these large-network interactions, the beta frequency is there-fore a prime candidate to be studied.
Although several EEG studies have been conducted on first episode psychosis (FEP) and chronic schizophrenia patients, studies on prodromal patients are scarce. This is unfortunate because schizophrenia is now increasingly seen as a neurodevelopmental disorder20 and thus study-ing neurophysiological abnormalities in at-risk mental state (ARMS) patients would offer a unique opportunity to unravel the etiopathology of the disease.19 Furthermore, previous studies on ARMS patients21,22–24 did not make use of electrophysiological neuroimaging methods such as eLORETA which allows a reliable source localization of brain activity along with various connectivity analyses of frequencies.25 Moreover, studies were frequently based on patients treated with antipsychotic drugs, which could have severely obfuscated the discovery of neurophysi-ological correlates of psychopathology.26
Thus, we compared beta and gamma oscillations in 3 relatively large and antipsychotic-naive groups, ie, ARMS patients with later transition to psychosis (ARMS-T), ARMS patients without later transition to psychosis (ARMS-NT) and healthy controls (HC). We not only assessed the current source density (CSD) at these fre-quency bands, but also their lagged phase synchroni-zation across brain areas as a function of Euclidian distance. We hypothesized that ARMS-T patients would demonstrate abnormal CSD in both the high gamma and beta frequency bands when compared with ARMS-NT and HC. Furthermore, we postulated that the lagged phase synchronization of beta, the long-range modula-tor, would be more decreased in ARMS-T compared to ARMS-NT and HC as a function of increasing Euclidian distance.
Methods
Setting and Recruitment
The EEG data analyzed in this study were collected as part of the Basel Früherkennung von Psychosen (FePsy)
project, a prospective multilevel study, which aims to improve the early detection of psychosis.27 The study was approved by the ethics committee of the University of Basel, and all participants provided written informed con-sent. Patients recruited for this study were help-seeking consecutive referrals to the FePsy Clinic at the University
Psychiatric Clinics Basel, which was specifically set up to identify, assess, and treat individuals in the early stages of psychosis.
Screening Procedure
We used the Basel Screening Instrument for Psychosis (BSIP)28 to identify ARMS individuals. The BSIP is
based on the PACE inclusion/exclusion criteria29 and has been shown to have a high predictive validity and a good interrater reliability.28 Exclusion criteria for patients were age younger than 18 years, insufficient knowledge of German, IQ < 70, previous episode of schizophrenic psychosis (treated with major tranquilizers for >3 weeks [lifetime] and 125 mg chlorpromazine equivalent/day), psychosis clearly due to organic reasons or substance abuse, or psychotic symptoms within a clearly diag-nosed depression or borderline personality disorder. For this study, we included all ARMS patients that were recruited for the FePsy study between March 2000 and
August 2013 and had a clinical EEG session of at least 15 min at baseline assessment. They were followed-up at regular intervals in order to distinguish those who later transitioned to frank psychosis (ARMS-T) from those who did not (ARMS-NT). During the first year of the follow-up, ARMS individuals were assessed for transi-tion to psychosis monthly, during the second and third years 3-monthly, and thereafter annually using the tran-sition criteria of Yung et al.29 In this study, individuals were only classified as ARMS-NT if they had a follow-up duration of at least 3 years and did not develop frank psychosis. HC were recruited from trade schools, hospital staff, and through advertisements. Inclusion criteria for the healthy participants were: no history of psychiatric or neurological disease, no past or present substance abuse or head trauma.
EEG Recordings and Data Acquisition
EEG data were recorded at the University Hospital of Basel. Patients sat in a quiet room during eyes closed resting-state condition for about 20 min. Every 3 min, subjects were asked to open their eyes for a period of 5–6 s. At any signs of behavioral and/or EEG drowsiness, the patients were verbally asked to open their eyes. EEG data were sampled at a rate of 250 Hz by 19 gold cup electrodes (Nicolet Biomedical, Inc.) referenced to linked ears. Electrodes impedances were kept below 5Ω.
Artifact Rejection
EEG pre-processing was performed using Brain Vision Analyzer 2.0 software (Brain Products GmbH). We pro-cessed each EEG in parallel split into 2 branches, one fil-tered at 0.5 Hz and one at 1 Hz. We did so in order to apply the ICA matrix from the most stable signal (1 Hz) to the one that conserved the most signal (0.5 Hz). Both branches were handled in the same way up to the step that involved re-referencing to the common average. As a first step, artifact rejection was performed manually, based on visual inspec-tion, to remove epochs containing extreme ocular artifacts, muscles and/or cardiac contamination and bad signals due to random movements. Biased extended Infomax ICA analyses were then performed for the removal of residual eye movements, eye-blinking, muscles and non-biological
components contaminated with high gamma frequencies of 50 Hz and above as measured by Fast Fourier Transform (FFT) of the ICA components (resolution at 1 Hz, power μV2, hanning window length of 10%). After applying the
ICA corrected matrix of the data filtered at 1 Hz to the one filtered at 0.5 Hz, we re-referenced the data to common average. Finally, another manual rejection based on visual inspection was performed to exclude remaining artifacts as mentioned above.
EEG Current Source Localization Density Analysis
To compute the cortical CSD of neural oscillations, we used exact low-resolution electromagnetic tomography (eLORETA)25 on EEG data segmented into 2s epochs (on average 669 segments per subject). Patient groups did not significantly differ in number of segments. eLORETA is a neurophysiological imaging technique based on a weighted minimum norm inverse solution procedure allowing for the 3D modeling of the EEG CSD with an exact localization performance, but with a high cor-relation of neural sources that are in close proximity. Numerous studies based on neuroimaging tools, such as functional30,31 and structural magnetic resonance imag-ery (MRI),32 positron emission tomography (PET),33–35 and intracranial EEG recordings,36,37 have validated LORETA as an efficient and reliable tool to study brain activity. Compared with the first version of LORETA,38 eLORETA has no localization bias in the presence of structured noise in simulated data.39
In eLORETA, a 3-shell spherical head model (brain, scalp, and skull compartments) is used and the solution space is restricted to the cortical gray matter/hippocampus, which comprises 6239 voxels of 5 mm × 5 mm × 5 mm each. The head model for computing the lead field is based on the Montreal Neurological Institute (MNI) brain MRI average.40
Lagged Phase Synchronization Analysis
For a spatially unbiased lagged phase synchronization analysis we defined regions of interests (ROIs) based on the MNI coordinates of the cortical voxel underlying the 19 electrode sites41 (for technical details, see supple-mentary appendix 3). We used a single voxel for each ROI because eLORETA’s spatial resolution is relatively low, and expanding the ROI to neighboring voxels could potentially bias the analysis due to the high correlation among them.41 Next, we computed the lagged phase syn-chronization between all 19 ROIs resulting in a relatively high number (ie, 171) of pairwise combinations. Lagged phase synchronization quantifies the non-linear relation-ship between 2 ROIs after the instantaneous zero-lag con-tribution has been removed. Removing this instantaneous zero-lag contribution has been shown to eliminate non-physiological artifacts, such as volume conduction, which biases relationship measurements such as instantaneous
connectivity.25 Finally, we used the statistical software R42 for calculating the distances between ROIs in 3D in order to asses local vs global phase synchronization. The Euclidian distance between ROI1 (x1, y1, z1) and ROI2 (x2,
y2, z2) were calculated using the Pythagorean theorem: √[(x2−x1)2 + (y2−y1)2 + (z2−z1)2] and were subsequently
standardized into z-scores.
Neurocognitive Assessment
In order to assess the participants’ non-verbal capabilities to process and integrate higher-order relationships between individual entities we used the Leistungsprüfsystem Scale 3 (LPS-3), a well-established German intelligence scale for assessing nonverbal (abstract reasoning) abilities.43 To assess working memory, we used the 2-back task of the Testbatterie zur Aufmerksamkeitsprüfung (TAP).44
Assessment of Positive and Negative Psychotic Symptoms
The Brief Psychiatric Rating Scale Expanded (BPRS-E)45,46 was used to assess positive and negative psychotic symp-toms. The positive psychotic symptom scale was based on the 4 items hallucinations, suspiciousness, unusual thought content, and conceptual disorganization and the negative psychotic symptom scale was based on the items blunted affect, psychomotor retardation and emotional withdrawal, as defined by Velligan et al.47
Statistical Analyses
In order to identify the CSD differences between groups (ARMS-NT vs HC, ARMS-T vs HC, ARMS-NT vs ARMS-T), we used statistical nonparametric mapping (SnPM).48 The use of SnPM in eLORETA has been validated49,50 and utilized in previous clinical studies.41,51 Differences in cortical oscillations between groups in each frequency band were assessed by voxel-by-voxel independent sample F-ratio-tests with a frequency wise normalization. To correct for multiple comparisons across all voxels and all fre-quencies, a total of 5000 permutations were used to calculate the critical probability threshold (5% probability level).
Next, CSD values were extracted at those ROI that dif-fered between groups and their association with LPS-3 and 2-back tasks performance scores was assessed by linear regression models using neuropsychological per-formance scores as dependent variables and CSD values, diagnostic group, age, and years of education as indepen-dent variables. To test whether the associations between CSD values and neuropsychological performance dif-fered between groups, an interaction term between group and CSD values was included. In addition to this ROI approach, a whole brain analysis was performed by cor-relating voxel-wise these performance measures with CSD. Furthermore, to correct for multiple testing, this whole brain analysis was based on 5000 permutations to
determine the empirical probability distribution for the maximal statistics under the null hypothesis.41,52
To assess group differences in lagged phase synchroni-zation, we fitted a linear mixed-effects model using lagged phase synchronization of the ROI pairs (171 pairs) as the dependent variable and Euclidian distance (within-subjects) and group (between-subjects) along with their interaction as independent variables. The model also included an intercept term that randomly varied per individual. To investigate the impact of positive and negative symptoms on the lagged phase synchronization as a function of anatomical distances, we applied linear mixed-effects models that additionally included BPRS positive and negative symptoms as indepen-dent variables. Furthermore, these analyses were repeated for each of the seven different frequencies and corrected for mul-tiple comparison using the Benjamini–Hochberg method.53 Results
Sample Description
Until August 2013, 134 ARMS patients and 97 HC were recruited for the FePsy study. Of these, 63 ARMS
and 29 HC had sufficient EEG and follow-up data to be included in the present study. Twenty-three of the included ARMS patients had made a transition to psy-chosis (ARMS-T) during the follow up and 40 had not (ARMS-NT). None of those who made a transition con-verted to psychotic mood disorder. The 71 ARMS indi-viduals that were excluded from this study did not differ from the included ARMS individuals with regard to gen-der, sex, years of education, and BPRS total and positive symptoms scores. Demographic and clinical characteris-tics of the 3 groups (ie, HC, ARMS-T, and ARMS-NT) are shown in table 1. There was a small overall differ-ence in age (P = .046), which was due to a lower age in HC compared to ARMS-NT, significant at a trend level (P = .053). Furthermore, ARMS-T patients had higher positive symptoms than ARMS-NT (P = .005). Almost all ARMS individuals were antipsychotic naïve; only 4 ARMS individuals (4/63) had received low doses of second-generation antipsychotic medication during no more than 3 weeks for behavioral control by the refer-ring psychiatrist or general practitioner prior to study inclusion.
Table 1. Demographic and Clinical Characteristics of HC, ARMS-T, and ARMS-NT Individuals
HC ARMS-NT ARMS-T P Value
N = 29 N = 40 N = 23 Gender .597 Women 14 (48.3%) 15 (37.5%) 11 (47.8%) Men 15 (51.7%) 25 (62.5%) 12 (52.2%) Age 22.4 (5.02) 26.5 (8.42) 26.3 (7.13) .046 Years of education 11.9 (1.93) 11.6 (3.49) 11.2 (2.41) .693 Antidepressants currently 1.000 No 30 (75.0%) 17 (73.9%) Yes 10 (25.0%) 6 (26.1%) Antipsychotics currently .619 No 38 (95.0%) 21 (91.3%) Yes 2 (5.00%) 2 (8.70%)
Mood stabilizer currently .365
No 40 (100%) 22 (95.7%) Yes 0 (0.00%) 1 (4.35%) Tranquilizer currently .713 No 35 (87.5%) 19 (82.6%) Yes 5 (12.5%) 4 (17.4%) BPRS positive symptoms 6.33 (2.39) 8.67 (2.71) .001 BPRS negative symptoms 5.60 (2.72) 5.40 (2.74) .795 BPRS total score 37.7 (10.5) 42.1 (9.89) .137 Risk group .116
Prepsychotic only (APS or BLIPS) 25 (62.5%) 18 (78.3%)
Genetic risk only 3 (7.50%) 0 (0.00%)
Mixed prepsychotic + genetic 6 (15.0%) 5 (21.7%)
Unspecific only 6 (15.0%) 0 (0.00%)
LPS (nonverbal IQ) 119 (9.31) 115 (10.6) 112 (14.3) .204
2-back task correct responses 13.5 (1.46) 12.0 (3.24) 11.2 (2.51) .044
Days between EEG and transition to psychosis 423 (449)
Note: HC, healthy controls; ARMS-NT, at-risk mental state patients without later transition to psychosis; ARMS-T, at-risk mental state patients with later transition to psychosis; BPRS, Brief Psychiatric Rating Scale; LPS, Leistungsprüfsystem; APS, attenuated psychotic symptoms; BLIPS, brief, limited intermittent psychotic symptoms. Categorical and continuous variables were compared by Pearson χ2
Source Localization
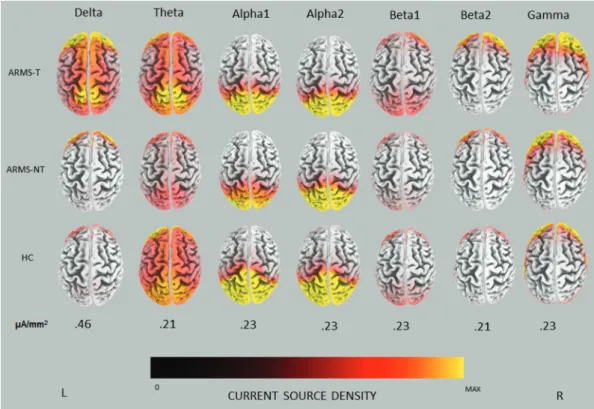
The average CSD in ARMS-T, ARMS-NT, and HC at each frequency band are depicted in figure 1. In ARMS-T and ARMS-NT, the highest CSD values were present in the delta (0.82 vs 0.63 µA/mm2) followed by the gamma
frequency band (0.67 vs 0.57 µA/mm2), whereas in HC
they were in alpha2 (0.55 µA/mm2) and delta (0.43 µA/
mm2), respectively. In ARMS-T patients delta activity
seemed to be relatively distributed throughout the cortex, particularly in frontal and parieto-occipital areas, while in HC and ARMS-NT delta activity was more localized in the frontal cortex. In the gamma band, source fron-tal activity seemed to progressively increase from HC to ARMS-NT to ARMS-T. Interestingly, statistical analy-ses confirmed that ARMS-T had increased gamma activ-ity in the medial prefrontal cortex (mPFC) bilaterally (BA 10), with a global maximum in the left hemisphere (X = −5, Y = 66, Z = 15, t = 4.59, P < .05, corrected) (see figure 2a).
Current Source Analyses and Neurocognitive Measurements
A linear regression model with cognitive performance in the LPS-3 as dependent variables and CSD activity in the gamma frequency band at the mPFC and group (ARMS-T vs HC) as independent variables revealed a significant main effect of group (P < .001, corrected) and interaction between group and mPFC activity (P < .001, corrected). This interaction was due to a positive
relationship between LPS-3 and mPFC activity in the ARMS-T group (P < .001, corrected) but not in HC (P = .140, corrected) (see figure 2b). In a similar model including performance in the 2-back task as dependent variable, there were no significant main effect of mPFC activity and interaction effect between mPFC activity and group when corrected for multiple comparisons. These results were also found using conventional EEG mea-surements (supplementary appendix 1). A whole brain voxel-wise correlation analysis revealed that the CSD of gamma oscillations was highly correlated with LPS-3 performance in ARMS-T (r = .734, P < .001, corrected), but not in ARMS-NT and HC, and the global maximum was located at (X = −5, Y = 65, Z = 15) (supplementary appendix 2).
Lagged Phase Synchronization Across Distributed Brain Regions
Linear mixed-effects models with lagged phase syn-chronization as dependent variables, Euclidian distance, group and their interaction as independent variable and a random intercept per subject, revealed significant main effects of Euclidian distance for each frequency band (all
Ps < .001, corrected). This was due to decreased lagged
phase synchronization with increasing distances between the ROIs (171 pairs) in all frequencies except for the delta band, which demonstrated an opposite association. In addition, there was a significant interaction between group and Euclidian distance for lagged phase synchronization
of beta1 oscillations (P < .001, corrected), which was due to a stronger decrease of lagged phase synchroniza-tion with increasing anatomical distance in the ARMS-T group compared to the ARMS-NT and HC groups (see figure 3).
Moreover, a linear mixed-effect model that addition-ally included BPRS positive symptoms as an independent variable revealed a significant second order interaction between lagged phase synchronization, distance and BPRS positive symptoms in the beta1 frequency band (P = .002, corrected), indicating that higher positive symptoms in the ARMS-T group was associated with a particular strong decrease of lagged phase synchroniza-tion with increasing distance (see figure 4a). The same interaction occurred with negative symptoms (P = .022,
corrected) (see figure 4b). In both models, the interaction between Euclidian distance and group remained signifi-cant, indicating that this interaction was not due to dif-ferent psychopathology in ARMS-T and ARMS-NT. Discussion
In this study, we assessed by means of electrophysiological neuroimaging methods the CSD distribution and lagged-phase synchronization of neural oscillations across brain areas in patients at-risk for psychosis and HC. Consistent with our predictions, we found: (1) in comparison to HC, increased CSD of frontal gamma oscillations (30–50 Hz) in those patients who later transitioned to psychosis. Moreover, in ARMS-T gamma activity was positively
Fig. 2. (A) eLORETA statistical map of gamma band differences between ARMS-T and HC and (B) correlations between gamma activity (µA/mm2) at the medial prefrontal cortex (mPFC) and LPS-3 performance in ARMS-T and HC.
correlated with cognitive performance as assessed by the LPS-3. (2) We revealed that the inverse relationship between lagged phase synchronization and Euclidian dis-tance was steeper in the ARMS-T patients than the other groups. This effect was most pronounced in patients with elevated negative and positive symptoms. These findings provide strong evidence that patients who will later make the transition to psychosis are characterized by impair-ments in neural oscillations.
CSD Analyses
The revealed alteration in mPFC gamma oscillations in ARMS-T patients is in line with numerous studies report-ing abnormal gamma oscillations in schizophrenia2,54,55 and extends these findings by demonstrating that prefron-tal gamma oscillations are already affected in high-risk patients that later transitioned to psychosis. Although both an increase and a decrease of gamma oscillations have extensively been documented in patients suffering
from psychosis, an increase has mostly been found in unmedicated patients exhibiting positive symptoms.11 This is in line with our ARMS-T patients who fit these criteria and could explain the here revealed increase in the medial prefrontal gamma oscillations.
As the mPFC has been shown to be modulated by gamma oscillations56 and to be associated with seem-ingly disparate cognitive functions such as detecting high-order relationships,57–60 planning and visualizing the future61 and constructing social and emotional judg-ments,62 our finding of increased gamma activity sug-gests that ARMS-T patients, already at baseline, have an impaired mPFC that could potentially explain cognitive abnormalities.63,64 Indeed, we found that gamma oscilla-tion in mPFC [Brodmann area (BA) 10] correlated with neurocognitive performance in the LPS-3, a task in which patients are asked to find which item does not belong to a series of shapes. Such a detection of a higher-order rela-tionship between individual entities was previously found to be associated with activation in BA 10 in semantic57,59
Fig. 3. The lagged phase-synchronization of the beta 1 frequency band as a function of distance. Shaded areas cover regression coefficients with ±1 SE.
and visual-based tasks,58,60 which is in line with the here revealed association between LPS-3 performance and mPFC gamma oscillations. However, the correlation between LPS-3 performance and gamma oscillations was positive, suggesting that increased medial prefron-tal gamma oscillations in the ARMS-T group may be an adaptive and compensatory process. A speculative explanation would be that patients with a high capacity to detect higher-order relationships, as indexed by the LPS-3 test and by gamma oscillation in the BA10, are more cognitively equipped to make sense of their altered psychological state.
Lagged Phase Synchronization Across Distributed Brain Regions
We revealed that ARMS-T patients show stronger decreas-ing lagged phase synchronicity with increasdecreas-ing Euclidian distance than ARMS-NT and HC (figure 3). This nega-tive association is particularly present in patients with high positive symptoms (figure 4).
Thus, through the increased synchronization in the shorter inter-regional distances of the brain character-ized in ARMS-T individuals, the influence of the long-range synchronicity is reduced. This could result from the disruption in the volume and organization of anatomical
Fig. 4. (A) The lagged phase-synchronization of the beta 1 frequency band as a function of distance for each of 4 different values of BPRS positive symptoms. (B) The lagged phase-synchronization of the beta 1 frequency band as a function of distance for each of 4 different values of BPRS negative symptoms. Shaded areas cover regression coefficients with ±1 SE.
connections, which is supported by the findings of reduced grey matter volume in ARMS-T65 and its association with beta oscillations.3 Therefore, this could lead to the situ-ation that distributed cortical areas can no longer com-municate efficiently and that psychological entities like perception and cognition are no longer adequately inte-grated. These findings support the increasingly accepted notion that the neuropsychological impairments associ-ated with schizophrenic psychoses are due to distributed impairments involving the coordinated activity among numerous cortical areas.3 Importantly, given that we observed increased synchronization in the beta1 band already before transition to psychosis, this could indicate an increased liability for psychosis and thereby help to improve the prediction of psychosis.
Limitations
The results of the present study are constrained by a num-ber of limitations: All data were acquired using a relatively low-density EEG system which is commonly used in the clinical field for practical reasons. Even though numer-ous recent studies have shown that CSD and connectivity analyses during resting-state could reliably be performed using a 19 channels EEG system,66–68 we believe that the true potential of the eLORETA analyses could not be fully utilized. Moreover, to control for the strong correla-tion between adjacent voxels in the phase synchronizacorrela-tion analyses, we could only choose 19 ROIs that would be measured by 19 channels and yield only 171 connections. Therefore, future studies should conduct these analyses again using higher density EEG systems.
Conclusion
Taken together, our result of a heightened gamma activ-ity in the mPFC in ARMS-T patients could potentially reveal the neural underpinnings for an abnormal cogni-tive integration. Moreover, the increased lagged phase synchronicity characterized across smaller inter-regional brain areas in the beta1 frequency suggests anatomical abnormalities that could be hindering the proper commu-nication between various cortical areas. These findings provide strong evidence that patients who will later make the transition to psychosis are characterized by impair-ments in neural oscillations.
Supplementary Material
Supplementary material is available at http://schizophre-niabulletin.oxfordjournals.org.
Funding
This work was supported by the Swiss National Science Foundation (3200–057216.99, 3200-0572216.99, PBBSB- 106936, and 3232BO-119382); the Nora van Meeuwen-
Haefliger Stiftung, Basel (CH); and by unconditional grants from the Novartis Foundation, Bristol-Myers Squibb, GmbH (CH), Eli Lilly SA (CH), AstraZeneca AG (CH), Janssen-Cilag AG (CH), and Sanofi-Synthelabo AG (CH).
Acknowledgments
The authors thank all study participants and the refer-ring specialists. The authors also would like to thank Claudine Pfister and Laura Egloff for their help with the preparation and submission of the manuscript.
All authors declare not to have any conflicts of interest that might be interpreted as influencing the content of the manuscript.
References
1. Kindler J, Hubl D, Strik WK, Dierks T, Koenig T. Resting-state EEG in schizophrenia: auditory verbal hallucina-tions are related to shortening of specific microstates. Clin Neurophysiol. 2011;122:1179–1182.
2. Light GA, Hsu JL, Hsieh MH, et al. Gamma band oscilla-tions reveal neural network cortical coherence dysfunction in schizophrenia patients. Biol Psychiatry. 2006;60:1231–1240. 3. Uhlhaas PJ, Singer W. Abnormal neural oscillations and
syn-chrony in schizophrenia. Nat Rev Neurosci. 2010;11:100–113. 4. Phillips WA, Silverstein SM. Convergence of biological and
psychological perspectives on cognitive coordination in schiz-ophrenia. Behav Brain Sci. 2003;26:65–82; discussion 82. 5. Buzsáki G, Draguhn A. Neuronal oscillations in cortical
net-works. Science. 2004;304:1926–1929.
6. Farzan F, Barr MS, Levinson AJ, et al. Evidence for gamma inhibition deficits in the dorsolateral prefrontal cortex of patients with schizophrenia. Brain. 2010;133:1505–1514. 7. Lewis DA, Curley AA, Glausier JR, Volk DW. Cortical
par-valbumin interneurons and cognitive dysfunction in schizo-phrenia. Trends Neurosci. 2012;35:57–67.
8. Minzenberg MJ, Firl AJ, Yoon JH, Gomes GC, Reinking C, Carter CS. Gamma oscillatory power is impaired dur-ing cognitive control independent of medication status in first-episode schizophrenia. Neuropsychopharmacology. 2010;35:2590–2599.
9. Jensen O, Kaiser J, Lachaux JP. Human gamma-frequency oscillations associated with attention and memory. Trends Neurosci. 2007;30:317–324.
10. Gallinat J, Winterer G, Herrmann CS, Senkowski D. Reduced oscillatory gamma-band responses in unmedicated schizo-phrenic patients indicate impaired frontal network process-ing. Clin Neurophysiol. 2004;115:1863–1874.
11. Lee KH, Williams LM, Breakspear M, Gordon E. Synchronous gamma activity: a review and contribution to an integrative neuroscience model of schizophrenia. Brain Res Brain Res Rev. 2003;41:57–78.
12. Herrmann CS, Demiralp T. Human EEG gamma oscil-lations in neuropsychiatric disorders. Clin Neurophysiol. 2005;116:2719–2733.
13. Kopell N, Ermentrout GB, Whittington MA, Traub RD. Gamma rhythms and beta rhythms have different synchronization properties. Proc Natl Acad Sci U S A. 2000;97:1867–1872.
14. Bibbig A, Traub RD, Whittington MA. Long-range syn-chronization of gamma and beta oscillations and the plastic-ity of excitatory and inhibitory synapses: a network model. J Neurophysiol. 2002;88:1634–1654.
15. Tallon-Baudry C, Bertrand O, Fischer C. Oscillatory syn-chrony between human extrastriate areas during visual short-term memory maintenance. J Neurosci. 2001;21:RC177. 16. von Stein A, Rappelsberger P, Sarnthein J, Petsche H.
Synchronization between temporal and parietal cortex dur-ing multimodal object processdur-ing in man. Cereb Cortex. 1999;9:137–150.
17. Kahn RS, Keefe RS. Schizophrenia is a cognitive illness: time for a change in focus. JAMA Psychiatry. 2013;70:1107–1112. 18. Keefe RS, Harvey PD. Cognitive impairment in
schizophre-nia. Handb Exp Pharmacol. 2012;213:11–37.
19. Riecher-Rössler A, Pflueger MO, Aston J, et al. Efficacy of using cognitive status in predicting psychosis: a 7-year follow-up. Biol Psychiatry. 2009;66:1023–1030.
20. Insel TR. Rethinking schizophrenia. Nature.
2010;468:187–193.
21. Zimmermann R, Gschwandtner U, Wilhelm FH, Pflueger MO, Riecher-Rössler A, Fuhr P. EEG spectral power and negative symptoms in at-risk individuals predict transition to psychosis. Schizophr Res. 2010;123:208–216.
22. Gschwandtner U, Pflueger MO, Semenin V, Gaggiotti M, Riecher-Rössler A, Fuhr P. EEG: a helpful tool in the pre-diction of psychosis. Eur Arch Psychiatry Clin Neurosci. 2009;259:257–262.
23. van Tricht MJ, Ruhrmann S, Arns M, et al. Can quantitative EEG measures predict clinical outcome in subjects at clini-cal high risk for psychosis? A prospective multicenter study. Schizophr Res. 2014;153:42–47.
24. Ranlund S, Nottage J, Shaikh M, et al. Resting EEG in psy-chosis and at-risk populations—a possible endophenotype? Schizophr Res. 2014;153:96–102.
25. Pascual-Marqui RD, Lehmann D, Koukkou M, et al. Assessing interactions in the brain with exact low-resolution electromagnetic tomography. Philos Trans A Math Phys Eng Sci. 2011;369:3768–3784.
26. Jones NC, Reddy M, Anderson P, Salzberg MR, O’Brien TJ, Pinault D. Acute administration of typical and atypical antipsychotics reduces EEG γ power, but only the preclinical compound LY379268 reduces the ketamine-induced rise in γ power. Int J Neuropsychopharmacol. 2012;15:657–668. 27. Riecher-Rössler A, Gschwandtner U, Aston J, et al. The
Basel early‐detection‐of‐psychosis (FEPSY)‐study— design and preliminary results. Acta Psychiatr Scand. 2007;115(2):114–125.
28. Riecher-Rössler A, Aston J, Ventura J, et al. The Basel Screening Instrument for Psychosis (BSIP): development, structure, reliability and validity. Fortschr Neurol Psychiatr. 2008;76:207–216.
29. Yung AR, Phillips LJ, McGorry PD, et al. Prediction of psy-chosis. A step towards indicated prevention of schizophrenia. Br J Psychiatry Suppl. 1998;172:14–20.
30. Vitacco D, Brandeis D, Pascual-Marqui R, Martin E. Correspondence of event-related potential tomography and functional magnetic resonance imaging during language pro-cessing. Hum Brain Mapp. 2002;17:4–12.
31. Mulert C, Jäger L, Schmitt R, et al. Integration of fMRI and simultaneous EEG: towards a comprehensive understand-ing of localization and time-course of brain activity in target detection. Neuroimage. 2004;22:83–94.
32. Worrell GA, Lagerlund TD, Sharbrough FW, et al. Localization of the epileptic focus by low-resolution electro-magnetic tomography in patients with a lesion demonstrated by MRI. Brain Topogr. 2000;12:273–282.
33. Zumsteg D, Wennberg RA, Treyer V, Buck A, Wieser HG. H2(15)O or 13NH3 PET and electromagnetic tomography (LORETA) during partial status epilepticus. Neurology. 2005;65:1657–1660.
34. Pizzagalli D, Oakes T, Fox A, et al. Functional but not struc-tural subgenual prefrontal cortex abnormalities in melancho-lia. Mol Psychiatry 2003;9:393–405.
35. Dierks T, Jelic V, Pascual-Marqui RD, et al. Spatial pattern of cerebral glucose metabolism (PET) correlates with locali-zation of intracerebral EEG-generators in Alzheimer’s dis-ease. Clin Neurophysiol. 2000;111:1817–1824.
36. Zumsteg D, Friedman A, Wieser HG, Wennberg RA. Propagation of interictal discharges in temporal lobe epi-lepsy: correlation of spatiotemporal mapping with intracra-nial foramen ovale electrode recordings. Clin Neurophysiol. 2006;117:2615–2626.
37. Zumsteg D, Lozano AM, Wennberg RA. Depth electrode recorded cerebral responses with deep brain stimulation of the anterior thalamus for epilepsy. Clin Neurophysiol. 2006;117:1602–1609.
38. Pascual-Marqui RD, Michel CM, Lehmann D. Low resolu-tion electromagnetic tomography: a new method for local-izing electrical activity in the brain. Int J Psychophysiol. 1994;18:49–65.
39. Pascual-Marqui RD. Discrete, 3D distributed, linear imaging methods of electric neuronal activity. Part 1: exact, zero error localization. arXiv preprint. 2007;arXiv:07103341.
40. Mazziotta J, Toga A, Evans A, et al. A probabilistic atlas and reference system for the human brain: International Consortium for Brain Mapping (ICBM). Philos Trans R Soc Lond B Biol Sci. 2001;356:1293–1322.
41. Canuet L, Tellado I, Couceiro V, et al. Resting-state net-work disruption and APOE genotype in Alzheimer’s dis-ease: a lagged functional connectivity study. PLoS ONE. 2012;7:e46289.
42. R Core Team. R: A Language and Environment for Statistical Computing [computer program]. Version 3.0.2; 2013.
43. Horn W. LPS Leistungsprüfsystem. Göttingen: Hogrefe; 1983.
44. Kirchner WK. Age differences in short-term retention of rap-idly changing information. J Exp Psychol. 1958;55:352–358. 45. Ventura J, Green MF, Shaner A, Liberman RP. Training and
quality assurance with the Brief Psychiatric Rating Scale: “the drift busters.” Int J Methods Psychiatr Res. 1993;3:221–244. 46. Lukoff D, Nuechterlein K, Ventura J. Manual for the
expanded brief psychiatric rating scale. Schizophr Bull. 1986;12:594–602.
47. Velligan D, Prihoda T, Dennehy E, et al. Brief psychiatric rat-ing scale expanded version: how do new items affect factor structure? Psychiatry Res. 2005;135:217–228.
48. Holmes AP, Blair RC, Watson JD, Ford I. Nonparametric analysis of statistic images from functional mapping experi-ments. J Cereb Blood Flow Metab. 1996;16:7–22.
49. Anderer P, Pascual-Marqui RD, Semlitsch HV, Saletu B. Differential effects of normal aging on sources of standard N1, target N1 and target P300 auditory event-related brain potentials revealed by low resolution electromagnetic tomog-raphy (LORETA). Electroencephalogr Clin Neurophysiol. 1998;108:160–174.
50. Pascual-Marqui RD, Lehmann D, Koenig T, et al. Low resolution brain electromagnetic tomography (LORETA) functional imaging in acute, neuroleptic-naive, first-episode, productive schizophrenia. Psychiatry Res. 1999;90:169–179. 51. Canuet L, Ishii R, Iwase M, et al. Psychopathology and
working memory-induced activation of the prefrontal cor-tex in schizophrenia-like psychosis of epilepsy: Evidence from magnetoencephalography. Psychiatry Clin Neurosci. 2011;65:183–190.
52. Hubl D, Koenig T, Strik WK, Garcia LM, Dierks T. Competition for neuronal resources: how hallucinations make themselves heard. Br J Psychiatry. 2007;190:57–62. 53. Benjamini Y, Hochberg Y. Controlling the false discovery
rate: a practical and powerful approach to multiple testing. J R Stat Soc B Methodol. 1995;57:289–300.
54. Ferrarelli F, Massimini M, Peterson MJ, et al. Reduced evoked gamma oscillations in the frontal cortex in schizo-phrenia patients: a TMS/EEG study. Am J Psychiatry. 2008;165:996–1005.
55. Pomarol-Clotet E, Salvador R, Sarró S, et al. Failure to deac-tivate in the prefrontal cortex in schizophrenia: dysfunction of the default mode network? Psychol Med. 2008;38:1185–1193. 56. Minzenberg MJ, Firl AJ, Yoon JH, Gomes GC, Reinking
C, Carter CS. Gamma oscillatory power is impaired dur-ing cognitive control independent of medication status in first-episode schizophrenia. Neuropsychopharmacology. 2010;35:2590–2599.
57. Wendelken C, Nakhabenko D, Donohue SE, Carter CS, Bunge SA. “Brain is to thought as stomach is to ??”: investi-gating the role of rostrolateral prefrontal cortex in relational reasoning. J Cogn Neurosci. 2008;20:682–693.
58. Bunge SA, Helskog EH, Wendelken C. Left, but not right, rostrolateral prefrontal cortex meets a stringent test of the relational integration hypothesis. Neuroimage. 2009;46:338–342.
59. Bunge SA, Wendelken C, Badre D, Wagner AD. Analogical reasoning and prefrontal cortex: evidence for separa-ble retrieval and integration mechanisms. Cereb Cortex. 2005;15:239–249.
60. Smith R, Keramatian K, Christoff K. Localizing the rostro-lateral prefrontal cortex at the individual level. Neuroimage. 2007;36:1387–1396.
61. Barbey AK, Krueger F, Grafman J. Structured event com-plexes in the medial prefrontal cortex support counterfactual representations for future planning. Philos Trans R Soc Lond B Biol Sci. 2009;364:1291–1300.
62. Mitchell JP, Banaji MR, Macrae CN. The link between social cognition and self-referential thought in the medial prefrontal cortex. J Cogn Neurosci. 2005;17:1306–1315.
63. Whitfield-Gabrieli S, Ford JM. Default mode network activ-ity and connectivactiv-ity in psychopathology. Annu Rev Clin Psychol. 2012;8:49–76.
64. Broyd SJ, Demanuele C, Debener S, Helps SK, James CJ, Sonuga-Barke EJ. Default-mode brain dysfunction in men-tal disorders: a systematic review. Neurosci Biobehav Rev. 2009;33:279–296.
65. Borgwardt SJ, McGuire PK, Aston J, et al. Structural brain abnormalities in individuals with an at-risk mental state who later develop psychosis. Br J Psychiatry Suppl. 2007;51:s69–s75.
66. Babiloni C, Bosco P, Ghidoni R, et al. Homocysteine and electroencephalographic rhythms in Alzheimer disease: a multicentric study. Neuroscience. 2007;145:942–954.
67. Gianotti LR, Künig G, Lehmann D, et al. Correlation between disease severity and brain electric LORETA tomography in Alzheimer’s disease. Clin Neurophysiol. 2007;118:186–196. 68. Babiloni C, Carducci F, Lizio R, et al. Resting state
corti-cal electroencephalographic rhythms are related to gray mat-ter volume in subjects with mild cognitive impairment and Alzheimer’s disease. Hum Brain Mapp. 2013;34:1427–1446.