High Test–Retest Reliability of the Extended Version of the ‘‘Sniffin’ Sticks’’
Test
Antje Haehner
1, Anna-Maria Mayer
1, Basile N. Landis
2, Irene Pournaras
2, Katja Lill
1,
Volker Gudziol
1and Thomas Hummel
11
Department of Otorhinolaryngology, University of Dresden Medical School, Fetscherstrasse
74, 01307 Dresden, Germany and
2Department of Otorhinolaryngology, University Hospital of
Geneva, Geneva, Switzerland
Correspondence to be sent to: Antje Haehner, Department of Otorhinolaryngology, University of Dresden Medical School, Fetscherstrasse 74, 01307 Dresden, Germany. e-mail: [email protected]
Abstract
The ‘‘Sniffin’ Sticks’’ test kit is a validated and commonly used tool for assessment of olfactory function in subjects with normal sense of smell and in individuals with smell loss. That test incorporates subtests for odor threshold, discrimination, and identification. To gain higher subtest reproducibility, tests on odor discrimination and odor identification were extended using 32 instead of the usually applied 16 single trials each. In developing the extended Sniffin’ Sticks test, a number of preliminary experiments were performed in 46 healthy, normosmic individuals 1) to evaluate intensity and familiarity of the additionally selected odors, 2) to select distractors for the discrimination and identification test, and 3) to evaluate the test–retest reliability of each subtest. Furthermore, the extended test was applied to 126 patients with olfactory loss and 71 normosmic individuals. Follow-up investigation could be performed in 69 controls within an average interval of 4 days. Results revealed significant differences between patients and healthy subjects. Estimated intensity and familiarity of the newly selected 16 items of the discrimination test did not differ significantly from the 16 standard items. Test–retest reliability was found to be r = 0.80 (odor discrimination), r = 0.88 (odor identification), and r = 0.92 (odor threshold). In conclusion, the extended test kit allows a precise evaluation of olfactory function, especially when different olfactory tasks are assessed using individual subtests. Furthermore, the high test–retest reliability of both the 16 and the 32-item tests allows the evaluation of even relatively small changes of olfactory function over time by means of either test.
Key words: olfaction, smell, Sniffin’ Sticks
Introduction
The ‘‘Sniffin’ Sticks’’ test battery is a tool for assessment of nasal chemosensory performance using pen-like odor dis-pensing devices (Kobal et al. 1996; Hummel et al. 1997). Pre-vious work established the test–retest reliability of this comprehensive kit and its validity in comparison to estab-lished measures of olfactory sensitivity, namely, the ‘‘Con-necticut Chemosensory Clinical Research Center Test’’ (CCCRC; Cain et al. 1988) and the ‘‘Cross-Cultural Smell Identification Test’’ (CC-SIT; Doty et al. 1996). The Sniffin’ Sticks have already been used in approximately 200 pub-lished studies. They are in daily use by many clinicians/ practitioners all across the world (e.g., Hu¨ttenbrink 1997).
The Sniffin’ Sticks kit is comprised of 3 subtests of olfac-tory function, namely, tests for odor threshold (T), odor dis-crimination (D), and odor identification (I). Results of the 3 subtests are typically summed up and presented as a compos-ite ‘‘TDI score.’’ Odor threshold testing measures the lowest
concentration of an odorant (n-butanol or phenyl ethyl al-cohol) that can be perceived by a subject. It is determined by the administration of 16 increasing dilutions of the odor-ant in a single-staircase design. In the odor discrimination task, 16 triplets of odor-containing pens are presented. Two pens contain the same odor, and only one contains a dif-ferent one. The subjects’ task is to identify the pen that smells different. Odor identification testing involves the identifica-tion of 16 odors from a list of 4 descriptors each. However, despite the fact that the TDI score has a high retest reliabil-ity, the Sniffin’ Sticks test kit often appears not to be suffi-ciently amenable to applications in which individual olfactory subfunctions must be assessed. Subtest reproduc-ibility is, especially in small sample sizes, sometimes unsat-isfactory due to the relatively small number of 16 items used in the odor discrimination and odor identification tests. Therefore, a more precise testing of olfactory subfunctions
ª The Author 2009. Published by Oxford University Press. All rights reserved.
would considerably alleviate, for example, follow-up investigations.
The present study extended the subtests on odor discrim-ination and odor identification using 32 instead of the usu-ally applied 16 single items each. Criteria for the selection of odorants were similar to the ones originally applied for the development of the Sniffin’ Sticks (Hummel et al. 1997). The test–retest reliability was investigated in a group including both patients with olfactory dysfunction and normosmic subjects.
Materials and methods
All experimental procedures were explained and demon-strated in full detail to the subjects who provided written in-formed consent. Investigations were perin-formed according to the Guidelines for Biomedical Studies Involving Human Subjects (Helsinki Declaration).
In developing the extended Sniffin’ Sticks test, the authors performed 4 preliminary experiments in 46 healthy, normos-mic individuals (23 men and 23 women; mean age 29 years; range 22–61years). Furthermore, the extended test was ap-plied to 126 patients with olfactory loss (79 women and 47 men; mean age 56.5 years; range 21–94 years; 79 anosmic subjects) and to 71 healthy individuals (45 women and 26 men; mean age 50.1 years; range 14–97 years). For the odor identification and discrimination tasks, test scores were cal-culated for the first 16 items of the task (i.e., the standard version of the tasks), for the 16 new items of the task, and for the total of 32 items (i.e., the extended version of the tasks). In 104 subjects (35 patients with olfactory loss and 69 healthy individuals), testing was performed again after a mean interval of 4 days to verify test–retest reliability. All patients attended our Smell and Taste Clinic for diagnos-tic evaluation; they received a detailed otorhinolaryngolog-ical investigation including nasal endoscopy.
Sniffin’ Sticks test—standard version
Odorants are presented in pen-like odor dispensing devices. For odor presentation, the pen’s cap is removed by the ex-perimenter for approximately 3 s; then the pen’s tip is placed approximately 2 cm in front of both nostrils. Testing in-volves tests for odor threshold, discrimination, and identifi-cation (duration of testing is approximately 30 min). ‘‘Odor thresholds’’ for butanol or phenyl ethyl alcohol are assessed using a single-staircase, 3-alternative forced-choice proce-dure. Sixteen dilutions are prepared in a geometric series starting from pure 4% butanol or phenyl ethyl alcohol (di-lution ratio 1:2 in aqua conservans), respectively. Previous research had shown that odor thresholds obtained with ei-ther odor are comparable (Croy et al. 2009). Three pens are presented in a randomized order, with 2 containing the solvent and the third the odorant at a certain dilution. The subject’s task is to identify the odor-containing pen.
Reversal of the staircase is triggered when the odor is cor-rectly identified in 2 successive trials for a total of 7 reversals. Threshold is defined as the mean of the last 4 staircase rever-sal points. Subjects’ scores range between 1 and 16. In the ‘‘odor discrimination’’ task, 16 triplets of pens are presented. The 3 pens are presented in a randomized order, with 2 con-taining the same odorant and the third a different odorant. Using a 3-alternative forced-choice technique, subjects have to determine which of 3 odor-containing pens smelled differ-ent. When measuring odor thresholds and odor discrimina-tion, subjects are blindfolded to prevent visual identification of some of the odorant-containing pens. ‘‘Odor identifica-tion’’ is assessed by means of 16 common odors. Using a mul-tiple forced-choice design, subjects identify odors by selecting the best label from a list of 4 descriptors. Again, the subjects’ scores range from 0 to 16 (for details, see Hummel et al. 1997).
Results of the 3 subtests are presented as a composite TDI score (range 1–48), which is the sum of the results obtained for threshold, discrimination, and identification measures (Wolfensberger and Schnieper 1999).
Development of the Sniffin’ Sticks 32-items version’’—preliminary experiments
Subtests on odor discrimination and odor identification were extended using 32 instead of the usually applied 16 single items each. The number of triplets for testing odor threshold (n = 16) remained unchanged. As described above, odor threshold for phenyl ethyl alcohol was assessed using a single-staircase, 3-alternative forced-choice procedure.
Odor discrimination
For the Sniffin’ Sticks 32-items version, the 16 ‘‘original’’ triplets (Hummel et al. 1997) of the odor discrimination sub-test were expanded by 16 newly combined triplets. Pairs of odorants of each triplet were chosen as follows: for the 17th triplet odorant number 1 was combined with distractor’s number 16; for the 18th triplet odorant number 2 was pre-sented with distractor’s number 15, etc. Thus, 32 triplets could be established by means of opposite recombination without the need for further odorants or a higher number of pens, respectively.
Criteria for the selection of odorants were as follows: 1) In order to prevent subjects from discriminating properties other than quality, the 2 odorants of each triplet had to be balanced in terms of their intensity. As applied during de-velopment of the original version, only those pairs of odor-ants were permitted which had a maximum mean intensity difference of less than 50 units. Furthermore, only those odorants with a mean quality difference of less than 25 units (as determined by means of subjects’ ratings—see Experi-ment D1) were included. 2) To ensure homogeneity of the triplets of the original and ‘‘new’’ part, results from both tests should exhibit a significant correlation. In addition,
results from original and new test should not be significantly different from each other.
Experiment D1. The extended discrimination test containing 32 triplets of odorants was applied to 10 healthy subjects (5 women and 5 men; mean age, 24 years). Afterward, all 32 target and distracter odorants were rated by the subjects on computerized visual analogue scales with its left hand end defined as ‘‘no intensity/quality difference’’ (0 units) and the right hand end defined as highest intensity/quality difference possible (100 units).
Odor identification
In addition to the 16 original odors (Hummel et al. 1997) of the odor identification subtest, 19 new odors were chosen: pear, coke, lilac, grapefruit, grass, raspberry, honey, ginger, coco-nut, lavender, melon, peach, rosemary, mushrooms, smoked meat, plum, chocolate, tomato, and onion. The aim was to finally select an additional 16 items for inclusion to the 32-item version. Criteria for the selection of odors were as follows: 1) subjects should be familiar with all odor-describing items used in the test; 2) odorants included in the test should be similar with regard to intensity to ensure that identifiability was not simply intensity related; and 3) in case of the absence of olfac-tory cues all descriptors from individual lists of verbal items should be chosen in equal distribution.
Only those odors and descriptors were selected that had been demonstrated to have an identification rate of more than 75% (Kobal et al. 1996; Hummel et al. 1997). During preliminary experiments, our aim was to ascertain that odor selection met criteria 2) and 3).
Experiment I1. Both ‘‘intensity and familiarity’’ were rated on visual analogue scales with left hand end defined as ‘‘no odor perceived’’ (0) and right hand end defined as high-est intensity/familiarity possible (+++). Nineteen preselected odorants were roughly matched for odor intensity by expe-rienced laboratory personnel, and they were more formally tested with a group of 10 healthy subjects (5 men and 5 women).
Experiment I2. With regard to ‘‘identifiability,’’ 16 addi-tional odorants were selected to be included into the final kit. Out of the 19 odorants, the 3 targets with the lowest iden-tifiability were excluded based on the results obtained in 10 healthy subjects.
Experiment I3. In addition, to ensure homogeneity of the de-scriptors in terms of familiarity and hedonic tone without any olfactory information, the descriptors should be selected with an ‘‘equal frequency’’ (approximately 25%). Thirty-five subjects participated in this study, in which imaginary odor-ants had to be selected from lists with 4 descriptors each (Table 1). Here, odor-containing pens were not presented to the subjects who had the task to pretend to be anosmic.
In order to compare pleasantness/unpleasantness of the old and the newly added odors of the odor identification test, we resorted to hedonic estimates of odors provided by Dravnieks et al. (1984). Comparison of hedonic ratings be-tween the 2 groups of odors did not show significant differences (t = 0.41, P = 0.68). In addition, when ordering hedonic ratings of odors in both groups from unpleasant to pleasant, the cor-relation between the 2 groups of odors was significant (r16=
0.98, P < 0.001), indicating that odors used in the old and the new test were similar in terms of their hedonic properties. Statistical analyses were performed by means of SPSS 12.0 (SPSS Inc., Chicago, IL) for Windows. We defined one between-subject factor with 2 levels: patients versus normal controls using analyses of variance (ANOVAs) for repeated measures (general linear model). The level of significance was set at 0.05. Degrees of freedom were adjusted according to Greenhouse–Geisser; they are indicated in brackets follow-ing F values. Correlational analyses were performed usfollow-ing the method of Pearson.
Results
Preliminary experiments Experiment D1
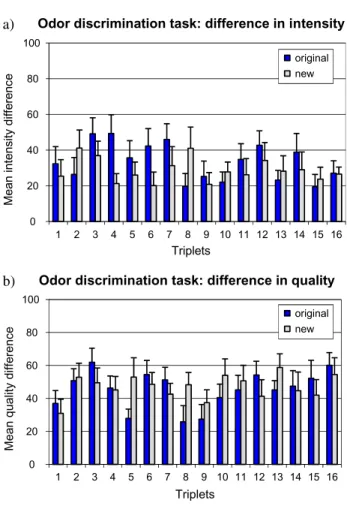
With regard to odors used in the discrimination task, results from quality and intensity ratings are presented in Figure 1a,b. Table 1 Characterization of the 4 descriptors of the ‘‘new’’ part of the 32-item identification task (target odors in bold characters)
Item number List of 4 descriptors
17 Blackberry Pear Cherry Orange
18 Coke Apple Jelly baby Lemon
19 Peppermint Spruce Lilac Chive
20 Peach Grapefruit Grapes Strawberry
21 Rose Sauerkraut Carrots Grass
22 Plum Melon Raspberry Orange
23 Honey Almond Liquorice Rum
24 Sweet pepper Cloves Ginger Pepper
25 Cinnamon Chocolate Peanut Coconut
26 Grass Spruce Lavender Rose
27 Lemon Black currant Banana Melon
28 Cherry Peach Apple Strawberry
29 Garlic Mushrooms Ham Wood
30 Smoked meat Leather Cigarette Salami
31 Cookies Vanilla Honey Chocolate
All odorants were rated at a mean intensity difference of less than 50 units and a mean quality difference of less than 25 (Figure 2). ANOVA revealed no significant difference be-tween the original part and the newly combined part in terms of intensity difference (F(1,9) = 1.08, P = 0.33) and quality difference (F(1,9) = 0.20, P = 0.66). Hence, all selection cri-teria as mentioned above had been met.
The experiment revealed a high discrimination rate in the extended version (mean 88.7%) and in both the newly com-bined triplets (mean 89.4%) and the original triplets (mean 88.1%). There was no significant difference between results obtained for the original and new parts of the extended discrimination test (F(30,24.5) = 3.4, P = 0.074).
Experiment I1
For intensity and familiarity of both the original and the new odors, please see Figure 3. ANOVA revealed no significant differences between the 2 groups of odors in terms of inten-sity (F(1,9) = 1.26, P = 0.29) and familiarity (F(1,9) = 3.2, P = 0.11). Therefore, odorants included in the test proved to be similar with regard to intensity and familiarity.
Experiment I2
Ten subjects participated in this experiment. Out of the 19 new odorants, 16 odors were correctly identified by more than 75% of the subjects (Figure 4). The odorant that was identified least often was ‘‘tomato’’ (60% correct identifica-tion), which was removed from the test kit. Odorants that were identified by 70% of the subjects included ‘‘ginger,’’ ‘‘rosemary,’’ and ‘‘plum.’’ Again, these 3 odorants were pre-sented to 36 subjects in a multiple forced-choice format. Then, odors with the lowest identification rate (rosemary, 55.6%; plum, 69.4%) were removed from the test kit. The pen containing ginger odor, however (77.8% correct identi-fication), was included into the new part of the extended identification test.
Experiment I3
Using the multiple choice lists of 4 descriptors each to iden-tify 16 imaginary odorants, it could be shown that subjects pretending to be anosmic chose verbal descriptors from lists of 4 descriptors each with an equal likelihood. On average, a) 0 20 40 60 80 100 1 2 3 4 5 6 7 8 9 10 11 12 13 14 15 16
Mean intensity differe
n
c
e
Triplets
Odor discrimination task: difference in intensity
b) 0 20 40 60 80 100 1 2 3 4 5 6 7 8 9 10 11 12 13 14 15 16
Mean quality difference
Triplets
Odor discrimination task: difference in quality
original new
original new
Figure 1 Difference in perceived intensity (a) and quality (b) between the pair of odorants within a triplet (mean, standard error of the mean). Intensity and quality were rated by the subjects on visual analog scales with left hand end defined as ‘‘no intensity/quality difference’’ (0 units) and right hand end defined as highest intensity/quality difference possible (100 units).
Difference in quality
original part new part 0 25 50 75 100 %
original part new part
0 25 50 75 100 % Difference in intensity
Odor discrimination task:
Figure 2 Difference in intensity and quality of discrimination task triplets (mean, standard error of the mean).
original part new part
0
25 50 75 100
original part new part
0 25 50 75 100 % Intensity Familiarity
Odor identification task:
Figure 3 Intensity and familiarity of identification task odorants (mean, standard error of the mean).
selection of the 4 targets per list ranged between 22.5% and 26.4%.
Extended testing (32-item version) 32-item odor discrimination test
Comparison between healthy subjects and patients with olfac-tory dysfunction: patients scored significantly worse than control subjects on each of the 2 tests with 16-items and the 32-items test. Both the original and the new part of the extended discrimination test differentiate between patients and healthy subjects (Figure 5), with the latter scoring on average 4.3 points higher than patients when using the original version and 4.4 points higher when using the 16 new triplets (t = 11.3, P < 0.001). When using the 32-items version of the discrimina-tion test, controls exhibited significantly higher test scores than patients (P < 0.001, meanpatients15.5, meancontrols24.1).
Correlational analyses between test results from the orig-inal and the new part of the extended discrimination test were made across all participants. There were significant cor-relations (Pearson) between the original and the new part of the 32-item version (r197= 0.82, P < 0.01).
In order to verify test–retest reliability, testing with the 32-item version was performed again in 69 controls after a mean interval of 4 days. Significant correlations (P < 0.01) were found for both the original part (r69= 0.69) and the new part
of the test (r69 = 0.77).
32-item odor identification test
Comparison between healthy subjects and patients with ol-factory dysfunction: similar to what we saw in the discrim-ination task, patients scored significantly worse than control subjects (P < 0.001) on each of the 16-item versions (Figure 6) and the 32-items identification test (meanpatients 13.2;
meancontrols 24.8). On average, controls scored 5.9 points
higher in the original version and 5.7 points higher in the new part of the extended identification test.
Correlational analyses between test results of the original part and the new part of the extended identification test were made across all participants. There were significant correla-tions (Pearson) between the original and the new part of the 32-item version (r197= 0.80, P < 0.01).
In order to verify test–retest reliability, identification test-ing with the 32-item version was performed again in 69 con-trols after a mean interval of 4 days. Significant correlations (P < 0.01) were found for both the original part (r69= 0.86)
and the new part of the test (r69= 0.83).
Figure 4 Percentage of correct identification in the 32-triplets version. Original ‘‘Sniffin’ Sticks’’ triplets are colored black and newly selected triplets are colored gray. Odorants that were identified least often are marked dark gray.
11,9 12,2 0 4 8 12 16 test score Controls
Odor discrimination task: patients vs. controls
7,6 7,8 0 4 8 12 16 test score Patients
original part new part original part new part
Figure 5 Mean discrimination score in patients and controls. Results are shown separately for the original triplets and the newly combined triplets.
12,5 12,3
test score
Controls
Odor identification task: patients vs. controls
6,6 6,6 0 4 8 12 16 0 4 8 12 16 test score Patients
original part new part original part new part
Figure 6 Mean identification score in patients and controls. Results are shown separately for the original odors and the new odors.
Reliability of the 32-item version and its subtests
The test–retest reliability obtained for both the extended dis-crimination test (r69= 0.80) and the extended identification
test (r69 = 0.88) was higher than the reproducibility of the
original and new 16-item parts of the test, from which coef-ficients of correlations were r69original= 0.69 and r69new= 0.77
for discrimination and r69original= 0.86 and r69new= 0.83 for
identification, respectively (Figure 7). For the composite 32-item version, test–retest correlation constitutes 0.93. Differ-ence between test–retest reliability of the composite 16-item Sniffin’ Sticks (r = 0.91) and the 32-item version did not reach the level of significance (P = 0.23). The same applies to the subtest identification (P = 0.45) and discrimination (P = 0.05). With regard to the differentiation between people with smell loss versus normal controls at a cutoff of a TDI score of 44, the 32-item version had a sensitivity of 95% and a specificity of 88%.
Discussion
The newly developed 32-item version of the Sniffin’ Sticks is an extended version of the Sniffin’ Sticks test kit that was
introduced some 10 years ago by Kobal and coworkers (Kobal et al. 1996; Hummel et al. 1997). The experiments described above indicate that the extended version and its individual parts are suitable for assessing olfactory abilities. They are characterized by high reliability in olfactory testing. By means of preliminary experiments, all selecting criteria for odors and odor-describing items could be established in order to select another 16 odorants/triplets for inclusion in the 32-item identification/discrimination test of the extended version. When the extended test was applied to patients with olfactory dysfunction and healthy controls, the coefficient of correlation between test and retest was 0.93 (Figure 7), which is higher than the result obtained with the 16-item version of the Sniffin’ Sticks (‘‘original part of the test’’) in this study (r = 0.91) and other comprehensive tests such as the CCCRC (Cain et al. 1988). Olfactory testing methods, which are based on identification tasks only, have produced similar test–retest reliability. For the UPSIT (University of Penn-sylvania Smell Identification Test; Doty 1989), which con-sists of 40 odorants, this coefficient was 0.95. This good test–retest reliability in the 32-item Sniffin’ Sticks version and in the 40-item UPSIT is partly due to the large number
16 12 8 4 0 16 12 8 4 0 32 28 24 20 16 12 8 4 0 32 28 24 20 16 12 8 4 0 32 28 24 20 16 12 8 4 0 32 28 24 20 16 12 8 4 0 80 70 60 50 40 30 20 10 0 80 70 60 50 40 30 20 10 0
a) Odor threshold task: reliability b) Odor discrimination task: reliability
c) Odor identification task: reliability d) TDI 32 score: reliability
Figure 7 Correlational analyses between test–retest performance. Results are shown for the subtests (a) threshold, (b) discrimination, and (c) identification and (d) the composite TDI score of the 32-item version.
of odorants used. For example, when only 12 odorants (CC-SIT) are used instead of the 40 odorants (UPSIT), the coefficient of correlation between test/retest decreases to 0.71 (Doty et al. 1996). Also, when reducing the number of odorants in the identification task of the Sniffin’ Sticks, the coefficient of correlation falls from r = 0.73 (16 odorants) to r = 0.60 (12 odorants) (Hummel et al. 1997). Increasing the number of familiar odorants, however, does increase test– retest reliability of the Sniffin’ Sticks. Thus, compared with the standard version of the Sniffin’ Sticks, the extended version appears to be better suited for follow-up testing in small sample sizes in order to determine therapy response or to observe the course of olfactory function during disease. In large sample size, it may, however, be better to use only a shorter time of testing so that the 16-item test may be favor-able. According to our data, there is evidence again for the 16-item version to be a high-quality testing method.
Although reliability of the subtest discrimination and iden-tification was better in the 32-item version compared with the standard version, it did not reach the level of significance. It appears likely that both subtests may be used as single mea-surement in general practice or also in specialized centers. As they provide more information on olfactory abilities than usual screening methods, they might be of considerable in-terest, for example, in the diagnosis of neurodegenerative diseases. Especially, odor identification appears to be a very sensitive component in terms of diagnosis of olfactory loss in Parkinson’s disease (PD; Haehner et al. 2009). In this in-stance, a reliable test of odor identification alone might be simpler and equally informative compared with more exten-sive tests. However, recently, it also has been shown that ad-ditional testing of odor thresholds significantly adds to the quality of test results in PD patients (Boesveldt et al. 2009). In a relatively small sample size (246 patients and 50 healthy controls), we found that the composite 32-item ver-sion had accuracy above 95% in identifying people with smell loss, a result similar to that found using the 16-item version of the Sniffin’ Sticks (95% at a cutoff of a TDI score of 28). However, specificity of the extended test is 88%, which is higher than in the original version (82%). Limitations of the extended version include the fact that an approximate testing time of 40 min is required.
The present data suggest that, due to the high test–retest reliability, the 3 individual subtests, odor discrimination, odor identification, and odor threshold measurements, can be used separately in order to follow olfactory function over time. However, other recent research also indicates that the 3 individual subtests describe different aspects of olfactory function. Lo¨tsch et al. (2008) found that odor thresholds can be separated from those of odor identification and odor discrimination. Further, Larsson et al. (2004) report that odor discrimination is more strongly influenced by memory function than odor identification or odor thresholds. Thus, it would be best to perform all 3 subtests to obtain a maximum of reliable information. Due to time constraints, this will,
however, be only possible in specialized centers dedicated to smell and taste function. Alternatively, the present data indicate that the 32-item version of the Sniffin’ Sticks may prove as useful tool for the precise longitudinal testing of in-dividual olfactory subfunctions. Another point for future consideration should be the strong correlations between old and new part of the test that might justify their com-parable use in repeated testing in order to avoid common practice effects.
Funding
Swiss National Fund for Scientific Research (Schweizerischer Nationalfonds zur Fo¨rderung der wissenschaftlichen For-schung grant no. PASMA-119579/1) to B.N.L.
References
Boesveldt S, de Muinck Keizer RJO, Knol DL, Wolters EC, Berendse HW. 2009. Extended testing across, not within, tasks raises diagnostic accuracy of olfactory testing in Parkinson’s disease. Mov Disord. 24(1):85–90.
Cain WS, Gent JF, Goodspeed RB, Leonard G. 1988. Evaluation of olfactory dysfunction in the Connecticut Chemosensory Clinical Research Center (CCCRC). Laryngoscope. 98:83–88.
Croy I, Lange K, Krone F, Negoias S, Seo HS, Hummel T. 2009. Comparison between odor thresholds for phenyl ethyl alcohol and butanol. Chem Senses. 34:523–527.
Doty RL. 1989. The smell identification test administration manual. 2nd ed. Haddon Heights (NJ): Sensonics, Inc.
Doty RL, Marcus A, Lee WW. 1996. Development of the 12-item cross-cultural smell identification test (CC-SIT). Laryngoscope. 106:353–356. Dravnieks A, Masurat T, Lamm RA. 1984. Hedonics of odors and odor
descriptors. J Air Pollut Control Assoc. 34:752–755.
Haehner A, Boesveldt S, Berendse HW, Mackay-Sim A, Fleischmann J, Silburn PA, Johnston AN, Mellick GD, Herting B, Reichmann H, et al. 2009. Prevalence of smell loss in Parkinson’s disease—a multicenter study. Parkinsonism Relat Disord. 15:490–494.
Hummel T, Sekinger B, Wolf S, Pauli E, Kobal G. 1997. ‘‘Sniffin’ Sticks’’: olfactory performance assessed by the combined testing of odor identification, odor discrimination and olfactory threshold. Chem Senses. 22:39–52.
Hu¨ttenbrink KB. 1997. Disorders of smell and taste. Standard and recent methods in diagnosis and therapy. Laryngorhinootologie. 76:506–514. Kobal G, Hummel T, Sekinger B, Barz S, Roscher S, Wolf S. 1996. ‘‘Sniffin’
Sticks’’: screening of olfactory performance. Rhinology. 34:222–226. Larsson M, Nilsson LG, Olofsson JK, Nordin S. 2004. Demographic and
cognitive predictors of cued odor identification: evidence from a population-based study. Chem Senses. 29:547–554.
Lo¨tsch J, Reichmann H, Hummel T. 2008. Different odor tests contribute differently to the evaluation of olfactory loss. Chem Senses. 33:17–21. Wolfensberger M, Schnieper I. 1999. Sniffin’ Sticks: Ein neues Instrument
zur Geruchspru¨fung im klinischen Alltag. HNO. 47:629–636. Accepted August 16, 2009