Molecular Biogeography of Prickly Lettuce
(
Lactuca serriola L.) Shows Traces of Recent
Range Expansion
Luigi D’Andrea, Patrick Meirmans, Clemens van de Wiel,
Roberto Guadagnuolo, Robbert van Treuren, Gregor Kozlowski,
Hans den Nijs, and François Felber
From the Laboratoire de Botanique évolutive, Institut de Biologie, Université de Neuchâtel, Rue Emile-Argand 11, 2007 Neuchâtel, Switzerland (D’Andrea, Guadagnuolo, and Felber); Institute for Biodiversity & Ecosystem Dynamics (UvA), University of Amsterdam, Amsterdam, the Netherlands (Meirmans and den Nijs); Wageningen UR Plant Breeding, Wageningen, The Netherlands (van de Wiel); Centre for Genetic Resources, Wageningen, The Netherlands (van Treuren); Department of Biology, University of Fribourg, Fribourg, Switzerland (Kozlowski); and Musée et Jardins botaniques cantonaux, Lausanne, Switzerland (Felber).
Address correspondence to L. D’Andrea and F. Felber at the address above, or e-mail: lug.dandrea@gmail.com and francois.felber@vd.ch.
Abstract
Prickly lettuce (Lactuca serriola L., Asteraceae), a wild relative of cultivated lettuce, is an autogamous species which greatly expanded throughout Western and Northern Europe during the last 2 centuries. Here, we present a large-scale biogeographic genetic analysis performed on a dataset represented by 2622 individuals from 110 wild European populations. Thirty-two maternally inherited chloroplast RFLP-markers and 10 nuclear microsatellite loci were used. Microsatellites revealed low genetic variation and high inbreeding coefficients within populations, as well as strong genetic differentiation between populations, which was in accordance with the autogamous breeding system. Analysis of molecular variance based clustering indicated the presence of 3 population clusters, which showed strong geographical patterns. One cluster occupied United Kingdom and part of Northern Europe, and characterized populations with a single predominant genotype. The second mostly combined populations from Northern Europe, while the third cluster grouped populations particularly from Southern Europe. Kriging of gene diversity for L. serriola corroborated northwards and westwards spread from Central (Eastern) Europe. Significant lower genetic diversity characterized the newly colonized parts of the range compared to the historical ones, confirming the importance of founder effects. Stronger pattern of isolation by distance was assessed in the newly colonized areas than in the historical areas (Mantel’s r = 0.20). In the newly colonized areas, populations at short geographic distances were genetically more similar than those in the historical areas. Our results corroborate the species’ recent and rapid northward and westward colonization from Eastern Europe, as well as a decrease of genetic diversity in recently established populations.
Subject area: Population structure and phylogeography
Key words: biogeography, chloroplast PCR-RFLP, global change, kriging, Lactuca serriola, microsatellites, population genetics,
spatial autocorrelation
http://doc.rero.ch
Published in "Journal of Heredity 108(2): 194–206, 2017"
which should be cited to refer to this work.
Environmental changes directly or indirectly caused by human activities have led to drastic modifications of species’ ranges (Chen et al. 2011; Pauli et al. 2012). While many species have become endangered due to the fragmentation and reduction of their habi-tats, some others have greatly expanded their range as a result of human-mediated dispersal, creation of novel habitats and global warming. Such range expansions are expected to leave distinct traces in the genetic diversity and population structure of species. As range expansions generally occur through stepwise coloniza-tion, there will be continuous bottlenecking due to repeated founder effects (Ibrahim et al. 1996). Therefore, newly colonized areas are expected to have a lower genetic diversity than the original distri-bution areas. Furthermore, founder effects lead to increased genetic drift and therefore to stronger levels of differentiation among popu-lations in the newly colonized areas. Finally, self-fertilization can be instrumental in range expansions; when a new area is colonized by a single seed, self-fertilization will enable an individual to reproduce and spread, even in the absence of conspecific plants. Therefore, the genetic traces of range expansions are expected to be especially pre-sent in self-pollinating plants.
Prickly lettuce, Lactuca serriola (Asteraceae) is a native species of Southern Europe and Western Asia. Lactuca serriola has greatly expanded its range throughout Northern Europe during the past 2 centuries, which has been shown using a detailed analysis of herbar-ium and floristic data (D’Andrea et al. 2009). In Europe, the present range of the species therefore can be divided in 2 parts: the histori-cal range in the southern and central countries where the species was originally present mostly, and the newly colonized range in the Netherlands, northern Germany, the UK, and the southern parts of Scandinavia. A detailed analysis of the past and current distribution of L. serriola in the Netherlands showed that its ecological amplitude has broadened there (Hooftman et al. 2006). This broadening of the amplitude is likely not restricted to the Netherlands but should have also occurred elsewhere in Europe (Lebeda et al. 2001). The spe-cies has also widely spread outside of Northern Europe and to date has a synanthropic worldwide distribution (Carter and Prince 1985; Zohary 1991).
The reasons for the sudden expansion are not fully known. Hooftman et al. (2006) suggested that introgression from Lactuca
sativa (cultivated lettuce) to L. serriola might have contributed to
the European westward and northward expansion. This is corrobo-rated by the fact that, although L. serriola is a predominantly auto-gamous species, a significant rate of hybridization (up to 26%) with
L. sativa has been observed in experimental field trials (D’Andrea et al. 2008) and hybrids are vigorous and fertile (De Vries 1990). Recently, Uwimana et al. (2012), using Bayesian assignment analysis with microsatellite markers found very little evidence of introgres-sion in the recently colonized areas and concluded that other mecha-nisms than crop/wild gene flow are involved. D’Andrea et al. (2009) observed until the late 1970s a good correspondence between the distribution of L. serriola and the climatically suitable sites avail-able. However, in recent decades, the species was not in equilibrium with its niche, because some climatically suitable areas were not colonized by the species. It was concluded that the distribution of the species was not only driven by climatic changes but also by other components of global changes such as anthropogenic disturbance and occasional long distance seed dispersal promoted by a better interconnection between anthropogenic ecosystems (transportation axes) and a rise in the level of trade (seed transportation).
Several studies have investigated the genetic variation of
L. ser-riola and its distribution in natural populations, but none has
specifically looked at the impact of the recent range expansion. Kuang et al. (2008) investigated the variation of 41 populations of L. serriola using AFLP markers focusing mainly on Eastern Mediterranean populations, which are part of its historical distri-bution area. Interestingly, they found genetically highly variable populations in Eastern Turkey and Armenia that may correspond to the center of diversity of the species. Lebeda et al. (2009) assessed genetic variation across Europe using AFLP on single plants from 50 sampling sites. They found that accessions originating from vari-ous ecogeographical conditions in Europe differed significantly in their genetic and protein polymorphism as well as in morphology, forming 5 distinct geographical groups. Van de Wiel et al. (2010) studied the genetic variation of 50 populations from the UK, the Netherlands, Germany, and the Czech Republic and found globally a low observed heterozygosity and high population differentiation, while the intrapopulation variation ranged from complete homoge-neity to nearly complete heterogehomoge-neity. The highest genetic diversity was found in central Europe. Alexander (2013) investigated native European and non-native populations of different continents and observed that non-native ranges originated from European popula-tions. Though these studies have investigated different aspects of the genetic variation of L. serriola, a detailed molecular analysis over Europe to investigate the genetic traces of the recent range expansion is still lacking.
Here, we present the results of the first large-scale biogeographic genetic analysis of L. serriola based on the sampling of more than 100 natural populations from 17 countries across Europe. We stud-ied the molecular genetic variation at 10 nuclear microsatellites as well as chloroplast DNA polymorphism in order to address the fol-lowing questions:
• Is the recent expansion of the species reflected in the genetic population structure?
• Are recently colonized areas genetically less diverse? Is there evi-dence of multiple founder events in populations?
• Is there a pattern of isolation by distance, and is this pattern dif-ferent in the recently colonized areas?
• What is the impact of the autogamous breeding system on genetic structure?
Materials and Methods
Studied Species
The genus Lactuca (Asteraceae) includes approximately 100 species and is distributed in temperate and warm regions of the Northern hemisphere, as well as Northern Africa and North and South-America (Zohary 1991; Frietema de Vries 1992). Despite this wide distribution, the majority of the species can be found in Central Asia and the Mediterranean Basin, which are considered the main centers of diversity (Stebbins 1953; Vuilleum 1973; Feràkovà 1977; Mejias 1993). The most widely distributed species of the genus is prickly let-tuce or compass letlet-tuce (L. serriola L.), a winter or summer annual species that prefers a warm-temperate climate and shows a distribu-tion area that covers most of Western Eurasia (Lebeda et al. 2004). It is a common annual ruderal species and each individual produces a large number of fruits transported by wind. It is considered to be drought tolerant (Werk 1986) and grows mainly in anthropogenic habitats with a sunny exposure such as roadsides, railways, dumps, and urban areas. Prickly lettuce also occurs as a weed in orchards, vineyards, and pastures (Weaver and Downs 2003; Lebeda et al. 2004; Lebeda et al. 2007).
Plant Material
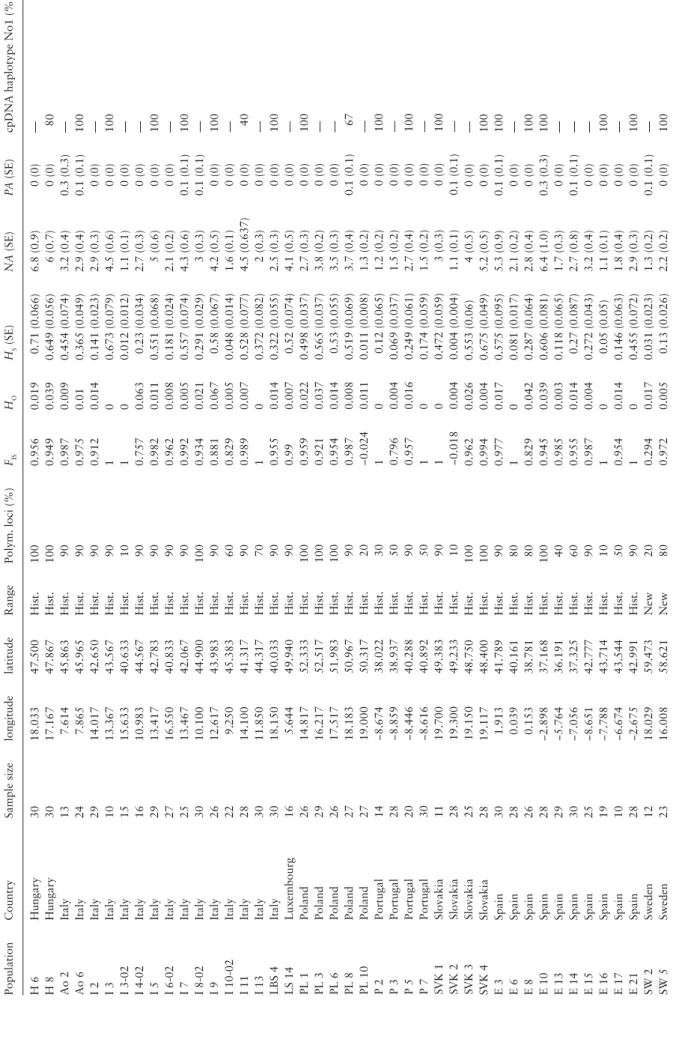
Seeds were sampled from 110 populations from 17 countries along several North-South and East-West transects in Europe (Table 1). Seeds were sampled separately from 30 to 35 plants per population. A single seed per sampled plant was germinated and total DNA was extracted from fresh young leaves following the QIAGEN® extrac-tion kit protocol. The populaextrac-tions from the United Kingdom were sampled in the context of a related project (Lebeda et al. 2007), and the microsatellite data generated within the latter project were added to the dataset of the present study. Between 9 and 35 of the seed-lings (with a mean of 23.8) were analyzed per populations. Based on the results of D’Andrea et al. (2009), the samples were divided into 2 groups (Figure 1; separated by a dotted line): 1) those from newly colonized areas where L. serriola has recently experienced an extensive expansion (26 populations), and 2) those from its histori-cal distribution range (84 populations). The newly colonized areas included Scandinavia, Northern Germany, the Netherlands, and the United Kingdom. These areas either have been colonized recently, namely from 1800 onwards, or are areas where the species was historically present at very low densities but has recently expanded substantially (Hooftman et al. 2006; D’Andrea et al. 2009). These groups were chosen with a conservative approach because L.
ser-riola also increased its density even in the historical range. Though
we realize that this classification into 2 groups represents a severe simplification of the gradual, but rapid, nature of the range expan-sion, it provides us with a unique approach to test the effects of this range expansion on genetic diversity and population structure. Microsatellite Analysis
Ten polymorphic microsatellite loci (LsD106, LsE003, LsB101, LsB104, LsA001, LsA004, LsD109, LsD108, LsE011, LsE018) described in van de Wiel et al. (1999) were used to genotype the samples.
The microsatellites analysis for loci LsD106, LsE003, LsB101, LsB104, LsA001, and LsA004 were performed at Plant Research International in Wageningen (the Netherlands). Polymerase chain reactions (PCR) for these loci were performed in 2 multiplex reac-tions, both using 12 μL of PCR mix and 8 μL of DNA template (to a final concentration of about 2 ng/reaction) in a total volume of 20 μL; end concentrations of primer pairs were optimized to 1.6 pMol/reaction of LsA001 (NED label), 1.2 pMol/reaction of LsA004 (FAM label), and 0.6 pMol/reaction of LsD106 (HEX label) for multiplex “A,” and 1.6 pMol/reaction of LsB101 (NED label), 1.6 pMol/reaction of LsB104 (FAM label), 2 pMol/reaction of LsD103 (FAM label), and 4 pMol/reaction of LsE003 (HEX label) for mul-tiplex “B,” respectively, from stock solutions of 10 pMol/μL. Locus LsD103 was removed from the analysis as it gave too many null alleles. The PCR reaction was performed on a MJ PTC200 thermo-cycler, using a heated lid, as follows: 1 cycle at 94 °C for 3 min, fol-lowed by 30 cycles at 94 °C for 30 s, 50 °C for 30 s (ramp 1 °C/s to Ta), and 72 °C for 45 s (ramp 1 °C/s to Tp), ending with one cycle at 72 °C for 10 min. After separation of PCR products on Sephadex 50, samples were prepared for loading on an ABI 3700 Sequencer by mixing 1.5 µL of a 1:1 mixture of both PCR reactions with 2.5 µL ultrapure formamide, 0.5 µL Loading buffer (PE Biosystems) and 0.5 µL Size Standard with Rox label. The samples were denatured for 2 min at 90 °C and then immediately put on ice; 1.25 µL sample was loaded in the sequencer. For detection, the filterset D was used on the ABI Sequencer 3700, which was calibrated for the color labels Ned (yellow), Fam (blue), Hex (green), and Rox (red, size standard).
Microsatellite analysis for loci LsD109, LsD108, LsE011, and LsE018 was performed at the Laboratory of Evolutionary Botany, University of Neuchâtel (Switzerland). PCR reactions were performed using 5 μL of PCR mix and 1.5 μL of DNA template (to a final con-centration of about 5 ng/reaction) in a total volume of 5.5 μL; end concentrations of primer pairs were optimized to 10 pMol/μL. PCR amplification were performed on a Whatman Biometra T gradient, using a heated lid, as follows: 1 cycle of 15 min at 95 °C to activate the Hotstar Taq polymerase linked to 12 cycles with a touch down of 0.5 °C per cycle of 30 s at 94 °C, 1 min 30 at 65 °C (LsE018, LsE011) 60°C (LsD109) 67 °C (LsD108), 1 min at 72 °C, followed by 17 cycles of 30 s at 94 °C, 1 min 30 at 59 °C (LsE018, LsE011) 54 °C (LsD109) 61 °C (LsD108), 1 min at 72 °C, followed by 3 min at 72 °C to complete primer extension. Samples were prepared for loading in an acrylamide gel in a LI-COR DNA analyser IR2 by mix-ing 1 µL of PCR reactions with 5 µL deionized H2O and 5 µL blue
dye containing formamide. The samples were denatured for 2 min at 90 °C and then directly put on ice; 1.5 µL samples were loaded in an acrylamide gel in the sequencer. For detection, the LI-COR DNA analyser IR2 was calibrated for the wavelengths 700 nm (LsD109, LsD108) and 800 nm (LsE011, LsE018). The sizing of the microsat-ellite fragments was performed with the software LI-COR SAGAGT
microsatellite analysis. When necessary (e.g., data from the United Kingdom), calibration of SSR scores between laboratories was per-formed using a set of 3 lettuce reference samples.
Chloroplast PCR-RFLPs
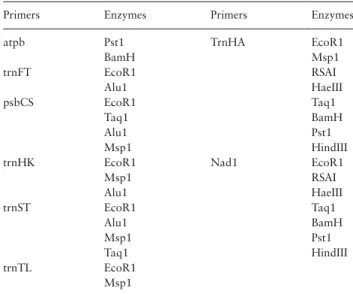
In order to investigate chloroplast DNA variation, 32 combinations of primer pairs and restriction enzymes (Table 2) were tested in a prescreening using a subset of 30–34 individuals from 17 different populations covering the European distribution area. Amplification of cpDNA was carried out using 10 universal primer pairs devel-oped by Dumolin-Lapegue et al. (1997): VL, TrnVS, TrnST, TrnSM, TrnQB, TrnTL, Hk, psbCS, FV, atpb. Chloroplast polymerase chain reaction-restriction fragment length polymorphism (PCR-RFLP) analyses were performed using 23 μL of PCR mix and a 1.5 μL solu-tion containing 50 ng of template DNA. PCR amplificasolu-tion of chlo-roplast DNA fragments were performed on a Whatman Biometra T gradient, with the following protocol: 1 cycle of 15 min at 95 °C to activate the Hotstar Taq polymerase linked to 35 cycles of 30 s at 94 °C, 45 s at 50 °C, 1 min 30 at 72 °C, followed by 5 min at 72 °C to complete primer extension. Restriction was performed in a separate reaction for each enzyme, using the enzymes TaqΙ, AluΙ,
RsaΙ, HaeΙΙΙ, PstΙ, BamH, according to the providers’ recommenda-tions, using 5 μL of amplified DNA and incubating for 4 h at 37 °C. Samples were prepared for loading by mixing the reaction product and a formamide-based loading dye in a 1:1 ratio. After denatura-tion for 2 min at 95 °C, samples were loaded and separated in a 5% acrylamide gel. Only the enzyme-primer combination psbCS-Alu1 was found to be polymorphic, revealing 2 haplotypes (Table 1). Subsequently, this enzyme-primer combination was used on a subset of the data to analyze 771 samples from 58 selected populations. Data Analysis
For each of the 10 microsatellite loci, we recorded the total number of observed alleles and the range of allele sizes, and calculated the within population gene diversity HS to assess overall polymorphism, the observed level of heterozygosity HO, and the inbreeding coef-ficient Fis using the software GenAlEx 6.501 (Peakall and Smouse 2006, 2012). For all 110 populations (2622 individuals) we also
Table 1
.
Origin of the sampled populations of pric
kly let
tuce, with the coordinates presented in decimal degrees and the range defined a
s either historical (hist.) or new
Population Country Sample size longitude latitude Range Polym. loci (%) FIS HO HS (SE) NA (SE) PA (SE)
cpDNA haplotype No1 (%)
A 3 Austria 28 14.517 48.150 Hist. 100 0.987 0.007 0.618 (0.028) 4.3 (0.3) 0 (0) 58 A 5 Austria 15 13.083 47.850 Hist. 100 0.977 0.007 0.509 (0.044) 2.9 (0.2) 0 (0) 83 A 7 Austria 28 12.250 47.417 Hist. 60 1 0 0.122 (0.049) 1.7 (0.2) 0 (0) — A 8 Austria 30 11.500 47.333 Hist. 30 1 0 0.039 (0.026) 1.3 (0.2) 0.1 (0.1) — A 9 Austria 30 10.500 47.100 Hist. 100 0.993 0.003 0.36 (0.024) 3.1 (0.3) 0 (0) 87 A 10 Austria 29 9.900 47.150 Hist. 90 1 0 0.085 (0.02) 1.9 (0.1) 0 (0) — A 11 Austria 29 9.767 47.367 Hist. 30 0.884 0.004 0.07 (0.052) 1.5 (0.3) 0 (0) — PK 1 Bulgaria 19 23.744 42.490 Hist. 90 0.933 0.04 0.674 (0.083) 6 (0.9) 0 (0) 67 PK 2 Bulgaria 28 27.950 43.200 Hist. 90 0.538 0.018 0.116 (0.048) 2 (0.1) 0 (0) 7 PK 3 Bulgaria 29 23.744 42.490 Hist. 100 0.958 0.031 0.645 (0.061) 5.2 (0.6) 0.2 (0.1) 80 LSC 2 Czech Republic 25 13.896 49.634 Hist. 100 1 0 0.561 (0.029) 3.5 (0.2) 0 (0) — LSC 4 Czech Republic 29 13.871 50.250 Hist. 100 0.988 0.008 0.654 (0.029) 5.9 (0.6) 0 (0) 53 LSC 6 Czech Republic 30 14.475 49.797 Hist. 100 0.986 0.007 0.452 (0.05) 3.2 (0.3) 0.5 (0.2) 100 DEN O Denmark 24 10.550 55.483 New 20 0.381 0.018 0.057 (0.049) 1.1 (0.2) 0.1 (0.1) 100 DEN R Denmark 25 11.000 55.700 New 10 1 0 0.008 (0.008) 1.1 (0.1) 0 (0) — DEN S Denmark 27 11.383 55.400 New 90 0.95 0.022 0.427 (0.063) 2.9 (0.4) 0 (0) 87 F 6 France 18 2.749 42.480 Hist. 90 0.868 0.067 0.518 (0.063) 3.7 (0.5) 0 (0) — F 8 France 29 0.477 44.866 Hist. 80 0.986 0.007 0.483 (0.083) 4 (0.7) 0.2 (0.2) — F 10 France 26 2.806 45.693 Hist. 70 1 0 0.096 (0.026) 1.8 (0.2) 0 (0) 23 F 12 France 28 0.846 43.511 Hist. 60 0.775 0.033 0.196 (0.059) 2 (0.3) 0 (0) 100 FF 1 France 31 −1.083 46.683 Hist. 70 0.971 0.01 0.261 (0.067) 1.7 (0.2) 0 (0) 100 GM 1 France 25 4.083 43.917 Hist. 100 1 0 0.66 (0.038) 5.4 (0.7) 0 (0) 100 LS 2 France 20 5.116 44.704 Hist. 90 0.88 0.048 0.451 (0.066) 3.8 (0.4) 0 (0) — LS 3 France 24 4.713 45.415 Hist. 100 0.992 0.006 0.343 (0.084) 4.3 (0.7) 0.5 (0.3) — LS 7 France 18 4.716 46.739 Hist. 90 0.602 0.055 0.238 (0.07) 2.6 (0.3) 0 (0) — LS 9 France 20 5.129 47.536 Hist. 100 0.978 0.017 0.658 (0.067) 5.4 (0.5) 0 (0) 25 LS 11 France 21 5.704 48.324 Hist. 90 0.901 0.056 0.496 (0.072) 3.2 (0.4) 0 (0) — LS 13 France 20 5.784 49.326 Hist. 100 1 0 0.468 (0.049) 3.5 (0.43) 0.1 (0.1) 9 D 2 Germany 29 9.250 49.446 Hist. 100 0.888 0.028 0.225 (0.021) 2.8 (0.2) 0 (0) — D 5 Germany 29 9.831 50.094 Hist. 100 0.991 0.004 0.309 (0.043) 3.3 (0.3) 0 (0) 100 D 7 Germany 29 9.816 50.994 Hist. 100 0.986 0.007 0.531 (0.04) 3.1 (0.3) 0 (0) — D 10 Germany 29 10.494 52.140 Hist. 90 0.985 0.007 0.464 (0.054) 3.4 (0.3) 0 (0) — D 12 Germany 29 7.452 50.226 Hist. 100 0.995 0.003 0.63 (0.059) 4.3 (0.4) 0 (0) 67 D 21 Germany 19 8.783 48.583 Hist. 100 1 0 0.37 (0.062) 2.7 (0.3) 0 (0) — LBM 1 Germany 27 8.883 48.600 Hist. 100 0.921 0.047 0.612 (0.039) 4.1 (0.47) 0 (0) 71 LBM 2 Germany 35 9.767 48.083 Hist. 100 0.993 0.003 0.457 (0.014) 2.5 (0.2) 0 (0) — LS 17 Germany 21 11.406 53.661 New 90 1 0 0.192 (0.035) 1.9 (0.1) 0 (0) 0 LS 21 Germany 23 10.577 54.022 New 80 0.956 0.012 0.275 (0.054) 2.7 (0.4) 0.2 (0.1) — LS 22 Germany 30 11.700 48.950 Hist. 100 1 0 0.46 (0.067) 4.5 (0.5) 0 (0) 7 PK 4 Greece 27 21.000 40.050 Hist. 90 0.89 0.065 0.383 (0.079) 4.3 (0.5) 0.3 (0.3) 100 H 1 Hungary 29 19.167 47.750 Hist. 100 0.967 0.022 0.637 (0.052) 5.4 (0.6) 0 (0) 100 H 3 Hungary 28 20.800 47.967 Hist. 100 0.98 0.015 0.735 (0.04) 6.1 (0.7) 0 (0) 60 H 4 Hungary 30 19.067 47.383 Hist. 100 0.861 0.088 0.625 (0.033) 5 (0.5) 0 (0) —
http://doc.rero.ch
Population Country Sample size longitude latitude Range Polym. loci (%) FIS HO HS (SE) NA (SE) PA (SE)
cpDNA haplotype No1 (%)
H 6 Hungary 30 18.033 47.500 Hist. 100 0.956 0.019 0.71 (0.066) 6.8 (0.9) 0 (0) — H 8 Hungary 30 17.167 47.867 Hist. 100 0.949 0.039 0.649 (0.056) 6 (0.7) 0 (0) 80 Ao 2 Italy 13 7.614 45.863 Hist. 90 0.987 0.009 0.454 (0.074) 3.2 (0.4) 0.3 (0.3) — Ao 6 Italy 24 7.865 45.965 Hist. 90 0.975 0.01 0.365 (0.049) 2.9 (0.4) 0.1 (0.1) 100 I 2 Italy 29 14.017 42.650 Hist. 90 0.912 0.014 0.141 (0.023) 2.9 (0.3) 0 (0) — I 3 Italy 10 13.367 43.567 Hist. 90 1 0 0.673 (0.079) 4.5 (0.6) 0 (0) 100 I 3-02 Italy 15 15.633 40.633 Hist. 10 1 0 0.012 (0.012) 1.1 (0.1) 0 (0) — I 4-02 Italy 16 10.983 44.567 Hist. 90 0.757 0.063 0.23 (0.034) 2.7 (0.3) 0 (0) — I 5 Italy 29 13.417 42.783 Hist. 90 0.982 0.011 0.551 (0.068) 5 (0.6) 0 (0) 100 I 6-02 Italy 27 16.550 40.833 Hist. 90 0.962 0.008 0.181 (0.024) 2.1 (0.2) 0 (0) — I 7 Italy 25 13.467 42.067 Hist. 90 0.992 0.005 0.557 (0.074) 4.3 (0.6) 0.1 (0.1) 100 I 8-02 Italy 30 10.100 44.900 Hist. 100 0.934 0.021 0.291 (0.029) 3 (0.3) 0.1 (0.1) — I 9 Italy 26 12.617 43.983 Hist. 90 0.881 0.067 0.58 (0.067) 4.2 (0.5) 0 (0) 100 I 10-02 Italy 22 9.250 45.383 Hist. 60 0.829 0.005 0.048 (0.014) 1.6 (0.1) 0 (0) — I 11 Italy 28 14.100 41.317 Hist. 90 0.989 0.007 0.528 (0.077) 4.5 (0.637) 0 (0) 40 I 13 Italy 30 11.850 44.317 Hist. 70 1 0 0.372 (0.082) 2 (0.3) 0 (0) — LBS 4 Italy 30 18.150 40.033 Hist. 90 0.955 0.014 0.322 (0.055) 2.5 (0.3) 0 (0) 100 LS 14 Luxembourg 16 5.644 49.940 Hist. 90 0.99 0.007 0.52 (0.074) 4.1 (0.5) 0 (0) — PL 1 Poland 26 14.817 52.333 Hist. 100 0.959 0.022 0.498 (0.037) 2.7 (0.3) 0 (0) 100 PL 3 Poland 29 16.217 52.517 Hist. 100 0.921 0.037 0.565 (0.037) 3.8 (0.2) 0 (0) — PL 6 Poland 26 17.517 51.983 Hist. 100 0.954 0.014 0.53 (0.055) 3.5 (0.3) 0 (0) — PL 8 Poland 27 18.183 50.967 Hist. 90 0.987 0.008 0.519 (0.069) 3.7 (0.4) 0.1 (0.1) 67 PL 10 Poland 27 19.000 50.317 Hist. 20 −0.024 0.011 0.011 (0.008) 1.3 (0.2) 0 (0) — P 2 Portugal 14 −8.674 38.022 Hist. 30 1 0 0.12 (0.065) 1.2 (0.2) 0 (0) 100 P 3 Portugal 28 −8.859 38.937 Hist. 50 0.796 0.004 0.069 (0.037) 1.5 (0.2) 0 (0) — P 5 Portugal 20 −8.446 40.288 Hist. 90 0.957 0.016 0.249 (0.061) 2.7 (0.4) 0 (0) 100 P 7 Portugal 30 −8.616 40.892 Hist. 50 1 0 0.174 (0.059) 1.5 (0.2) 0 (0) — SVK 1 Slovakia 11 19.700 49.383 Hist. 90 1 0 0.472 (0.059) 3 (0.3) 0 (0) 100 SVK 2 Slovakia 28 19.300 49.233 Hist. 10 −0.018 0.004 0.004 (0.004) 1.1 (0.1) 0.1 (0.1) — SVK 3 Slovakia 25 19.150 48.750 Hist. 100 0.962 0.026 0.553 (0.06) 4 (0.5) 0 (0) — SVK 4 Slovakia 28 19.117 48.400 Hist. 100 0.994 0.004 0.675 (0.049) 5.2 (0.5) 0 (0) 100 E 3 Spain 30 1.913 41.789 Hist. 90 0.977 0.017 0.575 (0.095) 5.3 (0.9) 0.1 (0.1) 100 E 6 Spain 28 0.039 40.161 Hist. 80 1 0 0.081 (0.017) 2.1 (0.2) 0 (0) — E 8 Spain 26 0.153 38.781 Hist. 80 0.829 0.042 0.287 (0.064) 2.8 (0.4) 0 (0) 100 E 10 Spain 28 −2.898 37.168 Hist. 100 0.945 0.039 0.606 (0.081) 6.4 (1.0) 0.3 (0.3) 100 E 13 Spain 29 −5.764 36.191 Hist. 40 0.985 0.003 0.118 (0.065) 1.7 (0.3) 0 (0) — E 14 Spain 30 −7.056 37.325 Hist. 60 0.955 0.014 0.27 (0.087) 2.7 (0.8) 0.1 (0.1) — E 15 Spain 25 −8.651 42.777 Hist. 90 0.987 0.004 0.272 (0.043) 3.2 (0.4) 0 (0) — E 16 Spain 19 −7.788 43.714 Hist. 10 1 0 0.05 (0.05) 1.1 (0.1) 0 (0) 100 E 17 Spain 10 −6.674 43.544 Hist. 50 0.954 0.014 0.146 (0.063) 1.8 (0.4) 0 (0) — E 21 Spain 28 −2.675 42.991 Hist. 90 1 0 0.455 (0.072) 2.9 (0.3) 0 (0) 100 SW 2 Sweden 12 18.029 59.473 New 20 0.294 0.017 0.031 (0.023) 1.3 (0.2) 0.1 (0.1) — SW 5 Sweden 23 16.008 58.621 New 80 0.972 0.005 0.13 (0.026) 2.2 (0.2) 0 (0) 100 Table 1 . Continued
http://doc.rero.ch
Population Country Sample size longitude latitude Range Polym. loci (%) FIS HO HS (SE) NA (SE) PA (SE)
cpDNA haplotype No1 (%)
SW 7 Sweden 9 15.087 57.664 New 0 — 0 0 (0) 1 (0) 0 (0) — SW 10 Sweden 12 15.059 56.164 New 100 0.669 0.083 0.274 (0.029) 2.3 (0.2) 0 (0) — SW 12 Sweden 10 13.087 55.436 New 100 1 0 0.335 (0.004) 2 (0) 0 (0) — SW 14 Sweden 14 17.025 60.659 New 50 1 0 0.118 (0.051) 1.6 (0.21) 0 (0) 100 CH 1 Switzerland 28 6.803 46.931 Hist. 100 0.916 0.018 0.297 (0.063) 3.6 (0.4) 0 (0) 100 CH 12 Switzerland 24 9.333 47.333 Hist. 50 0.983 0.004 0.15 (0.056) 1.9 (0.3) 0 (0) — CH 15 Switzerland 17 9.033 46.200 Hist. 50 1 0 0.19 (0.08) 1.9 (0.4) 0.3 (0.2) — CH 16 Switzerland 20 8.733 46.500 Hist. 80 0.98 0.01 0.457 (0.079) 2.7 (0.4) 0 (0) 100 CH 17 Switzerland 29 8.800 47.250 Hist. 100 0.939 0.025 0.428 (0.046) 3.7 (0.4) 0 (0) 93 Hol 1 Netherlands 27 5.955 51.868 New 100 0.863 0.008 0.337 (0.054) 3 (0.3) 0 (0) — Hol 12 Netherlands 24 5.754 51.886 New 30 0.515 0.013 0.067 (0.051) 1.6 (0.3) 0 (0) — Hol 16 Netherlands 27 4.219 51.975 New 80 0.99 0.004 0.443 (0.079) 2.7 (0.4) 0 (0) 100 Hol 17 Netherlands 28 5.188 51.903 New 80 0.986 0.007 0.446 (0.087) 2.5 (0.3) 0 (0) — Hol 20 Netherlands 29 6.269 51.923 New 80 0.988 0.005 0.369 (0.064) 2.1 (0.3) 0 (0) 0 Hol 21 Netherlands 30 4.773 52.653 New 70 1 0 0.075 (0.024) 1.8 (0.2) 0 (0) — UK 3 United Kingdom 16 −0.403 52.121 New 0 — 0 0 (0) 0.9 (0.1) 0 (0) — UK 4 United Kingdom 15 −1.776 52.283 New 10 1 0 0.012 (0.012) 1 (0.1) 0 (0) — UK 5 United Kingdom 16 −0.428 52.506 New 20 1 0 0.065 (0.046) 1.1 (0.2) 0 (0) — UK 6 United Kingdom 15 −0.202 52.644 New 10 0.871 0.007 0.052 (0.052) 1.1 (0.2) 0 (0) — UK 7 United Kingdom 16 0.148 52.515 New 40 1 0 0.058 (0.026) 1.4 (0.3) 0 (0) — UK 8 United Kingdom 16 −1.493 52.220 New 10 1 0 0.03 (0.03) 1 (0.1) 0 (0) — UK 9 United Kingdom 14 −1.380 52.249 New 50 1 0 0.134 (0.049) 1.6 (0.3) 0 (0) — UK 11 United Kingdom 15 −2.439 51.370 New 30 1 0 0.121 (0.062) 1.2 (0.2) 0 (0) — UK 12 United Kingdom 15 −2.583 51.450 New 20 1 0 0.025 (0.017) 1.1 (0.28) 0 (0) —
Genetic variability within populations is denoted by the percentage of polymorphic loci,
FIS (inbreeding coefficient), H O (observed heterozygosity), H S (expected heterozygosity), AR (allelic richness), PA R (private allelic
richness) for the nuclear microsatellites and by the frequency of haplotype 1 for the chloroplast PCR–RFLP marker
.
Table 1
.
Continued
calculated HO and HS (using GenAlEx), as well as the allelic richness and the private allelic richness. The latter 2 statistics were calculated using the software HP-Rare (Kalinowski 2005), based on rarefaction performed by downsampling to 9 individuals. Statistics based on allele identity (F-statistics) were used to analyze the differentiation between populations, for each locus separately as well as for all loci combined. Moreover, a standardized cFST, independent of the level of
within subpopulation genetic variation (Hedrick 2005; Meirmans and Hedrick 2011), was calculated by dividing the Fst value by the maximum possible value (denoted by Fst(max)), given the observed amount of genetic variation (Meirmans 2006). These computations were performed using GenoDive version 2.0b23 (Meirmans and Van Tienderen 2004). GenoDive was also used to calculate FST based on the chloroplast haplotypes. The selfing rate was estimated using the Bayesian inference method implemented in the program InStruct (Gao et al. 2007) with 2 MCMC chains of length 100 000 and a burn-in of 20 000 assuming k = 1.
The presence of higher-order population structure was detected using analysis of molecular variance (AMOVA)-based K-means clus-tering (Meirmans 2012) and using Tess3 (Caye et al. 2015). The for-mer method uses an AMOVA (Excoffier et al. 1992) to detect groups of populations. This method does not assume Hardy–Weinberg equi-librium and can therefore be used for predominantly selfing species
such as L. serriola. The program was run with the number of clus-ters (k) ranging from 1 to 10; the optimal number of clusclus-ters was determined using the Bayesian information criterion (BIC, Schwarz 1978), which has been shown to perform very well for population genetic data (Jombart et al. 2010; Meirmans 2012). The clustering was performed with a simulated annealing chain of 50 000 steps, and 200 random runs. Tess3 uses both the genetic and spatial data to calculate ancestry coefficients based on a user-specified number of clusters (Frichot et al. 2014). Tess3 was run with the default settings with the number of clusters (k) ranging from 1 to 7, with 5 replicates for every value of k; long runtimes and large memory requirements prevented us from running Tess3 for higher values of k. For every replicate run, the cross-entropy was calculated with the percentage of masked genotypes set at 5%.
Isolation by Distance
The relationships between the genetic distance and the geographic distance of the samples was investigated by Mantel tests (Mantel 1967), partial Mantel tests (Smouse et al. 1986) and Mantel correlo-grams (Sokal 1986). We used GenoDive to calculate a matrix of pair-wise Fst values between all populations, both for the microsatellites and the cpDNA haplotypes, as well as a matrix of geographic dis-tances between all populations. Isolation by distance can lead to very similar results in Mantel tests as higher-level population structure. To distinguish between these 2 options, we used the approach sug-gested by Meirmans (2012). To test whether the population structure was not an artefact of isolation by distance, we performed a partial Mantel test, testing the association between the genetic distances and a model matrix expressing the population groups, while correcting for the geographical distance. A Mantel correlogram was used to further visualize the pattern of spatial autocorrelation.
To estimate the influence of spatial processes on the distribution of the total genetic variation, we followed the approach suggested by Meirmans (2015). First, a matrix of population allele frequencies was calculated using GenoDive. Then a second matrix containing spatial variables was created in R (R Core Team 2014) by calculat-ing orthogonal third-degree polynomials based on the populations’ locations. A redundancy analysis (RDA) was then performed with the allele frequencies as dependent matrix and the spatial variables as independent matrix. Forward selection of spatial variables was performed in order to prevent overfitting. The proportion of varia-tion explained by the RDA was then multiplied by the overall value of FST to obtain the percentage of the total genetic variation that is explained by the spatial variables.
Figure 1. Distribution of sampling locations over Europe. The dotted line separates the assumed division between the historical distribution areas and the
recently colonized areas. The newly colonized areas included Scandinavia, Northern Germany, the Netherlands, and the United Kingdom. (A) Results of the AMOVA-based clustering for k = 3 (each color/symbol corresponds to a different cluster); (B) Distribution of the 2 haplotypes of the chloroplast marker. Haplotype 1 = light grey and haplotype 2 = black.
Table 2. Primer-enzyme combinations tested for variability in chloroplast PCR–RFLP markers
Primers Enzymes Primers Enzymes
atpb Pst1 TrnHA EcoR1
BamH Msp1 trnFT EcoR1 RSAI Alu1 HaeIII psbCS EcoR1 Taq1 Taq1 BamH Alu1 Pst1 Msp1 HindIII
trnHK EcoR1 Nad1 EcoR1
Msp1 RSAI Alu1 HaeIII trnST EcoR1 Taq1 Alu1 BamH Msp1 Pst1 Taq1 HindIII trnTL EcoR1 Msp1
http://doc.rero.ch
Spatial Organization of Genetic Diversity
To obtain a more detailed overview of the distribution of the gene diversity across populations, a map was produced using the tech-nique of kriging, which extrapolates the values of a variable at unex-amined locations using the observed values from nearby locations (Cressie 1993). The technique starts with fitting the experimental variogram to a model. For each point on a regular grid, the extrapo-lated value is then obtained by calculating a weighted average of nearby points, while the expected values from the model variogram are used as weights. A simulation approach can be used to estimate the variability of the variable and to create a probability map (Chilès and Delfiner 1999). Kriging was performed using Arc Map 9.0 (ESRI®), with a cell size of 0.5 km × 0.5 km. Using the Arc Map grid-analyst, the maps were extracted from the grid into new maps corresponding to the study area.
Differences between New and Historical Ranges
We used the method of Goudet (1995) to test the differences in genetic diversity and population structure between the historical range and the recently colonized area (Figure 1). For each popula-tion, the genetic diversity within populations (HS) and their average were calculated for each of the 2 areas. We then used 9999 Monte-Carlo permutations to test the differences between the 2 areas by permuting the populations over the 2 groups, using the difference in average diversity as a test statistics. The same approach was used for testing whether there was a difference in population structure and the amount of inbreeding, using FST, FST′, and FIS as test statistics. We
also studied whether there were any differences in the magnitude of the spatial autocorrelation in the 2 areas by calculating Mantel tests and Mantel correlograms separately for the 2 areas.
Results
Overall Diversity
The distribution of the microsatellite variation among individu-als within populations showed strong inbreeding, as could be expected given the predominantly autogamous breeding system of
L. serriola. Observed heterozygosity (HO) differed between loci, but was generally very low (overall HO of 0.014, Table 3) when compared to the expected heterozygosity (overall HS = 0.35). As a result, the overall inbreeding coefficient was close to 1 (FIS = 0.962).
There were only a few populations with markedly lower FIS values and there was no geographical pattern in their distribution: popula-tion Den O from Denmark (FIS = 0.381), population SW 2 from Sweden (FIS = 0.29), PL 10 from Poland (FIS = −0.024), and SVK 2 from Slovakia (FIS = −0.018). Notably, all these populations had very low levels of genetic variation. This indicates that their low FIS val-ues were the result of estimation error: the standard error of FIS can be very high in the near absence of genetic variation. We observed only a few populations harboring heterozygotes which were distrib-uted all over Europe (Table 1). In agreement with the high FIS values, the Bayesian inference of the rate of selfing resulted in an estimated value of 0.955.
Interpopulation Diversity
A large percentage of the total genetic variation was distributed among populations with an overall FST value of 0.555 (P = 0.001), and a FST′ value of 0.875. Despite the strong population differen-tiation, only few populations were found to harbor private alleles. Furthermore, low frequency alleles (alleles present in 25% or less of the populations) were very rare in northern and western popula-tions. A striking result was the wide geographic distribution of a sin-gle multilocus genotype, occurring over almost 1000 km, which was also found in the genetic diversity study for the United Kingdom, Netherlands, Germany, and the Czech Republic by van de Wiel et al. (2010). It dominated all populations from the United Kingdom, even though they were separated by more than 200 km. The same geno-type was also found in one population from Denmark (DEN 0) and several Dutch populations (Hol 16, 17, 20).
In the AMOVA-based clustering, the lowest value of BIC was found at k = 3, indicating an optimum of 3 populations clusters in the data (Supplementary Figure S1a). Differentiation between the three clusters was moderately strong with an FCT-value of 0.114 (F′CT = 0.449). The clusters showed a strong geographical pattern in
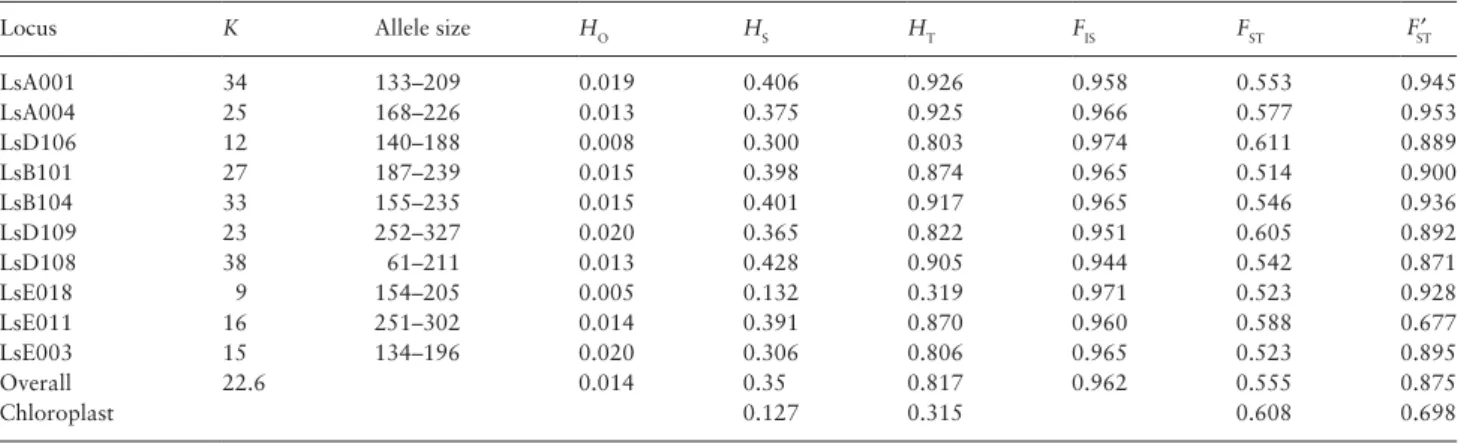
their distribution (Figure 1A). One north-western cluster was com-pletely dominated by the populations carrying the aforementioned widespread genotype. This cluster was also present at k = 2, indi-cating that the widespread genotype is a major defining factor in the population structure of L. serriola. The second cluster predomi-nantly included populations from Central Eastern Europe, while the third cluster combined populations mostly from Southern Europe. Exceptions to this finding involved one population in Italy grouping Table 3. Genetic variation per locus within and among prickly lettuce populations analyzed with nuclear microsatellites and chloroplast PCR–RFLP
Locus K Allele size HO HS HT FIS FST FST′
LsA001 34 133–209 0.019 0.406 0.926 0.958 0.553 0.945 LsA004 25 168–226 0.013 0.375 0.925 0.966 0.577 0.953 LsD106 12 140–188 0.008 0.300 0.803 0.974 0.611 0.889 LsB101 27 187–239 0.015 0.398 0.874 0.965 0.514 0.900 LsB104 33 155–235 0.015 0.401 0.917 0.965 0.546 0.936 LsD109 23 252–327 0.020 0.365 0.822 0.951 0.605 0.892 LsD108 38 61–211 0.013 0.428 0.905 0.944 0.542 0.871 LsE018 9 154–205 0.005 0.132 0.319 0.971 0.523 0.928 LsE011 16 251–302 0.014 0.391 0.870 0.960 0.588 0.677 LsE003 15 134–196 0.020 0.306 0.806 0.965 0.523 0.895 Overall 22.6 0.014 0.35 0.817 0.962 0.555 0.875 Chloroplast 0.127 0.315 0.608 0.698
K, total number of alleles; HO, observed heterozygosity; HS, within population gene diversity; HT, total gene diversity; FIS, inbreeding coefficient; FST′,
standard-ized FST corrected by the variation within populations.
with the central eastern cluster and 2 populations in Sweden group-ing with the southern cluster. No biologically meangroup-ingful patterns were distinguishable at higher values of k.
The results from Tess3 did not indicate a clear optimum for the number of clusters (Supplementary Figure S1b). The cross-entropy calculated by masking 5% of the data shows a downward trend with an increase in the number of clusters, but there is no obvious plateau in the cross-entropy plot that can be taken as an indication for the optimal number of clusters. It is possible that the optimum lies above the maximum value of 7 that we used; however, the long runtime of the program prevented us from running Tess3 at higher values of k. The results at k = 3 resemble those of the AMOVA-based clustering, but shows some admixture among the clusters, mostly in Central Europe (Supplementary Figure S2).
Patterns of Isolation by Distance
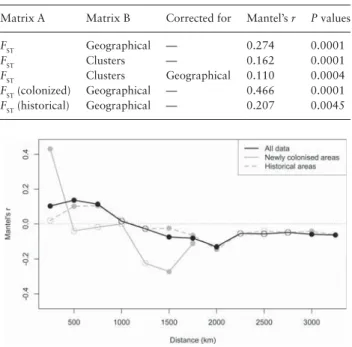
The Mantel test between the matrix of pairwise FST-values and the matrix of pairwise geographic distances (Table 4) between all populations revealed a significant correlation coefficient of 0.27 (P = 0.001). This correlation was not an artefact of the higher-level population structure revealed by the AMOVA-based cluster-ing. When performing the permutations within the 3 clusters, the correlation remained strongly significant (P = 0.001). The Mantel correlogram, which depicts the pattern of spatial autocorrelation in the data, is shown in Figure 2 (black line). Of the 13 distance classes, 8 were significant after progressive Bonferroni correction, both at short and longer distances. It revealed a clear geographic pattern in the distribution of the genetic variation. The positive autocorrelation for the smaller distance classes indicates that popu-lations at close spatial proximity are genetically more similar than on average. In contrast, the negative correlation of the higher dis-tance classes indicates that distant populations are more dissimilar
than on average and suggests that isolation by distance is an impor-tant factor driving population differentiation. The RDA showed that 23.9% of the among-population variation was spatially con-strained (P = 0.001). After multiplication with the overall FST-value of 0.56, this indicates that a substantial part, namely FST = 0.134, of the total genetic variation was spatially constrained. The results strongly resembled those of the K-means and Tess3 analyses. The first axis of the RDA, explaining 44% of the constrained varia-tion (FST = 0.059), mainly showed a distinction between the UK populations and the rest of the populations. The second RDA axis, explaining 17% of the constrained variation (FST = 0.023), showed a North-South gradient.
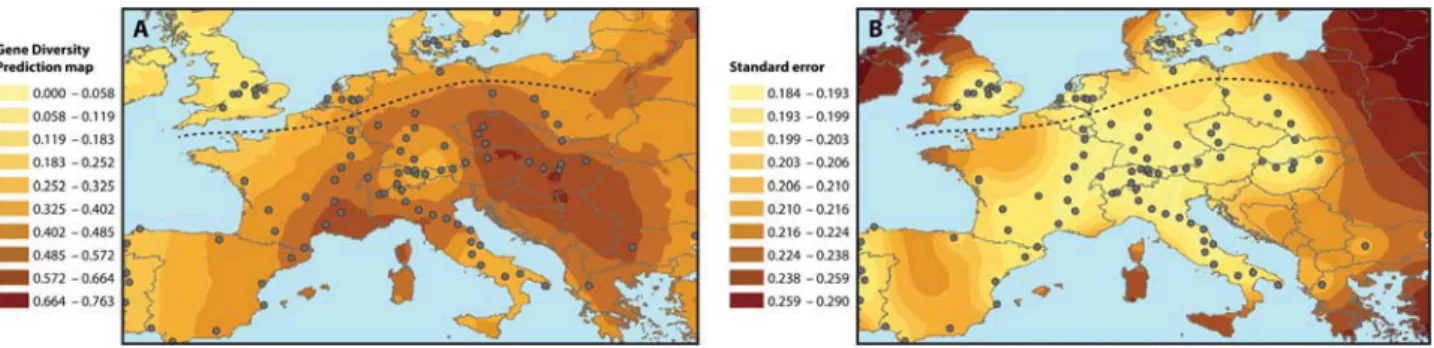
Distribution of Genetic Diversity
The kriging analysis revealed strong geographic patterns in the dis-tribution of the within-population gene diversity values. Central (Eastern) Europe (Hungary, Slovakia, Czech Republic, and Poland), Southern France, and Northern Italy represented areas of high genetic diversity (Figure 3A,B). Gene diversities decreased from these areas with the lowest values found in Portugal, Southern Italy, Great Britain, and the Alps. Discrepancies were present in Scandinavia with some (highly) polymorphic populations and one monomor-phic population. Prediction standard errors depended on the sam-pling density and were quite low except in Central Spain and North Western France.
Differences between New and Historical Ranges Significant differences between new and historical ranges were found in the level of genetic diversity (P = 0.0001), with lower diversity in the newly colonized parts of the range (HS = 0.17) than in the historical parts of the range (HS = 0.40). There was also a significant difference (P = 0.0004) in the level of population structure as meas-ured by FST, with higher differentiation in the newly colonized areas (FST = 0.74) than in the historical range (FST = 0.51). However, since it is known that the value of FST depends on the value of HS, we there-fore also tested for a difference in the value of FST′, which is independ-ent of HS. With FST′ , there was no difference (P = 0.24) between the newly colonized (FST′ = 0.90) and historical areas (FST′ = 0.86).
When investigating the spatial population structure (Table 4), there was a significantly stronger (P = 0.02) pattern of isolation by distance in the newly colonized areas (Mantel’s r = 0.466) than in the historical areas (Mantel’s r = 0.207). This analysis was not biased by the difference in HS between the 2 areas: the difference was similar when calculated from matrices of pairwise FST′ instead of
FST. The Mantel correlograms (Figure 2) show that the difference in spatial structure is most pronounced at short distances. In the newly colonized areas, populations that are close together are genetically strongly similar, while this pattern is lower in the historical areas. Even when the genotypically nearly uniform UK populations are excluded from the analysis, the autocorrelation at short distances remains much higher in the newly colonized areas than in the his-torical areas.
Chloroplast Variation
The distribution of the 2 chloroplast haplotypes is shown in Figure 1B. A total of 31 populations were monomorphic for hap-lotype 1 and 2 populations from Germany were monomorphic for haplotype 2. A total of 19 populations, from all studied countries except for Sweden, Slovakia, Spain, and Greece, were polymorphic with the highest concentration of polymorphic populations located Table 4. Mantel tests and partial Mantel tests, testing for the
relationship between geographical and genetic distances
Matrix A Matrix B Corrected for Mantel’s r P values
FST Geographical — 0.274 0.0001
FST Clusters — 0.162 0.0001
FST Clusters Geographical 0.110 0.0004
FST (colonized) Geographical — 0.466 0.0001
FST (historical) Geographical — 0.207 0.0045
Figure 2. Mantel correlogram with equidistant classes relating the pairwise FST values to the distance between populations. Statistically significant auto-correlations (at a Bonferroni corrected 5% level) are denoted by filled symbols.
in Central Europe. Haplotype 2 was absent from the Mediterranean Basin including the Iberian Peninsula, while it was present in Eastern Europe, close to the Black Sea. Italy possessed both haplotypes only in its northern part.
Population differentiation calculated from the haplotype fre-quencies (FST = 0.61) was quite similar to the value obtained for microsatellites (Table 3). However, no spatial structure was revealed in the distribution of the haplotypes and no relation was found with microsatellite variation. A Mantel test performed on a matrix of pairwise FST-values and a matrix of geographical distances was non-significant (r = −0.04, P = 0.34). In addition, a Mantel correlogram based on the same matrix of pairwise FST-values did not show any significant distance classes (results not shown).
Discussion
Breeding System and Population Dynamics
The low level of observed heterozygosity (HO = 0.014), the high overall inbreeding coefficient (FIS = 0.962) and the high level of self-fertilization estimated using the Bayesian inference method imple-mented in InStruct (s = 0.955) were all consistent with the reported autogamous breeding system of L. serriola. The similarity in FST -values among the nuclear and chloroplastic markers indicated that the nuclear genes were predominantly maternally inherited. This finding is not common for outcrossers, which confirms the high degree of self-fertilization ensured by the floral characteristics of
L. serriola (Jones 1927; Lindqvist 1960a; De Vries 1990) and con-trasts with experimental data showing significant hybridization lev-els with L. sativa (D’Andrea et al. 2008).
Lactuca serriola has a short life cycle and produces a large
num-ber of wind-dispersed seeds (10 000 to 100 000 per individual) that germinated rapidly (Frietema de Vries 1992; Mejias 1993; Mejias 1994; Lebeda et al. 2001). Populations generally show a high turno-ver rate and empty patches are usually colonized by only a small number of founders. Consequently, most genetic variation is distrib-uted between populations (FST′ = 0.875) and little variation occurs within populations (HS = 0.35). The occasional within-population variation for microsatellites and chloroplast markers probably represents efficient seed dispersal that allows the establishment of multiple genotypes. A similar pattern was observed for example for
Mycelis muralis in Western Europe (Chauvet et al. 2004).
Impact of the Recent Range Expansion on Genetic Structure
The distribution of the genetic variation clearly showed the effects of the recent western and northern expansion of L. serriola in Europe that has been inferred previously from herbarium and floristic data
(D’Andrea et al. 2009). In such a range expansion, because of founder effects, a lower diversity is expected for recent populations, when compared to historical populations (Ibrahim et al. 1996). Indeed, the genetic structure of the populations of the historical part differed strongly from that of the newly colonized areas. Genetic diversity was significantly lower in the new area than in the historical part. Kriging of the gene diversity corroborated such a northwards and westwards spread from Central Europe (Figure 3A), since this area showed the highest level of diversity, in accordance with the results of Kuang et al. (2008).
There was also a significant difference in the level of popula-tion structure as measured by FST between the historical and newly colonized parts of the range. As the founder effects that take place during colonization reduce the within-population diversity, a larger part of the total diversity is distributed among populations, lead-ing to higher FST-values. However, the difference in the strength of the population structure was not significant when FST′ was used as a summary statistic. Since FST′ is independent of the level of within-population diversity, this indicates that the increased FST-values can indeed be explained by the reduction in HS.
The founder effects were most apparent in the populations from the United Kingdom, which were dominated by a single genotype, even though they were separated by more than 200 km. The sam-ples from the United Kingdom are grouped in the North Western cluster comprising principally the new area. In fact, the species was collected for the first time in south-eastern England in 1830 and in Sweden in 1828 (D’Andrea et al. 2009). The fact that, among the 2 leaf morphs present within the species, L. serriola f. integrifolia is the dominant form on the British Isles (Carter and Prince 1985; Lebeda et al. 2001; Lebeda et al. 2007) is in line with the hypothesis that colonization occurred by one or only a few founders. Apart from the United Kingdom, the newly colonized areas show the presence of multiple genetic clusters, indicating colonization from multiple source populations. Thus, the range expansion across the northern part of the species range was not due to the emergence and spread of a single well-adapted genotype. So if the range expansion was due to introgression from cultivated lettuce (Hooftman et al. 2006) there must have been multiple independent hybridization events in differ-ent parts of the historical range.
In the historical area, populations have persisted since centuries. Their dynamics have probably contributed to the mixing of popula-tions leading to the lowering of the pattern of isolation at moderate distances. On the contrary, newly colonized areas have been settled quickly with fewer mixing of populations, which would explain the stronger isolation by distance. Nowadays, dispersal of L.
ser-riola is closely related to human activities creating disturbed and
ruderal habitats favorable to this species (Feràkovà 1977; Zohary 1991; Lebeda et al. 2001). Indeed, the occupation of new regions
Figure 3. Visualization of the distribution of gene diversity by kriging: (A) prediction map and (B) standard error.
is thought to have occurred mostly through passive seed dispersal and the establishment of seedlings at suitable sites (Davis and Shaw 2001). Roads and railways provide corridors along which L. serriola can migrate (Parendes and Jones 2000). Populations polymorphic for the maternally inherited chloroplasts (Figure 1B) corroborate that some areas were colonized through multiple introductions, either by several founder events at different times or by the simulta-neous introduction of several seeds.
Historical Biogeography
Genetic structure of European species does not only result from recent events but also from ancient ones, with the Pleistocene gla-ciations playing a decisive role through the extinction of northern populations followed by the recolonization from southern refugia (Hewitt 1999; Hewitt 2000). Our data showed clear genetic clusters that can indeed be explained by both recent and ancient events. One cluster corresponds to most of the newly colonized area, while the other 2 clusters showed a distinct genetic structure within the his-torical area. These latter 2 clusters are likely the result of postglacial recolonization.
Besides looking at population clustering, Pleistocene refugia may also be inferred from regions of high genetic diversity. Therefore, the high genetic diversity revealed by kriging in the Balkans, and in southern France/northern Italy could correspond to refugia dur-ing the glaciations. In that case, the Southwestern (purple) clusters would correspond to recolonization from the refugium in Southern France, and the eastern cluster (red) would correspond to recoloni-zation from the Balkans. However, it cannot be assessed whether the species had colonized the Mediterranean area before the glacia-tions, and the possibility of a North African refugium should not be excluded. Unfortunately, since data on North African populations were lacking, relationships with a possible route involving Italian or Spanish populations could not be assessed. However, when a North African origin would be hypothesized for the Italian populations, the Alps represent a major physical obstacle for plant migration as revealed by the drastic depression of gene diversity observed in this area. The same may apply to Spain with a mountainous bar-rier imposed by the Pyrenees. Interestingly, from the viewpoint of a possible North African colonization, the Iberian Peninsula, and the South Italian populations have low gene diversity and belong to the same cluster.
In contrast with the isolation by distance found for the nuclear microsatellites, no such relationship was observed for the single polymorphic chloroplast markers. However, this lack of spatial structure might indicate a recent and quick expansion of the species from a center of genetic diversity, as found with chloroplast micro-satellites for Arabidopsis thaliana (Provan and Campanella 2003). A significant genetic isolation by distance was detected with AFLPs in A. thaliana that was explained by the colonization of Europe from Asia and Mediterranean Pleistocene refugia (Sharbel et al. 2000). In other aspects, our results contrasted with those obtained for
A. thali-ana, which like L. serriola, is a selfing species occurring in ruderal
habitats (Hoffmann et al. 2003). In Arabidopsis, the highest genetic variability was observed along the Atlantic coast from the western Iberian Peninsula to southern United Kingdom. These findings were explained by either a postglacial colonization of Europe as proposed by Sharbel et al. (2000), which occurred through a different route than for L. serriola (see above), or by an early phase of expansion followed by a long period of gene flow between populations of the glacial refuges during the Quaternary.
Conclusion
Our molecular results corroborate the hypothesis of a recent and rapid colonization of North-Western Europe by L. serriola, as was also shown by a historical biogeographical study (D’Andrea et al. 2009). They support on one hand a historical spread of the spe-cies from the South East (cf. Kuang et al. 2008) as well as more recent short- and long-distance migrations facilitated by human activities. The complex genetic structure of this annual and pio-neer species in Central and Western Europe is thus probably the result of both ancient and recent migration events. Because of the recent and quick colonization of L. serriola, monitoring of the spe-cies in Northern Europe and in altitude in Central and Southern Europe would infer interesting data on its dynamics. Moreover, the extension of genetic studies to whole Mediterranean would evalu-ate possible migration roads of the species between North Africa and Europe.
Supplementary Material
Supplementary material can be found at http://www.jhered.oxford-journals.org/.
Funding
This study was part of the EU-funded project “ANGEL” (EU-QLK-CT-2001-01657) and cofinanced by the National Centre of Competence in Research (NCCR) Plant Survival, research pro-gramme of the Swiss National Science Foundation. Additional microsatellite data were provided by the EU-funded project “GENE-MINE” (QLK5-2000-00722).
Acknowledgments
The authors wish to thank Danny A.P. Hooftman, J. Gerard B. Oostermeijer, Rikke Bagger Jørgensen, Nicola Schoenenberger, Simon Riat, Marc Hulmann, and David Astley for the sampling. The authors also like to thank all other ANGEL members for fruitful discussions as well as 2 anonymous reviewers for their input in the improvement of a former version of the manuscript. The authors are very grateful to Jean-Marie Ndoumvé, Anouk Sarr, and Sarah Mamie for their precious help in the lab at Neuchâtel, to Yolanda Noordijk for assistance in the microsatellite analysis at PRI, and to Dr Mahmoud Bouzelboudjen for his help with kriging. The authors also thank the botanical garden of Neuchâtel for the cultivation of plants and Unifarm for growing plants at Wageningen.
Data Availability
We have deposited the primary data underlying these analyses as follows: data: Dryad (doi:10.5061/dryad.tb2tv).
References
Alexander JM. 2013. Evolution under changing climates: climatic niche stasis despite rapid evolution in a non-native plant. Proc Biol Sci. 280:20131446. Carter RN, Prince SD. 1985. The geographical distribution of prickly lettuce
(Lactuca serriola) I. A general survey of its habitats and performance in Britain. J Ecol. 73:27–38.
Chauvet S, van der Velde M, Imbert E, Guillemin ML, Mayol M, Riba M, Smulders MJ, Vosman B, Ericson L, Bijlsma R, et al. 2004. Past and current gene flow in the selfing, wind-dispersed species Mycelis muralis in western Europe. Mol Ecol. 13:1391–1407.
Chen IC, Hill JK, Ohlemüller R, Roy DB, Thomas CD. 2011. Rapid range shifts of species associated with high levels of climate warming. Science. 19:1024–1026.
Chilès JP, Delfiner P. 1999. Geostatistics: modelling spatial uncertainty. New York: Wiley.
Cressie NAC. 1993. Statistics for spatial data. New York: John Wiley & Sons. D’Andrea L, Broennimann O, Kozlowski G, Guisan A, Morin X, Keller-Senf-ten J, Felber F. 2009. Climate change, anthropogenic disturbance and the northwards range expansion of Lactuca serriola (Asteraceae). J Biogeogr. 36:1–15.
D’Andrea L, Felber F, Guadagnuolo R. 2008. Hybridization rates between let-tuce (Lactuca sativa) and its wild relative (L. serriola) under field condi-tions. Environ Biosafety Res. 7:61–71.
Davis MB, Shaw RG. 2001. Range shifts and adaptive responses to Quater-nary climate change. Science. 292:673–679.
De Vries IM. 1990. Crossing experiments of lettuce cultivars and species (Lac-tuca sect. Lac(Lac-tuca, Compositae). Plant Syst Evol. 171:233–248. Dumolin-Lapegue S, Pemonge MH, Petit RJ. 1997. An enlarged set of
consen-sus primers for the study of organelle DNA in plants. Mol Ecol. 6:393– 397.
Excoffier L, Smouse PE, Quattro JM. 1992. Analysis of molecular variance inferred from metric distances among DNA haplotypes: application to human mitochondrial DNA restriction data. Genetics. 131:479–491. Feràkovà V. 1977. The Genus Lactuca L. in Europe. Bratislava
(Czechoslova-kia): Univerzita. Komenskeho Press.
Frietema de Vries FT. 1992. The systematic relationship of Lactuca sativa and Lactuca serriola, in relation to the distribution of prickly lettuce. Acta Bot Neerl. 43:79.
Gao H, Williamson S, Bustamante CD. 2007. A Markov chain Monte Carlo approach for joint inference of population structure and inbreeding rates from multilocus genotype data. Genetics. 176:1635–1651.
Goudet, J. 1995. Fstat (version 1.2): a computer program to calculate F-statis-tics. J Hered. 86:485–486.
Hedrick PW. 2005. A standardized genetic differentiation measure. Evolution. 59:1633–1638.
Hewitt G. 1999. Post glacial re-colonization of European biota. Biol J Linn Soc. 68:87–112.
Hewitt G. 2000. The genetic legacy of the Quaternary ice ages. Nature. 405:907–913.
Hoffmann MH, Glass AS, Tomiuk J, Schmuths H, Fritsch RM, Bachmann K. 2003. Analysis of molecular data of Arabidopsis thaliana (L.) Heynh. (Brassicaceae) with Geographical Information Systems (GIS). Mol Ecol. 12:1007–1019.
Hooftman DAP, Oostermeijer JGB, den Nijs JCM. 2006. Invasive behaviour of Lactuca serriola (Asteraceae) in the Netherlands: spatial distribution and ecological amplitude. Basic Appl Ecol. 7:507–519.
Ibrahim KM, Nichols RA, Hewitt GM. 1996. Spatial patterns of genetic vari-ation generated by different forms of dispersal during range expansion. Heredity. 77:282–291.
Jombart T, Devillard S, Balloux F. 2010. Discriminant analysis of principal components: a new method for the analysis of genetically structured popu-lations. BMC Genet. 11:94.
Jones HA. 1927. Pollination and life history studies of lettuce (Lactuca sativa L.). Hilgardia. 2:425–479.
Kalinowski ST. 2005. HP-Rare: a computer program for performing rarefac-tion on measures of allelic diversity. Mol Ecol Notes. 5:187–189. Kuang H, van Eck HJ, Sicard D, Michelmore R, Nevo E. 2008. Evolution and
genetic population structure of prickly lettuce (Lactuca serriola) and its RGC2 resistance gene cluster. Genetics. 178:1547–1558.
Lebeda A, Dolezalova I, Ferakova V, Astley D. 2004. Geographical distribution of wild Lactuca species (Asteraceae, Lactuceae). Bot Rev. 70:328–356. Lebeda A, Dolezalova I, Kristkova E, Dehmer KJ, Astley D, van de Wiel C,
van Treuren R. 2007. Acquisition and ecological characterization of Lactuca serriola L. germplasm collected in the Czech Republic, Ger-many, the Netherlands and United Kingdom. Genet Resour Crop Evol. 54:555–562.
Lebeda A, Dolezalova I, Kristkova E, Mieslerova B. 2001. Biodiversity and ecogeography of wild Lactuca ssp. in some European countries. Genet Resour Crops Evol. 48:153–164.
Lebeda A, Kitner M, Dziechciarkova M, Dolezalova I, Kristkova E, Lind-hout P. 2009. An insight into the genetic polymorphism among European populations of Lactuca serriola assessed by AFLP. Biochem Syst Ecol. 37:597–608.
Lindqvist K. 1960. Cytogenetic studies in the serriola group of Lactuca. Hereditas. 46:75–151.
Mantel N. 1967. The detection of disease clustering and a generalized regres-sion approach. Cancer Res. 27:209–220.
Meirmans PG. 2006. Using the AMOVA framework to estimate a standard-ized genetic differentiation measure. Evolution. 60:2399–2402. Meirmans PG. 2012. AMOVA-based clustering of population genetic data. J
Heredity. 103:744–750.
Meirmans PG. 2015. Seven common mistakes in population genetics and how to avoid them. Mol Ecol. 24:3223–3231.
Meirmans PG, Hedrick PW. 2011. Assessing population structure: F(ST) and related measures. Mol Ecol Resour. 11:5–18.
Meirmans PG, Van Tienderen PH. 2004. GenoType and GenoDive: two pro-grams for the analysis of genetic diversity of asexual organisms. Mol Ecol Notes. 4:792–794.
Mejias JA. 1993. Cytotaxonomic studies in the Iberian taxa of the genus Lac-tuca (Compositae). Bot Helv. 103:113–130.
Mejias JA. 1994. Self-fertility and associated flower head traits in the Iberian taxa of Lactuca and related genera (Asteraceae, Lactuceae). Plant Syst Evol. 191:147–160.
Parendes LA, Jones JA. 2000. Role of light availability and dispersal in exotic plant invasion along roads and streams in the H. J. Andrews Experimental Forest, Oregon. Conserv Biol. 14:64–75.
Pauli H, Gottfried M, Dullinger S, Abdaladze O, Akhalkatsi M, Benito Alonso JL, Coldea G, Dick J, Erschbamer B, Fernandez, Calzado R, et al. 2012. Recent plant diversity changes on Europe’s mountain summits. Science. 20:336–353.
Peakall R, Smouse PE. 2006. GenAlEx 6: genetic analysis in Excel. Popula-tion genetic software for teaching and research. Mol Ecol Notes. 6:288– 295.
Peakall R, Smouse PE. 2012. GenAlEx 6.5: genetic analysis in Excel. Popula-tion genetic software for teaching and research-an update. Bioinformatics. 28:2537–2539.
Provan J, Campanella JJ. 2003. Patterns of cytoplasmic variation in Arabidop-sis thaliana (Brassicaceae) revealed by polymorphic chloroplast microsat-ellites. Syst Bot. 28:578–583.
R Core Team. 2014. R: a language and environment for statistical computing. Vienna (Austria): R Foundation for Statistical Computing. http://www.R-project.org/.
Schwarz G. 1978. Estimating the dimension of a model. Ann Stat. 6:461– 464.
Sharbel TF, Haubold B, Mitchell-Olds T. 2000. Genetic isolation by distance in Arabidopsis thaliana: biogeography and postglacial colonization of Europe. Mol Ecol. 9:2109–2118.
Smouse PE, Long JC, Sokal RR. 1986. Multiple regression and correlation extension of the Mantel test of matrix correspondence. Syst Zool. 35:627– 632.
Sokal RR. 1986. Spatial data analysis and historical processes. In: Diday, et al., editors. Data analysis and informatics IV. Holland: Science Publishers. p. 29–43.
Stebbins GL. 1953. A new classification of the tribe Cichorieae, family Com-positae. Madrono. 12:33–64.
Uwimana B, D’Andrea L, Felber F, Hooftman DAP, den Nijs CM, Smulders MJM, van de Wiel CCM. 2012. Bayesian analysis of gene flow from crops to their wild relatives: cultivated (Lactuca sativa) and prickly lettuce (L. serriola), and the recent expansion of L. serriola in Europe. Mol Ecol. 21:2640–2654.
Van de Wiel C, Arens P, Vosman B. 1999. Microsatellite retrieval in lettuce (Lactuca sativa L.). Genome. 42:139–149.
Van de Wiel CCM, Sretenović Rajičić T, Van Treuren R, Dehmer KJ, Van der Lin-den CG, Van Hintum TJL. 2010. Distribution of genetic diversity in wild Euro-pean populations of prickly lettuce (Lactuca serriola): implications for plant genetic resources management. Plant Genet Resour Charact Util. 8:171–181. Vuilleum B. 1973. Genera of Lactuceae (Compositae) in southeastern United
States. J Arnold Arboretum. 54:42–93.
Weaver SE, Downs MP. 2003. The biology of Canadian weeds. 122. Lactuca serriola L. Can J Plant Sci. 83:619–628.
Werk KS, Ehleringer J. 1986. Effect of nonrandom leaf orientation on repro-duction in Lactuca serriola L. Evolution. 40:1334–1337.
Zohary D. 1991. The wild genetic resources of cultivated lettuce. Euphytica. 53:31–35.