Efficiency of monolaurin in mitigating ruminal methanogenesis and modifying
C-isotope fractionation when incubating diets composed of either C
3or C
4plants in a rumen simulation technique (Rusitec) system
Fenja Klevenhusen
1, Stefano M. Bernasconi
2, Thomas B. Hofstetter
3, Jakov Bolotin
3, Carmen Kunz
1and Carla R. Soliva
1*
1ETH Zurich, Department of Agricultural and Food Science, 8092 Zurich, Switzerland 2ETH Zurich, Geological Institute, 8092 Zurich, Switzerland
3ETH Zurich, Institute of Biogeochemistry and Pollutant Dynamics, 8092 Zurich, Switzerland (Received 17 November 2008 – Revised 23 April 2009 – Accepted 27 April 2009 – First published online 9 June 2009)
Mitigation of methanogenesis in ruminants has been an important goal for several decades. Free lauric acid, known to suppress ruminal metha-nogenesis, has a low palatability; therefore, in the present study the aim was to evaluate the mitigation efficacy of its esterified form (monolaurin). Further,13C-isotope abundance (d13C) and13C –12C fractionation during methanogenesis and fermentation were determined to evaluate possible microbial C-isotope preferences. Using the rumen simulation technique, four basal diets, characterised either by the C3plants grass (hay) and wheat (straw and grain), or the C4plant (13C excess compared with C3plants) maize (straw and grain), and a mixture of the latter two, were incubated with and without monolaurin (50 g/kg dietary DM). Added to hay, monolaurin did not significantly affect methanogenesis. When added to the other diets (P, 0·05 for the wheat-based diet) methane formation was lowered. Monolaurin decreased fibre disappearance (least effect with the hay diet), acetate:propionate ratio, and protozoal counts. Feed residues and SCFA showed the same d13C as the diets. Methane was depleted in13C while CO2was enriched in13C compared with the diets. Monolaurin addition resulted in13C depletion of CO2and enrichment in CH4(the latter only in the hay diet). In conclusion, monolaurin proved to effectively decrease methanogenesis in the straw – grain diets although this effect might partly be explained by the concomitantly reduced fibre disappearance. The influence on13C-isotope abundance and fractionation supports the hypothesis that ruminal microbes seem to differentiate to some extent between C-isotopes during methanogenesis and fermentation. Methane: Fatty acids: Carbon isotopes: Rusitec
Enteric methane (CH4) emissions from livestock, and thereby
mainly ruminants, are estimated to be the second largest source of global agricultural non-CO2 greenhouse gases(1).
In 2000, global enteric CH4 emissions were estimated to
amount to 85·6 Gg equivalent to 1·8 Mt CO2 equivalents and
are projected to increase by 32 % until 2020 relative to 1990(1). The search for ideal CH4-mitigating strategies
revealed that diet supplementation seems to be especially promising(2). There is an increasing body of literature indicat-ing that supplementindicat-ing diets with lipids that are not protected from ruminal digestion can diminish enteric CH4emissions(2).
Saturated medium-chain fatty acids (MCFA), including caprylic acid, capric acid(3), lauric acid(4,5) and myristic acid(6,7), as well as combinations of the latter two(8), are among the most promising lipids for that purpose. Also coco-nut oil, a lipid especially rich in lauric and myristic acid, has proved to be very effective in mitigating CH4formation in the
gut of the ruminant (for example, Machmu¨ller et al.(9), Jordan et al.(10) and Yabuuchi et al.(11)). So far, only a few studies have investigated the efficiency of potentially CH4-abating
supplementation strategies in different diet types(12,13). Added to a concentrate-based diet, myristic acid showed a larger effect in suppressing CH4 formation in sheep than
when supplemented to a forage-based diet(6). Machmu¨ller(12) concluded that, in the case of diets rich in structural carbo-hydrates, non-esterified rather than esterified MCFA should be fed, as the efficiency of esterified fatty acids strongly depends on the rate of ruminal lipolysis. Besides their anti-methanogenic effects, lipids are also helpful in increasing the energy density of the diet, which may improve animal per-formance in some situations(10). However, feeding higher amounts of lipids to ruminants may have adverse side-effects. These include the possibility of a depressed DM intake(2)and, sometimes, a reduced ruminal fibre degradation(8,14). Further-more, the most efficient anti-methanogenic MCFA, lauric acid, is known to be of low palatability, particularly due to its soapy taste, which may result in substantial feed refu-sals(15). This should be different with esterified lauric acid. At least, according to a large series of reports, refusals were never nearly as high when feeding coconut oil, consisting of
* Corresponding author: Dr Carla R. Soliva, fax þ 41 44 632 11 28, email [email protected]
Abbreviations: d13C,13C-isotope abundance; IRMS, isotope ratio mass spectrometer; MCFA, medium-chain fatty acids; Rusitec, rumen simulation technique.
qThe Authors 2009
British
Journal
of
about half of lauric acid in esterified form(14), than those reported for pure lauric acid(15). Finally, the immediacy of the potentially adverse effects in the rumen should be reduced with monolaurin, since monolaurin, an ester of lauric acid, is known to be less corrosive and, therefore, might be less irritat-ing for the ruminal environment than free lauric acid.
So far, analyses of stable C-isotopes in ruminant science have mostly been used to trace the feeding regimen in terms of dietary proportions of C3 and C4 plants(16,17) that cattle
have been subjected to by concluding from isotope ratios ana-lysed in body tissue (meat), milk, urine or faeces. Few studies have analysed the stable C-isotopes of CH4 released from
ruminants (for example, Rust(18), Schulze et al.(19), Bilek et al.(20) and Levin et al.(21)) and from ruminal fluid in vitro(22). Diets tested were either mixtures of C3 and C4
plants in varying proportions or pure C3 and pure C4 plant
diets. However, none of these studies investigated all versions analysed in the present study; neither did they determine the
13C isotope abundance (d13C) and isotope fractionation in
single SCFA. According to the authors’ best knowledge, monolaurin was tested in the present study for the first time for its effectiveness in ruminal CH4 mitigation. Generally
monolaurin is well known for its antimicrobial efficiency against gram-positive bacteria(23), but it has been shown that also specific gram-negative bacterial species can be affected(24).
In the present study the hypothesis tested was that an effec-tive lipid source acts differently on methanogenesis when the carbohydrate types available for fermentation differ, which might be expressed in a different C-isotope fractionation. An in vitro approach using the rumen simulation technique (Rusitec) was chosen for the present study as this system allows the following of all processes taking place in the rumen quantitatively, which would be much more difficult to control in an in vivo approach including all extra-ruminal processes. In order to determine whether differences in CH4
formation and C-isotope fractionation exist, four basal diets characterised by either C3 plants (two diets; grass hay,
wheat), C4plants (one diet; maize) or C3and C4 plants (one
diet; maize and wheat mixture) were compared, either at a similar (C3 straw plus grain diet v. C4 straw plus grain diet)
or at a differing carbohydrate profile (C3 grass hay diet v.
C4straw plus grain diet, i.e. easily degradable fibre v. starch).
Materials and methods
In vitro system and experimental diets
The in vitro experiment was conducted using an eight-fermen-ter Rusitec system as described in detail by Soliva & Hess(25). With this in vitro system four different basal diets were tested at 15 g DM/d both with and without monolaurin (chemically: C15H30O4, glycerol monolaurate) supplemented at 50 g/kg (on
a DM basis) in a completely randomised design in six repli-cates per treatment. In the present study, Lauricidinw(purity
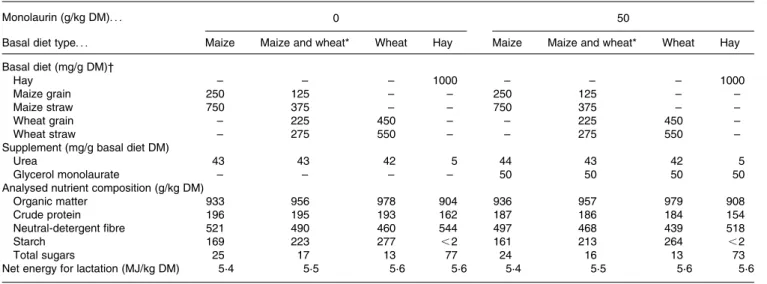
. 95 %; Med-Chem Laboratories, Galena, IL, USA) was used where, according to the producer’s statement, lauric acid is esterified at the external position with glycerol and is shaped into mini-pellets without fill material. The basal diets consisted either of meadow-grass hay rich in ryegrass (second cut, beginning of shooting; forage-only), maize or wheat (always straw and grain mixed in the proportions being equivalent in estimated net energy content to that of the hay) (Table 1). A fourth basal diet consisted of a 1:1 mix-ture of the maize and the wheat diet. All diets were balanced in their calculated net energy for lactation content according to the Swiss Federal Research Station for Animal Production (RAP)(26). To increase the limiting dietary contents of rumin-ally degradable protein in the straw – concentrate-based diets, urea, being low in C content to minimise the addition of non-C3or non-C4 plant carbon, was used as an N source.
Experimental procedures and sampling
In six experimental runs, each time including all dietary treat-ments and lasting for 10 d, the daily portions of experimental feeds were put into nylon bags (70 £ 140 mm) with a pore size of 100 mm(27). Before that, hay and straw were ground to pass
Table 1. Composition of the experimental diets
Monolaurin (g/kg DM). . . 0 50
Basal diet type. . . Maize Maize and wheat* Wheat Hay Maize Maize and wheat* Wheat Hay
Basal diet (mg/g DM)† Hay – – – 1000 – – – 1000 Maize grain 250 125 – – 250 125 – – Maize straw 750 375 – – 750 375 – – Wheat grain – 225 450 – – 225 450 – Wheat straw – 275 550 – – 275 550 –
Supplement (mg/g basal diet DM)
Urea 43 43 42 5 44 43 42 5
Glycerol monolaurate – – – – 50 50 50 50
Analysed nutrient composition (g/kg DM)
Organic matter 933 956 978 904 936 957 979 908
Crude protein 196 195 193 162 187 186 184 154
Neutral-detergent fibre 521 490 460 544 497 468 439 518
Starch 169 223 277 ,2 161 213 264 ,2
Total sugars 25 17 13 77 24 16 13 73
Net energy for lactation (MJ/kg DM) 5·4 5·5 5·6 5·6 5·4 5·5 5·6 5·6
* 1:1 Mixture of the maize and wheat diets. † Supplemented at an amount of 15 g DM/d.
Methanogenesis and C-isotope fractionation 1309
British
Journal
of
Nutrition
https:/www.cambridge.org/core/terms. https://doi.org/10.1017/S0007114509990262
a 5 mm sieve whereas the grains were ground to a size of 3 mm. Ruminal fluid was obtained from a lactating rumen-fis-tulated Brown Swiss cow which was fed hay ad libitum and concentrate (1 kg/d administered in two portions). The cow was kept according to the Swiss guidelines for animal welfare. Before inoculation, ruminal fluid was strained through four layers of medicinal gauze with a pore size of about 1 mm. At the beginning of each experimental run the fermenters were filled with 100 ml pre-warmed buffer(25) and 900 ml strained ruminal fluid. Thereafter, two nylon bags were admi-nistered whereby the first one was filled with solid ruminal content (about 40 g fresh matter) and the second one with the respective experimental diet. On the second experimental day the bag containing the solid ruminal content was exchanged with another bag containing the experimental diet. Each feed bag was incubated for 48 h. To maintain anaerobic conditions the system was flushed with gaseous N2 for 3 min after exchanging the feed bags. The incubation
temperature was kept constant at 39·58C. Buffer flow to the fermenters was continuous and averaged 397 (SD 69) ml/d, resulting in a dilution rate of about 40 % per d. The resulting incubation fluid outflow was collected in bottles chilled at 2 208C.
Incubation fluid samples, collected directly from the fermenters via a three-way valve using a syringe equipped with a plastic tube 3 h before exchanging the feed bags, were analysed daily for redox potential and pH using the respective electrodes connected to a pH meter (model 634; Methrom AG, Herisau, Switzerland). Part of the incubation fluid samples taken were centrifuged for 5 min at 4000 rpm (Varifugew K; Heraeus, Osterode, Germany) and the
super-natant fraction was stored at 2 208C before being analysed for SCFA concentrations and the d13C values of the SCFA. The first were determined by using high pressure liquid chro-matography (System Hitachi Lachrom; Merck, Tokyo, Japan) according to the method of Ehrlich et al.(28). For the determi-nation of d13C, 4M-sodium chloride was added to the samples
and pH was adjusted to 2·5 using 5M-HCl. The SCFA were then extracted with solid-phase micro extraction adapted with a specific fibre (Carbowax/Divinylbenzene, Yellow-Green no. 57 337-U; Supelco Inc., Bellefonte, PA, USA). The isotope composition of the individual SCFA was analysed via online coupling to a GC-combustion isotope ratio mass spectrometer (IRMS) (Thermo Delta plus XL with Combus-tion Interface III and Thermo Trace GC; Thermo Electron Corp., Waltham, MA, USA). Measurements followed modified procedures as described by Dias & Freeman(29) as well as Berg et al.(30). The temperature programme of the GC was as follows: 608C for 1 min, heating-up to 1108C at a rate of 208C/min, heating-up to 1358C at a rate of 0·58C/min, heating-up to 2208C at a rate of 608C/min, 3 min at 2208C. Oxidation and reduction reactors in the combustion interface were maintained at 9408C and 6408C, respectively. The NiO, CuCO and Pt wires in the combustion unit were oxidised with O2for 12 h at 9408C before being used. The solid-phase
micro extraction/GC-IRMS method had an accuracy of ^ 0·5 ‰ of d13C.
After 48 h of incubation, dietary residues were washed with cold water in a washing machine and frozen at 2 208C until nutrient analyses were performed. Later the lyophilised and ground residues were analysed for DM and organic matter,
via total ash (automatically by TGA-500; Leco Corporation, St Joseph, MI, USA), N (C/N analyser, Leco-Analysator Typ FP-2000; Leco Instrumente GmBH, Kircheim, Germany; crude protein ¼ 6·25 £ N) and neutral-detergent fibre. Analyses of neutral-detergent fibre were carried out with the Fibretec System M (Tecator, 1020 Hot Extraction, Ho¨gana¨s, Sweden) with the addition of a-amylase but without sodium sulfite as suggested by Van Soest et al.(31). Starch content was determined polarimetrically(32) (model 343; Perkin Elmer, Boston, MA, USA). Samples were extracted with hot ethanol (80 %) for the determination of total sugar content. After being filtered the samples were analysed with a colori-metric method using an orcin/sulfuric acid reagent in an auto-analyser (Cartridge Gesamtzucker (total sugar cartridge), Autoanalyzer II; Bran-Luebbe GmbH, Norderstedt, Germany). The fermentation gases produced during 24 h were collected in gas-tight aluminium bags (TECOBAG 8 litres, PETP/AL/ PE – 12/12/75 quality; Tesserau Container GmbH, Bu¨rstadt, Germany). Gas was analysed daily for concentrations of CH4, CO2and H2with a GC (model 5890 Series II; Hewlett
Packard, Avondale, PA, USA) equipped with a flame ionis-ation detector (to determine CH4), a thermal conductivity
detector (to determine CO2 and H2) and a 2·34 m £ 2·3 mm
column, 80/100 mesh (Porapak Q; Fluka Chemie AG, Buchs, Switzerland). The total amount of gas produced was quantified by water displacement(25). This was accomplished by pressing the fermentation gas out of the gas-tight aluminium bags using plates of 2 kg weight. Fermentation gas was flushed into an Erlenmeyer flask and the water displaced from this flask then was collected in a second, graduated, flask.
Subsamples of the fermentation gases were analysed with a trace gas analyser (ANCA-TG II; SerCon Ltd, Crewe, Cheshire, UK) for the d13C of CO2and CH4. CO2was
separ-ated cryogenically from CH4, N2 and O2, and subsequently
measured in continuous-flow with a Sercon Ltd GEO 20/20 mass spectrometer. Methane was separated cryogenically from the other gases and combusted at 10008C in a furnace containing CuO, Ni and Pt wires. Calibration and linearity corrections were accomplished by measuring variable amounts of an internal standard gas (1 % H2, 1 % O2, 7·99 % CH4,
40·18 % CO2, rest is N2; PanGas, Dagmersellen, Switzerland).
The d13C of the feeds and the fermentation residues was determined using an elemental analyser (model NCS 2500; Carlo-Erba, Rodano, Italy) coupled in continuous flow with an IRMS (Optima, Micromass, Crewe, Cheshire, UK). Sample material was combusted in the presence of O2 in an
oxidation column at 10308C. Combustion gases then passed a reduction column (6508C), and the N2 and CO2 produced
were separated chromatographically and transferred into the IRMS via an open split for on-line isotope measurements. This method had an accuracy of ^ 0·5 ‰ of d13C for CH4,
and of ^ 0·2 ‰ for CO2.
Calculations and statistical evaluation
The abundance of13C relative to12C was determined in com-parison with a generally accepted reference standard (d13C) (‰) ¼ ((Rsample2 Rreference)/Rreference) £ 1000, where Rsample
is the isotope ratio (13C:12C) of the sample, and Rreference
rep-resents the isotope ratio of the conventional d-notation for
British
Journal
of
carbon with respect to the Vienna Pee Dee Belemnite (VPDB) standard. The factor a, describing the fractionation between the respective two fermentation gases, was calculated as aCO2/CH4¼ (d13CO2þ 1000)/(d13CH4þ 1000)(33). Because a
is usually close to 1·0 the fractionation will be expressed as the enrichment factor 1(CO2 – CH4) ¼ (a 2 1) £ 1000. The equations
used for calculating the C-isotope fractionation between diet and individual SCFA were 1(diet – SCFA) ¼ (a 2 1) £ 1000,
with adiet/SCFA¼ (d13diet þ 1000)/(d13SCFA þ 1000). In order
to avoid influences of the fermenters, diets were arranged completely randomised. For all data, the mean values of the last 5 d of each experimental run were subjected to ANOVA using the general linear model (GLM) procedure of SAS (version 9.1; SAS Institute Inc., Cary, NC, USA) with diet and lipid supple-mentation as fixed effects while experimental run was assumed to be random. Multiple comparisons among means were performed with Tukey’s method and differences were declared significant at P,0·05.
Results
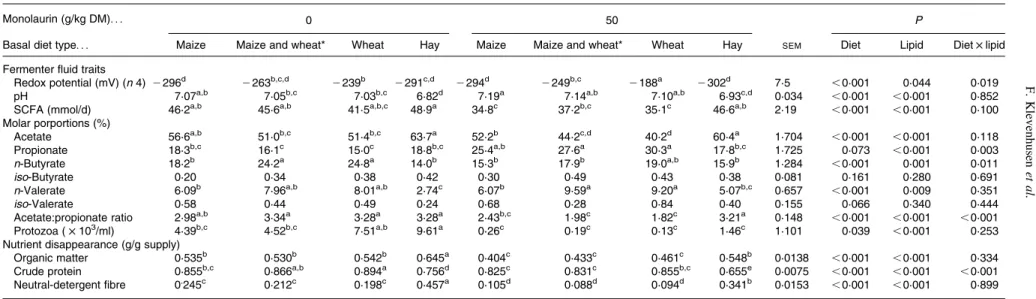
Independently of the presence of monolaurin, there was a clear basal diet effect (P, 0·001) on incubation fluid pH, with the lowest pH found with the hay diet (P, 0·001), while mono-laurin supplementation resulted in an increase of pH in all treatments (P, 0·001). Monolaurin addition led to a decrease of total SCFA concentration (P, 0·001), and the molar pro-portion of propionate was increased (P, 0·001) at the cost of butyrate and acetate. In molar proportions of propionate and n-butyrate, an interaction (P¼ 0·003 and P¼ 0·011 respect-ively) between diet type and monolaurin supplementation was present due to the lack of response to monolaurin with the hay diet. The acetate:propionate ratio was affected (P, 0·001) by basal diet type and monolaurin supplementation. There was also an interaction (P, 0·001) between the two factors, as monolaurin had a larger depressive effect in the wheat and the maize – wheat mixed basal diet compared with the other diets. The addition of monolaurin reduced (P, 0·001) ciliate protozoal counts (Table 2).
Monolaurin supplementation decreased (P, 0·001) nutrient disappearances. The difference in crude protein disappearance between the hay diet and the other diets was higher in the presence of monolaurin (interaction, P, 0·001). Concerning the daily amount of CH4 produced during fermentation, the
effect of the basal diet type was significant (P¼ 0·001), although this was apparent only for the lipid-supplemented diets when considered separately (Table 3). The addition of monolaurin resulted in a decline in CH4 formation
(monolaurin effect: P, 0·001), except for the hay diet. The most pronounced decrease in daily CH4 formation due
to monolaurin was found in the wheat diet (2 63 %) and, less substantially, in the mixed and the maize diet (2 38 and 2 37 %, respectively). In multiple comparisons among means, the monolaurin supplementation to the wheat diet significantly decreased CH4 related to total SCFA formation.
Monolaurin addition decreased CO2 (P¼ 0·048), except for
the hay diet, but did not affect the daily amount of H2.
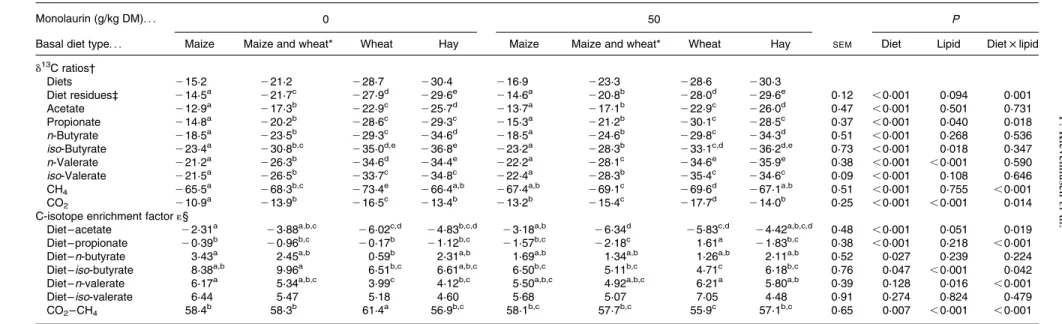
Diets differed in their carbon isotope values, with the maize diets being most enriched in 13C, showing d13C of about 2 15 ‰ in the unsupplemented and 2 17 ‰ in the mono-laurin-supplemented treatments (Table 4). The hay diet, both
supplemented and unsupplemented with monolaurin, was the one most depleted in13C with a d13C of 2 30 ‰. After 48 h of incubation the feed residues still showed a similar d13C profile as the original diets. There was no effect of monolaurin supplementation.
The d13C ratios of the individual SCFA primarily reflected diet differences (P, 0·001) in d13C; however, some changes were also observed. The d13C of acetate was more positive than that of the respective diets, meaning richer in the13C iso-tope, with the largest enrichment of about 6 ‰ occurring with the wheat diet, followed by the mixed and the hay diet. Mono-laurin supplementation had a significant effect on the d13C values of several SCFA. Accordingly, the wheat diet resulted in about 1·6 ‰ more13C-depleted propionate with monolaurin than the corresponding diet, which had not been the case with-out monolaurin (interaction, P¼ 0·018). With respect to the C-isotope fractionation from diet to SCFA, there was a clear basal diet effect (P, 0·001) on the enrichment factors 1(diet – acetate), 1(diet – propionate) and 1(diet – n-butyrate; P¼ 0·027). A monolaurin effect (P, 0·001) on the enrichment was observed with 1(diet – iso-butyrate), where 1 decreased by about 2 ‰ with the maize and the wheat diet, and by about 5 ‰ with the mixed diet. However, no influence of monolaurin was found with the hay diet, resulting in a monolaurin £ diet interaction (P¼ 0·042). Monolaurin also influenced (P¼ 0·016) the enrichment factor 1(diet – n-valerate), with increases in the wheat (þ 2·2 ‰) and the hay diet (þ 1·7 ‰) and a slight decrease in the maize-containing diets. Interactions (P, 0·001) between diet type and monolaurin supplementation were found in 1(diet – propionate) and 1(diet – n-valerate), as well as 1(diet – acetate; P¼ 0·019).
Compared with the diets, CH4(2 65 to 2 73 ‰) was
mark-edly depleted in13C while, on the other hand, CO2(2 11 to
2 17 ‰) was enriched in13C. For both gases, CH4 and CO2,
a clear (P, 0·001) basal diet effect was obvious. Additionally, a diet type £ monolaurin interaction (P, 0·001) in d13CH4
occurred, with an increase of 3·8 ‰ found when supplement-ing monolaurin to the wheat diet, while there was a decrease in all other diets. Monolaurin addition resulted in a
13C-depleted CO
2 (P, 0·001). The diet type £ monolaurin
interaction found in d13CO2(P¼ 0·014) was less clear in that
respect. The enrichment factor 1(CO2– CH4) was very high
(56 to 61 ‰) and was affected by diet type (P, 0·007) and monolaurin supplementation (P, 0·001; mostly decreased by monolaurin). There was an interaction (P, 0·001) based on that 1(CO2– CH4) was highest with the wheat diet compared
with the other treatments only without, but not with, monolaurin.
Discussion
Lipids are among the most promising nutritional strategies for abating enteric methane formation. Their effectiveness depends on several factors including level of supplementation, fatty acid chain length, and the diet type fed to the ruminant. If lipid supplementation does not exceed 50 g/kg dietary DM, effects on feed intake and digestibility are likely to be low(34). Comparing in vivo conditions with a water:food ratio in the rumen of about 4·5(35)and in vitro conditions with water:food ratios of at least ten times higher might have different effects, as the dosage of supplements normally is related to feed and
Methanogenesis and C-isotope fractionation 1311
British
Journal
of
Nutrition
https:/www.cambridge.org/core/terms. https://doi.org/10.1017/S0007114509990262
Table 2. Effects of diet type and fatty acid addition on fermenter fluid traits and degree of ruminal nutrient disappearance (averages of days 6 – 10) (n 6) (Mean values with pooled standard errors)
Monolaurin (g/kg DM). . . 0 50 P
Basal diet type. . . Maize Maize and wheat* Wheat Hay Maize Maize and wheat* Wheat Hay SEM Diet Lipid Diet £ lipid Fermenter fluid traits
Redox potential (mV) (n 4) 2 296d 2263b,c,d 2239b 2291c,d 2294d 2249b,c 2188a 2302d 7·5 ,0·001 0·044 0·019 pH 7·07a,b 7·05b,c 7·03b,c 6·82d 7·19a 7·14a,b 7·10a,b 6·93c,d 0·034 ,0·001 ,0·001 0·852
SCFA (mmol/d) 46·2a,b 45·6a,b 41·5a,b,c 48·9a 34·8c 37·2b,c 35·1c 46·6a,b 2·19 ,0·001 ,0·001 0·100
Molar porportions (%)
Acetate 56·6a,b 51·0b,c 51·4b,c 63·7a 52·2b 44·2c,d 40·2d 60·4a 1·704 ,0·001 ,0·001 0·118
Propionate 18·3b,c 16·1c 15·0c 18·8b,c 25·4a,b 27·6a 30·3a 17·8b,c 1·725 0·073 ,0·001 0·003 n-Butyrate 18·2b 24·2a 24·8a 14·0b 15·3b 17·9b 19·0a,b 15·9b 1·284 ,0·001 0·001 0·011
iso-Butyrate 0·20 0·34 0·38 0·42 0·30 0·49 0·43 0·38 0·081 0·161 0·280 0·691
n-Valerate 6·09b 7·96a,b 8·01a,b 2·74c 6·07b 9·59a 9·20a 5·07b,c 0·657 ,0·001 0·009 0·351
iso-Valerate 0·58 0·44 0·49 0·24 0·68 0·28 0·84 0·40 0·155 0·066 0·340 0·444
Acetate:propionate ratio 2·98a,b 3·34a 3·28a 3·28a 2·43b,c 1·98c 1·82c 3·21a 0·148 ,0·001 ,0·001 ,0·001
Protozoa ( £ 103/ml) 4·39b,c 4·52b,c 7·51a,b 9·61a 0·26c 0·19c 0·13c 1·46c 1·101 0·039
,0·001 0·253 Nutrient disappearance (g/g supply)
Organic matter 0·535b 0·530b 0·542b 0·645a 0·404c 0·433c 0·461c 0·548b 0·0138 ,0·001 ,0·001 0·334
Crude protein 0·855b,c 0·866a,b 0·894a 0·756d 0·825c 0·831c 0·855b,c 0·655e 0·0075 ,0·001 ,0·001 ,0·001 Neutral-detergent fibre 0.245c 0·212c 0·198c 0·457a 0·105d 0·088d 0·094d 0·341b 0·0153 ,0·001 ,0·001 0·899 a – eMean values within a row with unlike superscript letters were significantly different (P, 0·05).
* 1:1 Mixture of the maize and wheat diets.
F.
Klevenhusen
et
al.
1312
British Journal of Nutrition
.
https://doi.org/10.1017/S0007114509990262
https:/www.cambridge.org/core
. University of Basel Library
, on
30 May 2017 at 22:18:37
not to ruminal fluid or incubation liquid, respectively. There-fore, in the present in vitro experiment supplementation of lipids was chosen to amount to 50 g related to feed DM. In detail, four basal diets isoenergetic in terms of net energy for lactation but differing in their carbohydrate profile were supplemented with monolaurin, an esterified form of lauric acid. This, and using diets containing either C3 or C4 plants
or a mixture of both, was intended to facilitate the expression of differentiation in the effects on methanogenesis and C-isotope fractionation during ruminal fermentation.
Effects on ruminal methanogenesis, nutrient disappearance and formation of short-chain fatty acids
Some of the differences in the effects on fermentation and methanogenesis found among the four basal diets were as expected. These include an increase in the molar proportion of acetate with the hay diet, as it contained more and better degradable fibre. It was somewhat unexpected that this mainly happened in association with lower butyrate and, only less so, propionate proportions. Among the straw – grain-based diets, differences in SCFA were mostly small. Unexpectedly, in the absence of monolaurin, all four diets did not differ very clearly regarding CH4formation.
Hindrich-sen et al.(36)demonstrated that the differences in the methano-genic potential of forage-only diets and diets with a forage:concentrate ratio of 1:1 were smaller than expected from shifts taking place at very high concentrate proportions. Still, the lack of any difference between the hay diet and the wheat diet in the present study was astonishing and may have resulted from the long incubation time of 48 h for all feeds, including concentrate, and the high pH level due to buf-fering. By contrast, the difference to the maize diet and the maize – wheat diet (with hay being by some 20 % higher) was in the range expected. Starch fermentation favours propio-nate formation which is inversely related to CH4( 37). As in the
absence of monolaurin the propionate proportion of total SCFA was lower in the wheat than in the hay diet; the lack of a CH4 effect seems reasonable despite the concomitant
decrease in fibre fermentation.
Monolaurin proved to be effective in suppressing ruminal methanogenesis in some of the basal diets. The mitigation of CH4 formation found with the wheat diet exceeded 50 %, a
level similar to that found previously with Rusitec using about the same dietary proportion of non-esterified lauric acid in a mixed forage – concentrate diet(38). Kabara(23) described monolaurin to have an even higher antimicrobial potential than non-esterified lauric acid when being tested in direct contact with different microbes. However, in the rumen it is more likely that a rapid lipolysis occurs, making monolaurin approximately equally efficient as non-esterified lauric acid. The present experiment was not primarily designed to identify the factors responsible for the anti-metha-nogenic activity of monolaurin. This leaves open the extent to which a direct suppression of methanogens(4,5), an indirect suppression via anti-protozoal effects (a considerable pro-portion of methanogens is associated with protozoa(39); the assessment of effects on protozoa in Rusitec is, however, very limited) and a concomitant decline in nutrient disappear-ance would explain this effect. The latter had also been found in previous studies with the addition of MCFA(8,12)and in the
Table 3 . Effects of diet type and fatty acid addition o n the formation o f fermentation g ases (averages of days 6 – 1 0) (n 6) (Mean v alues w ith pooled standard errors) Monolaurin (g/kg DM) ... 05 0 P Basal diet type ... Maize Maize and w heat* Wheat Hay Maize Maize and wheat* Wheat Hay SE M Diet Lipid Diet £ lipid Gaseous emissions (mmol/d) CH 4 5·15 a,b 5· 5 1 a,b 6 ·37 a 6 ·13 a 3 ·52 b,c 3· 3 0 b,c 2·99 c 6 ·99 a 0 ·476 0 ·001 , 0·001 0·011 CH 4 (mmol/mol SCFA) 114 a,b 128 a,b 155 a 128 a,b 114 a,b 92·7 b 83·9 b 147 a 9 ·82 0 ·145 , 0·001 0·002 CO 2 45·3 a,b 42 ·8 a,b 46·8 a 45 ·6 a,b 32 ·7 b 33·7 a,b 33·7 a,b 48·1 a 5 ·10 0 ·030 0·048 0·142 H2 0·066 b 0 ·178 a,b 0 ·173 a,b 0 ·148 a,b 0 ·107 a,b 0· 1 3 8 a,b 0·426 a 0 ·070 a,b 0 ·0644 0 ·027 0·433 0·150 a,b,c Mean values within a row with unlike superscript letters were significantly different (P , 0·05). * 1 :1 Mixture o f the maize and wheat diets.
Methanogenesis and C-isotope fractionation 1313
British
Journal
of
Nutrition
https:/www.cambridge.org/core/terms. https://doi.org/10.1017/S0007114509990262
Table 4.13C-isotope abundance (d13C) values of the diets, residues, SCFA and fermentation gases, and treatment effects on the enrichment factors 1(CO
2– CH4) and 1(diet – SCFA) (averages of
days 6 – 10) (n 6)
(Mean values with pooled standard errors)
Monolaurin (g/kg DM). . . 0 50 P
Basal diet type. . . Maize Maize and wheat* Wheat Hay Maize Maize and wheat* Wheat Hay SEM Diet Lipid Diet £ lipid d13C ratios† Diets 215·2 221·2 228·7 230·4 216·9 223·3 228·6 230·3 Diet residues‡ 214·5a 221·7c 227·9d 229·6e 214·6a 220·8b 228·0d 229·6e 0·12 ,0·001 0·094 0·001 Acetate 212·9a 217·3b 222·9c 225·7d 213·7a 217·1b 222·9c 226·0d 0·47 ,0·001 0·501 0·731 Propionate 214·8a 220·2b 228·6c 229·3c 215·3a 221·2b 230·1c 228·5c 0·37 ,0·001 0·040 0·018 n-Butyrate 218·5a 223·5b 229·3c 234·6d 218·5a 224·6b 229·8c 234·3d 0·51 ,0·001 0·268 0·536
iso-Butyrate 223·4a 230·8b,c 235·0d,e 236·8e 223·2a 228·3b 233·1c,d 236·2d,e 0·73 ,0·001 0·018 0·347 n-Valerate 221·2a 226·3b 234·6d 234·4e 222·2a 228·1c 234·6e 235·9e 0·38 ,0·001 ,0·001 0·590 iso-Valerate 221·5a 226·5b 233·7c 234·8c 222·4a 228·3b 235·4c 234·6c 0·09 ,0·001 0·108 0·646
CH4 265·5a 268·3b,c 273·4e 266·4a,b 267·4a,b 269·1c 269·6d 267·1a,b 0·51 ,0·001 0·755 ,0·001
CO2 210·9a 213·9b 216·5c 213·4b 213·2b 215·4c 217·7d 214·0b 0·25 ,0·001 ,0·001 0·014
C-isotope enrichment factor 1§
Diet – acetate 22·31a 23·88a,b,c
26·02c,d
24·83b,c,d 23·18a,b 26·34d
25·83c,d
24·42a,b,c,d 0·48 ,0·001 0·051 0·019
Diet – propionate 20·39b 20·96b,c 20·17b 21·12b,c 21·57b,c 22·18c 1·61a 21·83b,c 0·38 ,0·001 0·218 ,0·001 Diet – n-butyrate 3·43a 2·45a,b 0·59b 2·31a,b 1·69a,b 1·34a,b 1·26a,b 2·11a,b 0·52 0·027 0·239 0·224
Diet – iso-butyrate 8·38a,b 9·96a 6·51b,c 6·61a,b,c 6·50b,c 5·11b,c 4·71c 6·18b,c 0·76 0·047 ,0·001 0·042 Diet – n-valerate 6·17a 5·34a,b,c 3·99c 4·12b,c 5·50a,b,c 4·92a,b,c 6·21a 5·80a,b 0·39 0·128 0·016 ,0·001
Diet – iso-valerate 6·44 5·47 5·18 4·60 5·68 5·07 7·05 4·48 0·91 0·274 0·824 0·479
CO2– CH4 58·4b 58·3b 61·4a 56·9b,c 58·1b,c 57·7b,c 55·9c 57·1b,c 0·65 0·007 ,0·001 ,0·001 a – eMean values within a row with unlike superscript letters were significantly different (P, 0·05).
* 1:1 Mixture of the maize and wheat diets. † d13C calculated as d (‰) ¼ ((R
sample2Rreference)/Rreference) £ 1000, with Rsamplebeing the isotope ratio of the sample (13C:12C) and Rreferencerepresenting the isotope ratio of the standard for carbon (Vienna Pee Dee Belemnite; VPDB).
‡ Statistical analyses of the d13C ratios of the residues were done for the first four experimental runs (n 4).
§ 1(CO2 – CH4), 1 (‰) ¼ (a 2 1) £ 1000, with aCO2/CH4¼ (d13CO2þ 1000)/(d13CH4þ 1000)(38). 1(diet – SCFA), 1 (‰) ¼ (a 2 1) £ 1000, with adiet/SCFA¼ (d13diet þ 1000)/(d13SCFA þ 1000)(38).
F.
Klevenhusen
et
al.
1314
British Journal of Nutrition
.
https://doi.org/10.1017/S0007114509990262
https:/www.cambridge.org/core
. University of Basel Library
, on
30 May 2017 at 22:18:37
present study where monolaurin addition resulted in a reduction in nutrient disappearance. Relating CH4 to the
amount of SCFA produced, a measure for nutrient fermenta-tion, did not reveal a monolaurin-induced effect, except for the wheat diet. The shifts towards propionate at the cost of acetate and butyrate, caused by monolaurin, are consistent with the findings on neutral-detergent fibre disappearance. Out of seven cultured rumen bacterial species, those contribut-ing to propionate production were found to be less susceptible to MCFA than the others(40). The present study again confirmed the different levels of efficiency in suppressing methanogenesis in different diet types. Accordingly, as was also shown earlier in vitro(13) and in vivo(6), the effects of MCFA are much more pronounced in concentrate-based diets than in forage-based or forage-only diets. In the present case, monolaurin even proved to be completely ineffective in the forage-only diet type. Potential reasons for this diet-dependent efficiency of MCFA include binding of the fatty acids to fibre particles(6).
Effects on ruminal carbon isotope fractionation
The differences in d13C between the diets consisting either of C3or C4plants were about 13·5 ‰. A difference of about the
same magnitude as seen between C3 and C4 plants might be
expected in the CH4produced by cows fed those diets(21). In
the present study, the C-isotope signature was obvious in feed residues and SCFA, but only to a small degree in the fer-mentation gases. The d13C values of CH4resulting from
incu-bating maize (a C4plant) did not differ from those originating
from the grass hay (a C3plant). Further CH4from the maize
diet was only 8·5 ‰ heavier than the CH4 produced from
the wheat diet (another C3plant). The reason for these findings
lies in the experimental design. In the present Rusitec study we used the McDougall buffer solution, which included a con-siderable amount of chemically pure NaHCO3with a d13C of
2 4·8 ‰ in order to maintain a favourable pH of about 7. According to the carbonate equilibria, the bicarbonate of the buffer exchanges C-isotopes with the CO2produced by the
fer-mentation and thus influences the isotope composition of the CO2 used by the methanogens for CH4formation. Therefore,
the differences in d13C regarding the CO2of the different
treat-ments were reduced compared with the differences between the diets themselves. However, this has no influence on the C-iso-tope fractionation and the relative enrichment between CO22 CH4as the reduction of CO2is energetically the most
favourable pathway to generate CH4( 41). The large 13C –12C
fractionation between CO2and CH4has also been observed in
other studies(19,22). The effect of monolaurin on d13CO2 may
be related to the amount of CO2 that is converted to CH4.
Regarding the CO2:CH4 ratio, it seems that relatively more
CO2is converted into CH4in the unsupplemented treatments.
Therefore the remaining CO2 becomes more enriched in the
heavy isotope because12C is preferentially converted to CH4.
The buffer has no influence on the isotope fractionation of diet residues and SCFA, and the different fractionation from diet to SCFA. Concerning influences on the d13C ratios of individual SCFA, only very little information is available in the literature. Metges et al.(22) analysed the SCFA as a whole in the incubation medium of an in vitro experiment. They found ratios in SCFA similar to those of the respective C3 diets. In the present experiment, the smallest enrichment
between diet and SCFA was found for propionate, although fractionation differed even among treatments in this SCFA. In almost all treatments acetate was enriched in 13C relative to the diet. This is probably due to the fact that part of the acetate is further transformed to other metabolites, for example, butyrate and amino acids(42), and accordingly the remaining acetate could be enriched in13C. Comparable situ-ations might explain the high enrichment factors found for the other SCFA. For instance, iso-butyrate and iso-valerate are derived from the degradation of branched-chain amino acids, and they are used by various bacteria species for the resynth-esis of branched-chain amino acids and the de novo synthresynth-esis of branched long-chain fatty acids(43). The protein fraction in general is somewhat richer in12C than the carbohydrate frac-tion(44). This would explain the fractionation towards 12C observed in the iso-branched-chain SCFA compared with the diet, which consists largely of carbohydrates.
Important effects on C-isotope fractionation included those of monolaurin addition. This supplementation not only strongly influenced ruminal fermentation but also had signifi-cant effects on the d13C of several SCFA and fermentation gases. The most surprising treatment effect with respect to C-isotope fractionation was the interaction of basal diet and monolaurin found in the fermentation gases. The enrichment 1(CO2– CH4) was highest with the wheat diet when being
unsupplemented and was decreased by 5 ‰ with monolaurin addition. The relatively higher fractionation found with the unsupplemented wheat diet might have resulted from the different carbohydrate composition compared with the other diets. With 277 g/kg DM, the wheat diet contained about 40 % more starch than the maize diet. Methanogens need an anaerobic environment with a redox potential being lower than 2 200 mV(45). Maybe the redox potential of 2 188 mV found with the monolaurin-supplemented wheat diet was a major reason for the low amount of CH4 produced in this
treatment. Similar effects have been reported before, with an associated increase of the lactate proportion in ruminal fluid(46), which would contribute to an environment not suit-able for many of the fibre-degrading ruminal microbes. Usually lactate is rapidly metabolised to propionate by proto-zoa to prevent acidosis(47), but monolaurin also seemed to act against the protozoa. In turn, the reduction in protozoal counts could explain the high redox potential, as protozoa signifi-cantly contribute to a low redox potential(48).
In the present study the largest enrichment of13C isotopes (2 ‰) in propionate relative to the diet was found in the mono-laurin-supplemented mixed diet. With the hay diets the enrich-ment factor 1(diet – propionate) was found to range between 2 1·12 and 2 1·83 ‰, whereas a depletion in13C of propionate
occurred only in the wheat plus monolaurin treatment (1(diet – propionate)¼ þ 1·61 ‰). There are two mechanisms for
propionate formation known to exist in the rumen(49): the randomising (succinate-including) pathway and the non-randomising (acrylate) pathway. The present results suggest that different pathways were used in the different treatments and that C-isotopes were differently discriminated in these two pathways. There is evidence that the contribution of the non-randomising type to propionate formation in hay-only diets is negligible(13). For those treatments having enrichment factors 1(diet – propionate) in the same range, the same mode of propionate formation might be expected.
Methanogenesis and C-isotope fractionation 1315
British
Journal
of
Nutrition
https:/www.cambridge.org/core/terms. https://doi.org/10.1017/S0007114509990262
Conclusion
The present results provide evidence that monolaurin is an effective methane-mitigating supplement in vitro, but only when being added to mixed forage – concentrate diets and not to a forage-only diet. One important mediator of the methane-suppressing effect of monolaurin seems to be an adverse effect on ruminal nutrient disappearance. In order to be successfully applied as a methane-abatement strategy in ruminant nutrition, this needs to be largely compensated for by hindgut digestion. The results obtained with the C-isotope fractionation illustrate that during fermentation ruminal microbes perform fractionation to a certain extent. Determining C-isotope fractionation therefore might evolve into a valuable tool to investigate whether changes in ruminal metabolic path-ways during fermentation are occurring. Further investigations are required to demonstrate the usefulness of this approach in vivo and to relate the changes to target microbial species.
Acknowledgements
The present study was supported by the Vontobel Foundation, Zurich, Switzerland, and the TUMSS (Towards an improved understanding of methane sources and sinks) project of the ETH Zurich, Switzerland. We are grateful to M. Kreuzer for his support in carrying out the present study.
The contributions of the authors were as follows: F. K., carrying out the in vitro experiment, writing the manuscript, statistical analyses; S. M. B., trace gas analyser technique (instruction, advisor) to measure C-isotope composition of fermentation gases, statistical evaluation of the isotope compo-sition of the gases, reviewing and complementing the manu-script; T. B. H., GC-combustion-IRMS (instruction, advisor) to measure C-isotope composition of SCFA, statistical evalu-ation of the isotope composition of the SCFA, reviewing and complementing the manuscript; J. B., advising and modifying GC-combustion-IRMS technique to analyse C-isotope compo-sition in SCFA of ruminal fluid, writing and reviewing the Materials and methods part of this technique; C. K., optimising and establishing the solid-phase micro extraction technique to catch the SCFA in the incubation fluid for further analyses of the C-isotopes, responsible for all the analyses carried out, contribution in the Materials and methods part; C. R. S., project leader, responsible for the experimental design and the administrative part, extensively reviewing the manuscript.
The authors state that there is no conflict of interest.
References
1. US Environmental Protection Agency (2006) Global Anthropo-genic Non-CO2Greenhouse Gas Emissions: 1990 – 2020, EPA 430-R-06-003. Washington, DC: US-EPA.
2. Beauchemin KA, Kreuzer M, O’Mara F, et al. (2008) Nutri-tional management for enteric methane abatement: a review. Aust J Exp Agric 48, 21 – 27.
3. Ajisaka N, Mohammed N, Hara K, et al. (2002) Effects of medium-chain fatty acid-cyclodextrin complexes on ruminal methane production in vitro. Anim Sci J 73, 479 – 484. 4. Soliva CR, Hindrichsen IK, Meile L, et al. (2003) Effects of
mixtures of lauric and myristic acid on rumen methanogens and methanogenesis in vitro. Lett Appl Microbiol 37, 35 – 39.
5. Dohme F, Machmu¨ller A, Wasserfallen A, et al. (2001) Ruminal methanogenesis as influenced by individual fatty acids sup-plemented to complete ruminant diets. Lett Appl Microbiol 34, 47 – 51.
6. Machmu¨ller A, Soliva CR & Kreuzer M (2003) Methane-suppressing effect of myristic acid in sheep as affected by dietary calcium and forage proportion. Br J Nutr 90, 529 – 540. 7. Odongo NE, Or-Rashid MM, Kebreab E, et al. (2007) Effect of supplementing myristic acid in dairy cow rations on ruminal methanogenesis and fatty acid profile in milk. J Dairy Sci 90, 1851 – 1858.
8. Soliva CR, Meile L, Cieslak A, et al. (2004) Rumen simulation technique study on the interactions of dietary lauric and myristic acid supplementation in suppressing ruminal methanogenesis. Br J Nutr 92, 689 – 700.
9. Machmu¨ller A, Soliva CR & Kreuzer M (2003) Effect of coco-nut oil and defaunation treatment on methanogenesis in sheep. Reprod Nutr Developm 43, 41 – 55.
10. Jordan E, Lovett DK, Monahan FJ, et al. (2006) Effect of refined coconut oil or copra meal on methane output and on intake and performance of beef heifers. J Anim Sci 84, 162 – 170.
11. Yabuuchi Y, Matsushita Y, Otsuka H, et al. (2006) Effects of supplemental lauric acid-rich oils in high-grain diet on in vitro rumen fermentation. Anim Sci J 77, 300 – 307.
12. Machmu¨ller A (2006) Medium-chain fatty acids and their poten-tial to reduce methanogenesis in domestic ruminants. Agric Eco-syst Environm 112, 107 – 114.
13. Machmu¨ller A, Dohme F, Soliva CR, et al. (2001) Diet compo-sition affects the level of ruminal methane suppression by medium-chain fatty acids. Aust J Agric Res 52, 713 – 722. 14. Dohme F, Machmu¨ller A, Wasserfallen A, et al. (2000)
Com-parative efficiency of various fats rich in medium-chain fatty acids to suppress ruminal methanogenesis as measured with RUSITEC. Can J Anim Sci 80, 473 – 482.
15. Dohme F, Machmu¨ller A, Sutter F, et al. (2004) Digestive and metabolic utilization of lauric, myristic and stearic acid in cows, and associated effects on milk fat quality. Arch Anim Nutr 58, 99 – 116.
16. Jones RJ, Ludlow MM, Troughton JH, et al. (1979) Estimation of the proportion of C3and C4plant species in the diet of ani-mals from the ratio of natural12C and13C isotopes in the faeces. J Agric Sci 92, 91 – 100.
17. Knobbe N, Vogl J, Pritzkow W, et al. (2006) C and N stable iso-tope variation in urine and milk of cattle depending on the diet. Anal Bioanal Chem 386, 104 – 108.
18. Rust F (1981) Ruminant methane d (13C/12C) values: relation to atmospheric methane. Science 211, 1044 – 1046.
19. Schulze E, Lohmeyer S & Giese W (1998) Determination of 13C/12C-ratios in rumen produced methane and CO
2 of cows, sheep and camels. Isotopes Environ Health Stud 34, 75 – 79. 20. Bilek RS, Tyler SC, Kurihara M, et al. (2001) Investigation of
cattle methane production over a 24-hour period using measure-ments of d13C and dD of emitted CH4and rumen water. J Geo-phys Res 103, 37 – 51.
21. Levin I, Bergamaschi P, Do¨rr H, et al. (1993) Stable isotopic signature of methane from major sources in Germany. Chemo-sphere 26, 161 – 177.
22. Metges C, Kempe K & Schmidt HL (1990) Dependence of the carbon-isotope contents of breath carbon dioxide, milk, serum and rumen fermentation products on the d13C value of food in dairy cows. Br J Nutr 63, 187 – 196.
23. Kabara JJ (1984) Antimicrobial agents derived from fatty acids. J Am Oil Chem Soc 61, 397 – 403.
24. Preuss HG, Echard B, Enig M, et al. (2005) Minimum inhibitory concentrations of herbal essential oils and monolaurin for gram-positive and gram-negative bacteria. Mol Cell Biochem 272, 29 – 34.
British
Journal
of
25. Soliva CR & Hess HD (2007) Measuring methane emission of ruminants by in vitro and in vivo techniques. In Measuring Methane Production from Ruminants, pp. 15 – 135 [HPS Makkar and PE Vercoe, editors]. Dordrecht, The Netherlands: Springer.
26. Swiss Federal Research Station for Animal Production (RAP) (1999) Fu¨tterungsempfehlungen und Na¨hrwerttabellen fu¨r Wie-derka¨uer (Recommendations and Nutritional Feeding Tables for Ruminants), 4th revised ed. Zollokofen, Switzerland: LmZ. 27. Carro MD, Lebzien P & Rohr K (1995) Effects of pore size
of nylon bags and dilution rate on fermentation parameters in a semi-continuous artificial rumen. Small Rum Res 15, 113 – 119.
28. Ehrlich GG, Goerlitz DF, Bourell JH, et al. (1981) Liquid-chromatographic procedure for fermentation product analysis in the identification of anaerobic bacteria. Appl Environm Microbiol 42, 878 – 885.
29. Dias RF & Freeman KH (1997) Carbon isotope analyses of semivolatile organic compounds in aqueous media using solid-phase microextraction and isotope ratio monitoring GC/MS. Anal Chem 69, 944 – 950.
30. Berg M, Bolotin J & Hofstetter TB (2007) Compound-specific nitrogen and carbon isotope analysis of nitroaromatic com-pounds in aqueous samples using solid-phase microextraction coupled to GC/IRMS. Anal Chem 79, 2386 – 2393.
31. Van Soest PJ, Robertson JB & Lewis BA (1991) Methods for dietary fiber, neutral detergent fiber, and nonstarch polysacchar-ides in relation to animal nutrition. J Dairy Sci 74, 3583 – 3597. 32. Association of Official Analytical Chemists (1997) Official
Methods of Analysis. Arlington, VA: AOAC.
33. Whiticar MJ, Faber E & Schoell M (1986) Biogenic methane formation in marine and fresh-water environments – CO2 reduction vs acetate fermentation isotope evidence. Geochim Cosmochim Acta 50, 693 – 709.
34. Doreaux M & Chilliard Y (1997) Digestion and metabolism of dietary fat in farm animals. Br J Nutr 78, 15 – 35.
35. Czerkawski JW (1986) An Introduction to Rumen Studies. Oxford/New York: Pergamon International Library.
36. Hindrichsen IK, Wettstein H-R, Machmu¨ller A, et al. (2006) Methane emission, nutrient degradation and nitrogen turnover in dairy cows and their slurry at different milk production scen-arios with and without concentrate supplementation. Agric Eco-syst Environm 113, 150 – 161.
37. Demeyer D & Fievez V (2000) Ruminants and environment: methanogenesis. Ann Zootech 49, 95 – 112.
38. Machmu¨ller A, Soliva CR & Kreuzer M (2002) In vitro ruminal methane suppression by lauric acid as influenced by dietary cal-cium. Can J Anim Sci 82, 233 – 239.
39. Dohme F, Machmu¨ller A, Estermann BL, et al. (1999) The role of the rumen ciliate protozoa for methane suppression caused by coconut oil. Lett Appl Microbiol 29, 187 – 192.
40. Henderson C (1973) Effects of fatty acids on pure cultures of rumen bacteria. J Agric Sci 81, 107 – 112.
41. Baldwin RL & Allison MJ (1983) Rumen metabolism. J Anim Sci 57, 461 – 477.
42. Hungate RE (1966) The Rumen and its Microbes. New York: Academic Press.
43. Allison MJ (1969) Biosynthesis of amino acids by ruminal microorganisms. J Anim Sci 29, 797 – 807.
44. Gaffney J, Irsa A, Friedman L, et al. (1979) C13-C12 analysis of vegetable-oils, starches, proteins, and soy-meat mixtures. J Agric Food Chem 27, 475 – 478.
45. Whiticar MJ (1999) Carbon and isotope systematics of bacterial formation and oxidation of methane. Chem Geol 161, 291 – 314. 46. Marounek M, Brezina P, Simunek J, et al. (1991) Influence of redox potential on metabolism of glucose in mixed cultures of rumen microorganisms. Arch Anim Nutr 41, 63 – 69.
47. Jouany JP & Ushida K (1999) The role of protozoa in feed diges-tion – review. Asian-Australasian J Anim Sci 12, 113 – 128. 48. Mathieu F, Jouany JP, Senaud J, et al. (1996) The effect of
Saccharomyces cerevisiae and Aspergillus oryzae on fermenta-tions in the rumen of faunated and defaunated sheep; protozoal and probiotic interactions. Reprod Nutr Developm 36, 271 – 287. 49. Baldwin RL, Wood WA & Emery RS (1963) Conversion of glucose-C14 to propionate by rumen microbiota. J Bacteriol 85, 1346 – 1349.
Methanogenesis and C-isotope fractionation 1317
British
Journal
of
Nutrition
https:/www.cambridge.org/core/terms. https://doi.org/10.1017/S0007114509990262