Contrasting the direct radiative effect
and direct radiative forcing of aerosols
The MIT Faculty has made this article openly available.
Please share
how this access benefits you. Your story matters.
Citation
Heald, C. L., D. A. Ridley, J. H. Kroll, S. R. H. Barrett, K. E.
Cady-Pereira, M. J. Alvarado, and C. D. Holmes. “Contrasting the
Direct Radiative Effect and Direct Radiative Forcing of Aerosols.”
Atmospheric Chemistry and Physics 14, no. 11 (2014): 5513–5527.
As Published
http://dx.doi.org/10.5194/acp-14-5513-2014
Publisher
Copernicus GmbH on behalf of the European Geosciences Union
Version
Final published version
Citable link
http://hdl.handle.net/1721.1/89415
Terms of Use
Creative Commons Attribution
www.atmos-chem-phys.net/14/5513/2014/ doi:10.5194/acp-14-5513-2014
© Author(s) 2014. CC Attribution 3.0 License.
Contrasting the direct radiative effect and direct
radiative forcing of aerosols
C. L. Heald1,2, D. A. Ridley1, J. H. Kroll1, S. R. H. Barrett3, K. E. Cady-Pereira4, M. J. Alvarado4, and C. D. Holmes5
1Department of Civil and Environmental Engineering, Massachusetts Institute of Technology, Cambridge, MA, USA 2Department of Earth, Atmospheric and Planetary Sciences, Massachusetts Institute of Technology, Cambridge, MA, USA 3Department of Aeronautics and Astronautics, Massachusetts Institute of Technology, Cambridge, MA, USA
4Atmospheric and Environmental Research (AER), Lexington, MA, USA 5Department of Earth System Science, University of California, Irvine, CA, USA
Correspondence to: C. L. Heald (heald@mit.edu)
Received: 14 November 2013 – Published in Atmos. Chem. Phys. Discuss.: 16 December 2013 Revised: 18 March 2014 – Accepted: 22 April 2014 – Published: 4 June 2014
Abstract. The direct radiative effect (DRE) of aerosols,
which is the instantaneous radiative impact of all atmo-spheric particles on the Earth’s energy balance, is sometimes confused with the direct radiative forcing (DRF), which is the change in DRE from pre-industrial to present-day (not in-cluding climate feedbacks). In this study we couple a global chemical transport model (GEOS-Chem) with a radiative transfer model (RRTMG) to contrast these concepts. We esti-mate a global mean all-sky aerosol DRF of −0.36 Wm−2and a DRE of −1.83 Wm−2for 2010. Therefore, natural sources of aerosol (here including fire) affect the global energy bal-ance over four times more than do present-day anthropogenic aerosols. If global anthropogenic emissions of aerosols and their precursors continue to decline as projected in recent scenarios due to effective pollution emission controls, the DRF will shrink (−0.22 Wm−2 for 2100). Secondary met-rics, like DRE, that quantify temporal changes in both natu-ral and anthropogenic aerosol burdens are therefore needed to quantify the total effect of aerosols on climate.
1 Introduction
Atmospheric aerosols are the most uncertain driver of global climate change (IPCC, 2013). These particles can scatter or absorb radiation, thereby cooling or warming the Earth and its atmosphere directly. They also play a pivotal role in cloud formation, acting as nuclei for liquid or ice water clouds, and can thus indirectly cool the planet by increasing its albedo.
The overall impact of present-day atmospheric aerosols is es-timated to be cooling, globally counterbalancing a significant fraction of the warming associated with greenhouse gases (IPCC, 2013). There is thus a critical need to better quan-tify the role of aerosols in the climate system. The ability of aerosols to modify climate depends on their atmospheric abundance over time as well as their chemical, physical, and optical properties; uncertainties on all of which are large (Myhre et al., 2013; Kinne et al., 2006).
The direct radiative effect (DRE) is Earth’s instantaneous radiative flux imbalance between incoming net solar radia-tion and outgoing infrared radiaradia-tion resulting from the pres-ence of a constituent of the Earth’s atmosphere (Boucher and Tanre, 2000). This is distinct from direct radiative forc-ing (DRF), a leadforc-ing climate-relevant metric for aerosol (and other constituents), commonly used to quantify aerosol im-pacts (e.g., Shindell et al., 2009) and in international as-sessment (e.g., IPCC, 2013). Generally, DRF quantifies the change in DRE over time which will induce a change in global temperatures. In the context of the IPCC climate assessments, this time horizon has been specified as pre-industrial (1750) to present-day (IPCC, 1990, 1995, 2001, 2007, 2013). In this IPCC framework, the radiative forcing has also been restricted to “denote an externally imposed per-turbation” (IPCC, 2001), and so excludes feedbacks resulting from a changing climate itself. Both of these more specific definitions of radiative forcing have been widely adopted by the atmospheric science and climate communities. The most recent IPCC report (IPCC, 2013) also describes an alternate
effective radiative forcing (ERF), which allows physical vari-ables (e.g the temperature profile) “to respond to perturba-tions with rapid adjustments”; this does not generally include feedbacks or responses to climate change, but in the case of aerosols, now includes the “semi-direct effect”. The DRF in-cludes both anthropogenic forcing driven by the rise in hu-man emissions and land use change as well natural forcing associated with changes in solar flux and volcanic emissions. This was not clear in a previous definition of aerosol forcing in Sect. 2.4 of the 2007 IPCC report: “the direct RF only con-siders the anthropogenic components.” There are very few natural aerosol forcers, with volcanoes, which are sporadic in nature and therefore difficult to compare with other forcers, as the primary example. However, anthropogenic land use change and anthropogenically driven changes in the chemical environment can both affect natural aerosols, thus constitut-ing a forcconstitut-ing ignored by this second, incomplete definition.
Climate feedbacks can also drive changes in natural aerosols; for example, rising carbonaceous aerosol emis-sions associated with enhanced fire activity (Spracklen et al., 2009; Westerling et al., 2006), the impacts of CO2 fertilization on aerosol precursor emissions (Heald et al., 2009), increases in biogenic aerosol formation associated with temperature-driven increases in biogenic volatile or-ganic compound (VOC) emissions (Tsigaridis and Kanaki-dou, 2007; Heald et al., 2008), or trends in dust emissions associated with changes in vegetation or wind speed (Ma-howald et al., 2006; Ridley et al., 2014). Carslaw et al. (2010) suggest that changes in natural aerosols, largely driven by climate feedbacks, may result in radiative perturbations of up to ±1 Wm−2. Previous studies have attempted to differ-entiate the role of climate feedbacks on biogeochemical cy-cles and atmospheric chemistry (Raes et al., 2010; Carslaw et al., 2010); however, these investigations require characteriza-tion of the climate response via a coupled chemistry–climate model.
The DRF metric is relatively simple to estimate in atmo-spheric models (in that it does not require quantification of the climate response) and enables quantitative comparison of various anthropogenic forcing mechanisms on the Earth’s en-ergy budget. The aerosol DRF reflects both the change in pri-mary aerosol emissions from anthropogenic activity and the impacts of the changing chemical environment (due to an-thropogenic emissions) on secondary aerosol formation. The radiative impacts of natural aerosol are typically reflected in DRE, not DRF. Observations (from satellite or surface sun photometers) characterize a total DRE of present-day aerosols; to estimate DRF the anthropogenic fraction is as-sumed (Yu et al., 2006; Bellouin et al., 2005). Indeed, as a result of this, observational studies such as Bellouin et al. (2013) have provided a clear contrast between DRE and DRF. Nevertheless, this distinction between DRE and DRF is sometimes confused in the literature (Jo et al., 2013; Heald et al., 2005; Liao et al., 2004; Kim et al., 2006; Artaxo et al., 2009; Massoli et al., 2009; Ma et al., 2012; Athanasopoulou
et al., 2013; Goto et al., 2008), where the presence of any aerosol is assumed to imply a DRF. The radiative imbal-ance associated with the presence of these aerosols is only a DRF if pre-industrial concentrations were zero. However, the distinction between DRE and DRF remains somewhat murky, particularly when considering secondary aerosol for-mation. For example, changes in the chemical formation of biogenic secondary organic aerosol (SOA) due to changes in anthropogenic nitrogen oxide (NOx)emissions qualifies as a DRF, but similar changes induced by changes in light-ning NOxsources (due to a climate feedback) do not. In this study our objective is to globally quantify and contrast these two metrics.
2 Model description
Reducing the uncertainty associated with aerosol radiative forcing requires models that are well tested against obser-vations and that include the capacity to simulate radiative impacts. The temporal matching of observations and sim-ulation, which is only possible using a chemical transport model (CTM) driven by assimilated meteorology (or a GCM nudged towards analyzed meteorology), is critical to the accurate evaluation of a simulation of short-lived species. Therefore, a CTM with an online coupled radiative trans-fer model is the most appropriate model configuration for consistently evaluating aerosol loading and direct radiative impacts.
Here we integrate the rapid radiative transfer model for GCMs (RRTMG) online within the global GEOS-Chem chemical transport model (www.geos-chem.org), a config-uration referred to as GC–RT, to calculate the radiative fluxes associated with atmospheric aerosols. RRTMG uses the correlated-k method to calculate long-wave (LW) and shortwave (SW) atmospheric fluxes. Further details on the aerosol simulation, emissions, optical properties, RRTMG, and the implementation in GEOS-Chem are provided in what follows.
2.1 GEOS-Chem
We use v9-01-03 of GEOS-Chem driven by GEOS-5 assim-ilated meteorology from the Global Model and Assimila-tion Office for the year 2010 at a horizontal resoluAssimila-tion of 2◦×2.5−1and 47 vertical levels.
The GEOS-Chem oxidant-aerosol simulation includes H2SO4–HNO3–NH3 aerosol thermodynamics coupled to an ozone–NOx–hydrocarbon–aerosol chemical mechanism (Park et al., 2004, 2006). We use the standard bulk aerosol scheme, where all aerosols are described with one or more log-normal size bins. The ISORROPIA II thermodynamic equilibrium model (Fountoukis and Nenes, 2007) calculates the partitioning of total ammonia and nitric acid between the gas and particle (fine mode only) phases. The model scheme
also includes organic aerosol (OA) and black carbon (BC) (Park et al., 2003), sea salt aerosol (2 size bins) (Alexander et al., 2005; Jaegle et al., 2010), and soil dust (4 size bins) (Fairlie et al., 2007; Ridley et al., 2012). The organic matter to organic carbon ratio for primary organic aerosol (POA) is assumed to be 2. SOA is produced from the oxidation of bio-genic hydrocarbons following the Chung and Seinfeld (2002) two-product model scheme, with the addition of isoprene SOA (Henze and Seinfeld, 2006) and aromatic SOA (Henze et al., 2008). Of these three categories of SOA, only yields for SOA formed from aromatic precursors include a depen-dence on (NOx)concentrations. Note that the anthropogenic SOA (and the DRF associated with it) in GC–RT is only that formed from aromatic species. The soil dust simulation uses the source function of Ginoux et al. (2004) and an en-trainment scheme following the DEAD model (Zender et al., 2003). Wet deposition of soluble aerosols and gases includes contributions from scavenging in convective updrafts, rain-out, and washout (Liu et al., 2001). Aerosol dry deposition follows the size-dependent scheme of Zhang et al. (2001).
Global anthropogenic emissions for 2010 are based on the year 2000 EDGAR v3.2 inventory (Olivier et al., 2001) for SOx, NOxand CO, and the RETRO inventory (Schultz, 2007) for VOCs. BC and primary OC emissions are taken from Bond et al. (2007). Both natural and anthropogenic (largely agricultural) ammonia emissions follow the global inventory of Bouwman et al. (1997) with seasonal variation specified by Park et al. (2004). Global anthropogenic emis-sions are overwritten by regional inventories as described by van Donkelaar et al. (2008). We scale all regional and global anthropogenic emissions from their respective base year to 2006, the last year of available statistics (van Donkelaar et al., 2008). We use global biomass burning emissions from the monthly GFED3 inventories (van der Werf et al., 2010). Emissions associated with biofuel use and agricultural waste, are globally fixed (Yevich and Logan, 2003) with seasonality but no interannual variability. Biogenic VOC emissions are predicted interactively in GEOS-Chem using the MEGAN2 scheme (Guenther et al., 2006). Emissions of DMS, NOx from lightning and soils, dust, and sea salt depend on me-teorology and are computed online in the model as described by Pye et al. (2009). Tropospheric methane concentrations are fixed at 2007 values from the NOAA CCGC cooperative air sampling network (4 latitude bands, mean concentrations ranging from 1733 to 1856 ppb).
Anthropogenic emissions of ozone and aerosol precursors (SOx, NOx, NH3, BC, OC, CO, and VOCs) for the year 2100 follow the RCP 4.5 scenario as implemented by Holmes et al. (2013). These include fossil fuel, biofuel, and agri-cultural emissions; all other natural and fire emissions, as well as methane concentrations, are identical in the 2100 and 2010 simulations performed here. We note that projections of aerosol precursor emissions show similar trajectories in all four of the RCP scenarios, with the exception of ammo-nia which is projected to remain reasonably constant in the
Table 1. Annual global aerosol or aerosol precursor emissions for
used in GC–RT.
Anthropogenic emissions∗and
Total percent of Total emissions total in emissions (2010) brackets (2010) (2100) SOx(Tg Syr−1) 63.8 53.3 (83 %) 19.5 NOx(Tg Nyr−1) 49.4 31.8 (64 %) 28.0 NH3(Tg Nyr−1) 55.9 37.9 (68 %) 56.3 POA (Tg Cyr−1) 29.3 9.3 (32 %) 20.4 BC (Tg Cyr−1) 6.8 4.5 (66 %) 4.4 Sea Salt (Tg yr−1) 3544 – 3544 Dust (Tg yr−1) 1563 312 (20 %) 1563
∗Includes fossil fuel, biofuel, and agriculture (but not biomass burning).
RCP 4.5 scenario but projected to rise in all other scenarios. Global emission totals for aerosols and their precursors in 2010 and 2100 are given in Table 1.
Recent versions of the GEOS-Chem standard aerosol sim-ulation have been extensively tested against airborne (van Donkelaar et al., 2008; Heald et al., 2011; Wang et al., 2011), shipborne (Lapina et al., 2011), and surface-site (Zhang et al., 2012; Heald et al., 2012) mass-concentration measure-ments as well as aerosol deposition measuremeasure-ments (Fisher et al., 2011) and satellite and ground-based observations of AOD (Ridley et al., 2012; Jaegle et al., 2010; Ford and Heald, 2012).
2.2 Rapid radiative transfer model for GCMs
(RRTMG)
RRTMG (Iacono et al., 2008) is a fast radiative transfer code that calculates long-wave and shortwave atmospheric fluxes using the correlated-k method (Lacis and Oinas, 1991). The absorption coefficients that are used to develop the code’s k-distributions are attained directly from the line-by-line radia-tive transfer model (LBLRTM) (Clough et al., 1992, 2005; Alvarado et al., 2013), which connects the spectroscopic foundation of RRTMG to high-spectral resolution valida-tions done with atmospheric radiance observavalida-tions. There are 16 bands in the long-wave RRTMG code and 14 bands in the shortwave code (extending from 230 nm through 56 µm); for boundaries see Mlawer et al. (1997) and Mlawer and Clough (1998). Modeled sources of extinction in RRTMG include H2O, O3, long-lived greenhouse gases, aerosols, ice and liquid clouds, and Rayleigh scattering. RRTMG has been successfully incorporated into a number of GCMs (Iacono et al., 2003, 2008), including the ECMWF IFS, the NCEP GFS and the NCAR CAM5.
For cloudy cases, vertical overlap of cloudy layers is han-dled using the Monte Carlo independent column approx-imation (McICA; Pincus et al., 2003), which reduces the
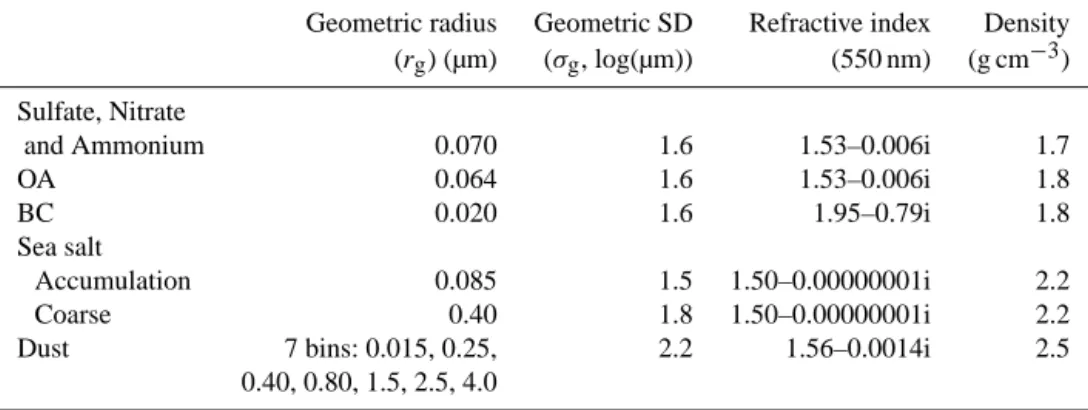
Table 2. GC–RT speciated dry aerosol size and optical properties.
Geometric radius Geometric SD Refractive index Density
(rg) (µm) (σg, log(µm)) (550 nm) (g cm−3)
Sulfate, Nitrate
and Ammonium 0.070 1.6 1.53–0.006i 1.7
OA 0.064 1.6 1.53–0.006i 1.8
BC 0.020 1.6 1.95–0.79i 1.8
Sea salt
Accumulation 0.085 1.5 1.50–0.00000001i 2.2
Coarse 0.40 1.8 1.50–0.00000001i 2.2
Dust 7 bins: 0.015, 0.25, 2.2 1.56–0.0014i 2.5
0.40, 0.80, 1.5, 2.5, 4.0
computational load for the treatment of complex vertically overlapping cloud to that of a model run for a simpler con-figuration (e.g., clear, single-layer clouds) by assigning sta-tistically appropriate combinations of cloud layers to each spectral element in the calculation. This requires that com-parisons between RRTMG and observed fluxes and heating rates average a sufficiently large number of data points (in space and/or time) to remove the unbiased noise introduced by the McICA approximation. This random noise in the ra-diative fluxes and heating rates introduced by McICA has been shown to have statistically insignificant effects on GCM simulations (e.g., Barker et al., 2008).
RRTMG has been shown to be highly accurate in tests against reference radiative transfer calculations as part of the Continual Intercomparison of Radiation Codes (CIRC) project (Oreopoulos and Mlawer, 2010; Oreopoulos et al., 2012), which included numerous evaluations of the radiative effects due to aerosols.
2.3 Integration of GEOS-Chem and RRTMG (GC–RT)
RRTMG is called at a user-specified temporal frequency (3 h here) within GEOS-Chem and calculates instantaneous ra-diative fluxes in both the shortwave and long wave. In ad-dition to total fluxes, GC–RT can calculate the SW or LW flux associated with a specific constituent of the troposphere (ozone, methane, sulfate, nitrate, ammonium, BC, OA, sea salt, dust, or total particulate matter) by calling RRTMG again with zero constituent concentration for the species of interest and differencing the result. We describe the specifi-cation of a suite of relevant surface and atmospheric compo-sition properties here.
All aerosols in GEOS-Chem are treated as externally mixed with log-normal size distributions and optical prop-erties (including refractive indices and hygroscopic growth factors) defined by the Global Aerosol Data Set (GADS) database (Kopke et al., 1997), with recent updates (Drury et al., 2010; Jaegle et al., 2010; Ridley et al., 2012). We do not include any absorption enhancement from the coat-ing of BC in these simulations. We update the BC density
0.10 0.15 0.22 0.32 0.46 0.68 1.00
MODIS Surface Albedo (UV-vis) MODIS Surface Albedo (NIR)
Figure 1. Annual mean surface direct albedo in the UV visible (left)
and near infrared (right) from MODIS 2002–2007 observations.
and refractive index to follow recommendations of Bond and Bergstrom (2006) and the shortwave refractive indices for dust following Sinyuk (2003). We also link simulated sulfate with the GADS water-soluble-type aerosol properties, not the sulfuric acid properties previously applied in the GEOS-Chem simulation, as recommended by Hess et al. (1998). Table 2 gives the relevant optical and size properties for dry aerosol. Mie code is used to calculate the resulting op-tical properties (including mass extinction efficiency) at 7 discrete relative humidities (RH) for each wavelength. The optical properties generated at 61 GADS wavelengths (from 250 nm to 40 µm) are spline interpolated to the 30 RRTMG wavelengths (230 nm to 56 µm) and stored in a look-up table which includes the mass extinction efficiency, the single scat-tering albedo (SSA) and asymmetry parameter (g). Aerosol properties at the two RRTMG wavelengths that fall outside of the range of the GADS wavelengths are fixed at the values of the shortest and longest wavelengths in GADS. The AOD at a specific wavelength is calculated within GEOS-Chem as a function of local relative humidity from the mass concentra-tion and mass extincconcentra-tion efficiency according to the formula-tion of Tegen and Lacis (1996). RRTMG uses the AOD, SSA and asymmetry parameter for each aerosol type to calculate aerosol impacts on radiative fluxes in both the shortwave and long wave.
Table 3. Global annual mean aerosol budget and impacts simulated for 2010 using GC–RT (comparisons with AEROCOM II means from
Myhre et al. (2013) in round brackets; comparisons with AEROCOM I medians from Kinne et al. (2006) in square brackets). Note anthro-pogenic here does not include biomass burning.
Total Sulfate Nitrate Ammoniuma BC OAb Sea Salt Dust
Burden [Tg] 1.27 [1.99] 0.26 0.35 0.10 [0.20] 2.01 [1.68] 3.94 [6.43] 22.9 [19.9] Anthropogenic fraction 0.60 0.82 0.82 0.57 0.21 0.0 0.20 Anthropogenic burden [Tg] 0.76 (0.91 ± 0.24) 0.21 (0.29 ± 0.14) 0.29 0.057 (0.071 ± 0.036) 0.44 (0.33 ± 0.23) 0.0 4.57 AOD, 550 nm 0.092 0.0154 [0.034] 0.0031 0.0041 0.0012 [0.004] 0.0147 [0.019] 0.032 [0.030] 0.021 [0.032] Anthro AOD, 550 nm 0.023 (0.030 ± 0.01) 0.0092 (0.021 ± 0.009) 0.0025 (0.0056 ± 0.0027) 0.0034 0.0007 (0.0015 ± 0.0005) 0.0029 (0.0062 ± 0.0071) 0.0 0.004 MEE = AOD/burden [m2g−1] 6.3 (12.7 ± 8.6) [8.5] 5.7 (9.8 ± 2.0) 5.9 5.9 (10.5 ± 3.9) [8.9] 3.8 (7.5 ± 6.5) [5.7] 4.1 [3.0] 0.47 [0.95]
TOA DRE, clear-sky [Wm−2] −2.75 −0.54 −0.095 −0.14 0.10 −0.61 −1.10 −0.37 SW LW −3.01 0.26 −0.55 0.01 −0.097 0.002 −0.14 0.003 0.10 0.002 −0.63 0.02 −1.16 0.06 −0.53 0.16 TOA DRE, all-sky
[Wm−2] −1.83 −0.35 −0.067 −0.095 0.14 −0.42 −0.77 −0.26 SW LW −2.03 0.19 −0.36 0.007 −0.069 0.002 −0.097 0.002 0.14 0.001 −0.43 0.01 −0.81 0.04 −0.40 0.14 TOA DRF, clear-sky [Wm−2] −0.57 (−0.67 ± 0.18) −0.29 −0.079 −0.11 0.06 −0.075 0.0 −0.074 TOA DRF, all-sky [Wm−2] −0.36 (−0.32c±0.15) −0.20 (−0.32 ± 0.11) −0.055 (−0.08 ± 0.04) −0.076 0.078 (0.18 ± 0.07) −0.055 (−0.09) 0.0 −0.053
aContributions from ammonium are included in sulfate and nitrate in AeroCom II.bWe sum POA and SOA mean model values form AeroCom II.cTaken from Fig. 7 of Myhre et al. (2013).
Vertical profiles of a suite of greenhouse gases are fixed in GC–RT for both long-wave and shortwave flux calculations. These include: N2O and stratospheric CH4 (following the July 2012 zonal mean climatology from the TES instrument), CFCs (CFC-11, CFC-12, and CCl4 from UARS climatol-ogy and CFC-22 from the MIPAS climatolclimatol-ogy, all scaled to match surface values provided in IPCC, 2007) and CO2 (set to 390 ppm globally). Zonally averaged tropospheric methane concentrations are fixed as described in Sect. 2.1. Tropospheric ozone is simulated interactively in GEOS-Chem; stratospheric concentrations are calculated based on the method used in FAST-J (Wild et al., 2000). Water va-por concentrations are specified according to the GEOS-5 as-similated meteorology. All gas-phase optical properties fol-low HITRAN (Rothman et al., 2005), as described by Iacono et al. (2008) and Mlawer and Clough (Mlawer and Clough, 1998).
Cloud optical properties required in RRTMG are calcu-lated based on the liquid and ice visible optical depths from the GEOS-5 assimilated meteorology. We assume fixed ef-fective radii of 14.2 µm for water droplets and 24.8 µm for ice particles based on a near-10-year average of MODIS-Aqua data (L. Oreopoulos, personal communication, 12 Decem-ber 2012). From the optical depths and radii, we calculate the liquid and ice water path (LWP, IWP), the later based on
the Fu (1996) treatment of ice cloud particles. The optical properties (extinction, SSA and asymmetry parameter) are then calculated from the LWP/IWP, the effective radii and a series of wavelength-specific parameters for liquid water (Hu and Stamnes, 1993) and ice (Fu, 1996; Fu et al., 1998). Bosilovich et al. (2011) provide an overview of the water budget in the MERRA re-analysis (based on the same GEOS-5 assimilation system used here).
A climatology of surface albedo and emissivity is based on the multi-wavelength 8-day land composites from MODIS for 2002 through 2007 available at 0.05◦horizontal resolu-tion (Schaaf et al., 2002; Wan et al., 2002). The MODIS land emissivity product (MOD11C2) provided at 6 long-wave long-wavelengths is interpolated to the 16 RRTMG long- wave-lengths (values at wavewave-lengths outside of the observed range are held fixed at the edge values). The emissivity of the ocean is set to 0.98. From Sidran (1981) this appears to be relatively constant between 0.2 and 12 µm, after which it decreases slightly to 0.95 until beyond 40 µm. The broadband direct and diffuse albedos for both the UV visible and visible IR are specified from the MODIS land albedo data (MCD43C3). Ocean albedo is held constant at 0.07 across all wavelengths (Stier et al., 2007). We do not include diurnal variation in surface albedos. Annual mean surface albedos used here are shown in Fig. 1. We note that aerosols produce a very modest
Figure 2. Annual mean AOD (left), shortwave TOA clear-sky direct radiative effect (center) and long-wave TOA clear-sky direct radiative
effect (right) simulated by GC–RT for 2010. Color bars are saturated at respective values.
warming in the shortwave over the most highly reflective hot spots over North Africa (El Djouf, Erg of Bilma, and Great Sand Sea), the Middle East, and Greenland (Fig. 1).
2.4 GC–RT simulations
To characterize the radiative impact of present-day aerosols, we perform two simulations: a baseline 2010 simulation and a second identical simulation with zero anthropogenic emis-sions (biomass burning emisemis-sions are not included as anthro-pogenic, see details in Sect. 3). We zero out anthropogenic
-4.0 -2.0 0.0 2.0 4.0 [Wm-2]
DRE (2010) DRF (2010) DRF (2100)
Sulfate Nitrate Ammonium BC OA SeaSalt Dust
-0.8 -0.6 -0.4 -0.2 0.0 0.2 [Wm -2]
Direct Radiative Effect (2010) Direct Radiative Forcing (2010) Direct Radiative Forcing (2100)
Figure 3. Top: global annual mean all-sky aerosol TOA direct radiative effect in 2010 (top left, blue), direct radiative forcing for 2010 (top
center, dark gray) and direct radiative forcing for 2100 (top right, light gray). Mean values for 2010 are given in Table 3.
emissions for 1750 following Dentener et al. (2006) who sug-gest that fossil fuel emissions are negligible for this time pe-riod. We neglect here the biofuel emissions for 1750, which are small for carbonaceous aerosols (12 % of present-day emissions) and negligible for all other species according to Dentener et al. (2006). The difference between these simu-lations provides an estimate of the anthropogenic contribu-tion to the burden, AOD, and ultimately the DRF (which is defined under a fixed climate). While DRF for greenhouse gases is calculated at the tropopause after stratospheric tem-perature adjustment, “for most aerosol constituents, strato-spheric adjustment has little effect on the RF, and the in-stantaneous RF at either the top of the atmosphere or the tropopause can be substituted” (IPCC, 2007). Estimates of the anthropogenic fraction of global dust emissions due to agricultural activities (e.g., plowing, grazing, irrigation) vary widely (e.g., Tegen et al., 2004; Mahowald and Luo, 2003); here we assume that 20 % of all dust is of anthropogenic ori-gin; the anthropogenic contribution likely varies regionally, we assume a fixed fraction here.
3 Results
Table 3 summarizes the GC–RT aerosol simulation and com-pares these results to the AeroCom I and AeroCom II model means where available (Myhre et al., 2013; Kinne et al., 2006). Global annual mean burdens for OA and dust are sim-ilar (within 20 and 15 %, respectively) to the model medians from the AeroCom I models for the year 2000 (Kinne et al., 2006), whereas, the GC–RT burden of BC is about half of the AeroCom I model median value. Koch et al. (2009) show
that the AeroCom I models are on average a factor of 8 times larger than BC concentrations measured aboard aircraft over the Americas, but underestimate BC at high northern lati-tudes and in Asia. Schwarz et al. (2010) show that the Ae-roCom I models generally overestimate BC (by an average a factor of 5) in remote regions based on comparisons with the HIPPO airborne observations over the Pacific. Sulfate is also 32 % lower than the AeroCom I median; however, the sum of inorganic aerosol (sulfate, nitrate and ammonium) in GEOS-Chem is within 5 % of the sulfate-only value for AeroCom I. The burden of sea salt is significantly lower (∼ 40 %) than AeroCom I; however, the sea salt in GEOS-Chem has re-cently been evaluated and refined based on comparisons with satellite and in situ observations (Jaegle et al., 2010). The cal-culated global mean mass extinction efficiency (MEE) for all aerosol are lower than the AeroCom II model means; how-ever, the wide range of model estimates given by Myhre et al. (2013) suggests that these are not well constrained in the AeroCom II models. In fact this large range in model MEE suggests that differences in model treatments of aerosol re-moval, size, and optical properties (including water uptake) can lead to at least a factor of 2 difference in model estimates of aerosol radiative fluxes.
Lower aerosol MEE in GC–RT translate to a lower global mean mid-visible AOD of 0.092 compared to the AeroCom I model mean of 0.127 and satellite-based estimates (∼ 0.15) (Kinne et al., 2006). Figure 2 shows the geographical dis-tribution of annual mean AOD for present-day, over half of which is attributed to dust and sea salt. Sulfate and OA contribute a further 33 %, with nitrate, ammonium, and BC making minor near-source contributions to the global AOD. The GC–RT anthropogenic AOD is 77 % of the mean of the
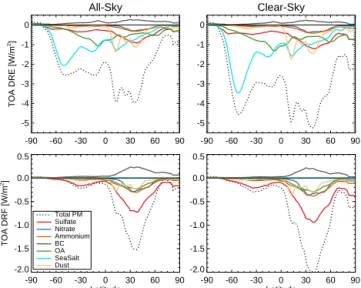
All-Sky -90 -60 -30 0 30 60 90 -5 -4 -3 -2 -1 0 TOA DRE [W/m 2] Clear-Sky -90 -60 -30 0 30 60 90 -5 -4 -3 -2 -1 0 -90 -60 -30 0 30 60 90 Latitude -2.0 -1.5 -1.0 -0.5 0.0 0.5 TOA DRF [W/m 2] Total PM Sulfate Nitrate Ammonium BC OA SeaSalt Dust -90 -60 -30 0 30 60 90 Latitude -2.0 -1.5 -1.0 -0.5 0.0 0.5
Figure 4. Global zonal mean speciated aerosol TOA direct radiative
effect (top) and direct radiative forcing (bottom) for all-sky (left) and clear-sky (right) simulated by GC–RT for 2010.
AeroCom II models. Similarly, the GC–RT estimate of clear-sky (−0.57 Wm−2)global mean TOA aerosol direct radiative forcing (DRF) is 15 % lower (less cooling) than the AeroCom II model mean.
The IPCC (2007) estimates the aerosol DRF at
−0.5 Wm−2(with a range of −0.9 to −0.1 Wm−2)in 2005 based on both models and satellite measurement. The model-only value (adjusted for dust and nitrate which is not in-cluded in all models) is lower at −0.4 Wm−2. Our global-mean all-sky value for 2010 (−0.36 Wm−2)is similar. If we double BC absorption, as a crude approximation of inter-nal mixing, then the 2010 DRF would be −0.28 Wm−2, a 20 % change from our base estimate. We do not include any biomass burning sources in our DRF calculation due to the uncertainty in attributing the anthropogenic fraction. Anthro-pogenic modulation of biomass burning emissions is driven by changing agricultural practices, land clearing, and human fire suppression but not by climate change (this constitutes a feedback). We use an additional simulation to estimate a DRE of −0.19 Wm−2from all biomass burning particles in 2010 (−0.23 Wm−2 from OA, +0.06 Wm−2 from BC and
−0.02 Wm−2from inorganic aerosol). The IPCC (2007) es-timate of the aerosol DRF of biomass burning linked with human activities is +0.03 Wm−2, indicating that the net im-pact of biomass burning aerosol is treated as more absorbing than our estimate or that the amount and spatial distribution of the aerosol relative to underlying reflecting clouds and ar-eas with high-surface albedo differ.
All-sky DRF in GC–RT is 63 % of the estimate of clear-sky DRF. The global annual mean cloud fraction in GC–RT for 2010 is 60 %. This implies a global-mean cloud-sky TOA DRF of −0.22 Wm−2, a lower value (less cooling), consis-tent with a shading of scattering aerosols below clouds and
All-Sky J F M A M J J A S O N D -5 -4 -3 -2 -1 0 TOA DRE [W/m 2] Clear-Sky J F M A M J J A S O N D -4 -3 -2 -1 0 J F M A M J J A S O N D -1.5 -1.0 -0.5 0.0 TOA DRF [W/m 2] Total PM Sulfate Nitrate Ammonium BC OA SeaSalt Dust J F M A M J J A S O N D -1.5 -1.0 -0.5 0.0
Figure 5. Global seasonal mean speciated aerosol TOA direct
ra-diative effect (top) and direct rara-diative forcing (bottom) for all-sky (left) and clear-sky (right) simulated by GC–RT for 2010.
enhanced absorption from BC above clouds. The all-sky to clear-sky ratio is typically ∼ 50 % for the AeroCom II mod-els (Myhre et al., 2013). Our slightly higher fraction is likely the result of the lower estimated BC loading.
Table 3 shows that the total TOA radiative effects are dominated by aerosol impacts in the shortwave (visible UV) wavelengths, where they reflect solar radiation and cool the Earth (with the exception of BC which absorbs solar radia-tion). Modest warming (< 10 % of the cooling effect) results from scattering (by large particles such as dust) or absorption in the long-wave (IR) wavelengths (Fig. 2). This indicates that a SW-only aerosol DRE estimate would overestimate the cooling effect by ∼ 5–10 %.
Figure 3 contrasts the GC–RT estimates of all-sky DRF and DRE. The DRF represents a change in radiative balance from pre-industrial to present-day (2010) with fixed climate, which reflects the rise in anthropogenic emissions (and an-thropogenic land use, not considered here). Conversely, the DRE represents the total present-day radiative impact from all aerosols in the atmosphere, including those of natural origin. As a result, aerosols that are dominated by anthro-pogenic sources (e.g., nitrate) show a similar DRE and DRF, whereas natural aerosols (e.g., sea salt) have a large DRE but zero DRF. The estimate of total aerosol DRE (−1.83 Wm−2) is more than 5 times the value of the DRF (−0.36 Wm−2)in 2010, thus the global radiative impact of “natural” aerosol is more than 4 times that of anthropogenic aerosol perturbation. Rap et al. (2013) estimated an all-sky natural aerosol DRE of
−0.81 Wm−2from DMS sulfate, sea salt, terpene SOA, and wildfire alone.
Figure 4 shows the zonal distribution of the GC–RT simu-lated radiative impacts. We see that the forcing is highly con-centrated at northern mid-latitudes, driven by anthropogenic
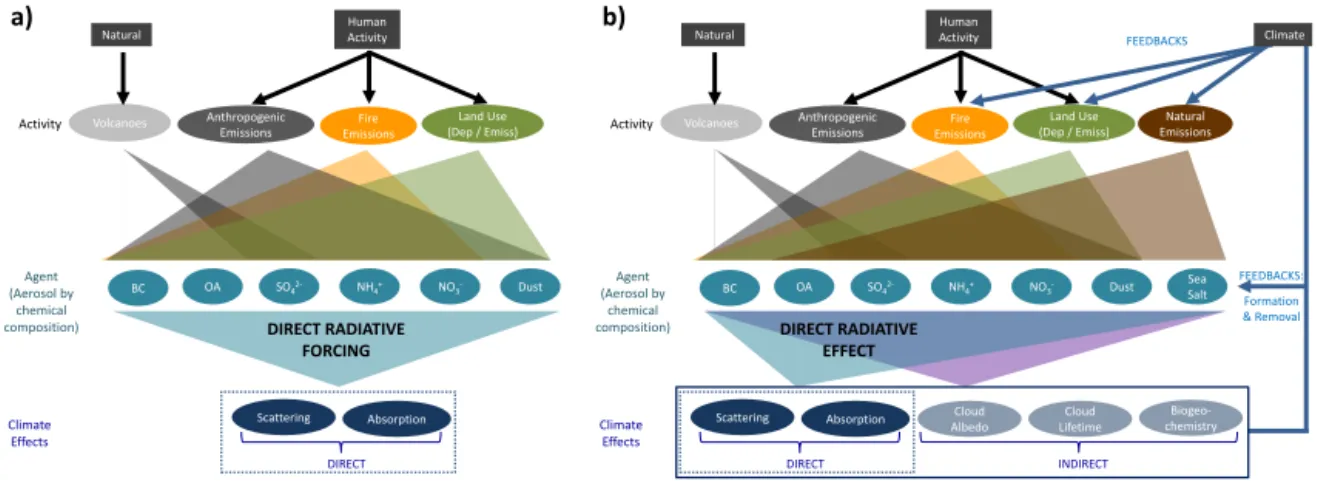
Anthropogenic Emissions Fire Emissions Land Use (Dep / Emiss) Human Activity SO42- NH4+ NO3- OA BC Dust Scattering Absorption Climate Effects DIRECT DIRECT RADIATIVE EFFECT Agent (Aerosol by chemical composition)
Activity Emissions Natural
Sea Salt FEEDBACKS Cloud Albedo Cloud Lifetime Biogeo-chemistry INDIRECT Climate b) Natural Volcanoes FEEDBACKS: Formation & Removal Anthropogenic Emissions Fire Emissions Land Use (Dep / Emiss) Human Activity SO42- NH4+ NO3- OA BC Dust Scattering Absorption Climate Effects DIRECT DIRECT RADIATIVE FORCING Agent (Aerosol by chemical composition) Activity a) Natural Volcanoes
Figure 6. Illustration highlighting the difference between the estimate of (a) direct radiative forcing (left) and (b) direct radiative effect
(right). DRF is the perturbation (since pre-industrial) associated with human activity and natural forcing (i.e., volcanoes). DRE characterizes the instantaneous impact of all aerosols on radiation (including any feedbacks and natural processes).
emissions in North America, Europe, and Asia, in agreement with previous model studies (Myhre et al., 2013). Modest ra-diative impacts in the Arctic are the result of spring/summer Eurasian sulfate pollution, during seasons of minimum snow cover. Conversely, the DRE is distributed throughout the world with maxima associated with not only anthropogenic emissions in the NH, but also with sea salt emissions in the Southern Ocean, biomass burning in the tropics and Arctic, and dust from Africa and Asia. Warming dominates over the deserts in the Sahara, the Middle East, and the highly reflec-tive regions at high northern latitudes; shortwave scattering prevails in all other regions in the simulation.
Similarly, Fig. 5 shows that the global mean DRF from aerosols is largest in boreal springtime (due to sulfate), whereas the DRE is more uniform throughout the year, with summertime peaks due to OA compensated by wintertime enhancements in ammonium nitrate and sea salt.
Figure 3 also shows an estimate of the aerosol all-sky DRF in 2100 from a GC–RT simulation based on the RCP 4.5 emissions scenario. Due to the steep decline in SO2 emissions (Table 1), the global mean sulfate DRF drops by
∼85 % from 2010 to −0.031 Wm−2. As shown by Pinder et al. (2007), reductions in sulfate can lead to enhanced ammo-nium nitrate formation in environments with abundant am-monia supply. Given that amam-monia emissions in 2100 are predicted to be approximately equivalent to those in 2010 in the RCP4.5 scenario, nitrate DRF in 2100 increases by 60 % to −0.088 Wm−2. Overall forcing from ammonium de-creases (the decline in ammonium sulfate outweighing the increase in ammonium nitrate) to −0.046 Wm−2. Finally, changes in BC and POA are more modest, but the magnitude of DRF decreases for both (to 0.056 and −0.053 Wm−2, re-spectively). Dust forcing is maintained at 2010 values. Over-all the clear-sky TOA DRF in 2100 (−0.22 Wm−2)dropped by 39 % from 2010. Smith and Bond (2013) also estimate a precipitous decline (62 %) in aerosol (carbonaceous and
sul-fate only) radiative forcing from 2000 to 2100 when includ-ing both the direct and indirect forcinclud-ing.
4 Discussion and conclusions
We use the newly online coupled GEOS-Chem–RRTMG (GC–RT) model to estimate the direct radiative effect and direct radiative forcing of atmospheric aerosols. The global TOA DRE is over five times the cooling estimated as the DRF. This illustrates that tropospheric aerosols exert a large influence on the global energy balance. However, the quan-tification of DRE and DRF is highly uncertain and the esti-mate of the ratio between them is specific to this model con-figuration and the concurrent assumptions. While the aerosol burden in the GEOS-Chem model is well tested against ob-servations (e.g., Zhang et al., 2012; Fisher et al., 2011; Rid-ley et al., 2012; Jaegle et al., 2010; Lapina et al., 2011), the uncertainties associated with aerosol properties and radiative effects require further investigation.
Uncertainty in our estimates of DRF is dominated by the uncertainty in the MEE (as shown by the AeroCom II study of Myhre et al., 2013). Assumptions regarding size, water up-take and absorption efficiency (e.g., the prevalence of brown carbon (Andreae and Gelencser, 2006)) all contribute to this. We do not treat absorption enhancement from the coating of BC (Jacobson, 2000), the importance of which is unclear (Cappa et al., 2012; Lack et al., 2012), therefore both DRE and DRF values may underestimate absorption. In addition to the uncertainty associated with aerosol optics, our simula-tions likely underestimate the “anthropogenically controlled” SOA in the atmosphere, which is estimated to contribute
−0.26 Wm−2(Spracklen et al., 2011) of direct cooling. The global source of dust arising from anthropogenic activity is also poorly constrained.
Uncertainties in our estimate of DRE are likely even larger than uncertainties on DRF. This is the result of (1) better constraints on anthropogenic sectoral emissions (eg. mobile sources, power generation); (2) a poor understanding of nat-ural particle emissions from ecosystems, both marine and terrestrial, for example, terrestrial primary biological aerosol particles (e.g., Heald and Spracklen, 2009) marine OA and methane sulfonate (Heintzenberg et al., 2000) – none of which are included in this GC–RT simulation; and (3) the geographical extent and remoteness of regions impacted by natural aerosols and hence a lack of measurement constraint (and thus well-tested models).
We use Fig. 6 to distinguish the definition of DRF and DRE of aerosols. The DRF is linked to human-driven activ-ities and neglects all feedbacks. The DRF accounts for the long-term direct drivers of the climate system, which are pri-marily anthropogenic. In the case of aerosols, this includes not only emission of primary particles (e.g., soot) and sec-ondary aerosol precursors (e.g., SO2), but also the changes to the chemistry that governs the formation of secondary aerosols. To the extent that this highly uncertain chemistry (including peroxy radical chemistry and particle acidity) is included in models, it also contributes to the DRF (and its uncertainty). This complicates the separation and interpreta-tion of “anthropogenic” and “natural” aerosol forcing. An-thropogenic land use change is also a driver of aerosol DRF (for example via changes in dust, soil/vegetation, and ammo-nia emissions associated with crop expansion), although it is rarely included in DRF assessments.
Figure 6a also illustrates the potential difference between an activity-based approach and an agent-based approach to estimating RF. When associating a forcing with an agent, in this case an aerosol, all the radiative impacts described in Figure 6a are ascribed to this agent. This mirrors the ap-proach taken in previous IPCC reports (e.g., IPCC, 2007, 2001). Alternatively, an activity-based approach, as sug-gested by Shindell et al. (2009) and used in the most recent IPCC report (IPCC, 2013) can attribute the forcing with (con-trollable) behaviors such as emissions or land use change.
Clearly, the DRF provides an incomplete estimate of the global radiative imbalance imposed by changing aerosol abundance. Indeed, as anthropogenic emissions of aerosols and their precursors are expected to continue to decline glob-ally (van Vuuren et al., 2011), the aerosol DRF will continue to decrease as shown here and by Smith and Bond (2013), diminishing its relevance as a climate metric. At the same time feedbacks from climate change on aerosol are likely to grow. This possibility was highlighted in the IPCC (2013): “climate change may alter natural aerosol sources as well as removal by precipitation”. It is therefore critical that we ex-pand our set of metrics to address the many factors that the DRF neglects by design. Figure 6b shows a more compre-hensive set of drivers for changing aerosol abundance, in-cluding climate feedbacks and natural emissions. In addition to the direct effect of aerosols on climate (the focus of this
study), the indirect effects of aerosols, both the conventional aerosol–cloud interactions and the less well-constrained ef-fect of aerosols on biogeochemistry (Mahowald, 2011), can feed back on aerosol abundance via climate impacts. The relative importance of these feedbacks and forcings on the global radiative flux imbalance over time is unclear and de-serves further investigation. The challenge of attributing a feedback is also non-trivial (e.g., to what agent does one as-sociate a temperature-driven change in aerosol abundance?). Inherently, the calculation of DRE over time (with varying climate) includes the potential to quantify (though not at-tribute) these effects. Furthermore, estimates of the aerosol indirect effect are very sensitive to the pre-industrial aerosol burden, as originally shown by Menon et al. (2002) and more recently discussed by Carlsaw et al. (2013), for which lit-tle observational constraint exists. Thus, two climate models with identical aerosol DRFs could provide very different es-timates of the aerosol indirect aerosol forcing due to differ-ences in the pre-industrial (natural) aerosol burden. Compar-ing the pre-industrial DRE simulated in models would pro-vide a first step towards identifying these key differences.
Quantifying and reporting the instantaneous DRE in global models is a simple and necessary first step in going be-yond the DRF metric for aerosols. While it may not directly serve as a policy tool, the DRE is more easily tested against observations (e.g., satellites), is a more thorough gauge for model comparisons, and offers a more complete picture of aerosols in the climate system. As such, it is an important complement to the DRF for advancing our understanding and predictions of the global aerosol burden and how it may counteract future trends in greenhouse gas warming.
Acknowledgements. This work was supported by the EPA-STAR
program and the Charles E. Reed Faculty Initiative Fund. We thank Susan Solomon for useful discussions. Although the research described in this article has been funded in part by the US EPA through grant/cooperative agreement (RD-83503301), it has not been subjected to the Agency’s required peer and policy review and therefore does not necessarily reflect the views of the Agency and no official endorsement should be inferred.
Edited by: M. C. Facchini
References
Alexander, B., Park, R. J., Jacob, D. J., Li, Q. B., Yan-tosca, R. M., Savarino, J., Lee, C. C. W., and Thiemens, M. H.: Sulfate formation in sea-salt aerosols: Constraints from oxygen isotopes, J. Geophys. Res.-Atmos., 110, D10307, doi:10.1029/2004JD005659, 2005.
Alvarado, M. J., Payne, V. H., Mlawer, E. J., Uymin, G., Shep-hard, M. W., Cady-Pereira, K. E., Delamere, J. S., and Moncet, J. L.: Performance of the Line-By-Line Radiative Transfer Model (LBLRTM) for temperature, water vapor, and trace gas retrievals:
recent updates evaluated with IASI case studies, Atmos. Chem. Phys., 13, 6687–6711, doi:10.5194/acp-13-6687-2013, 2013. Andreae, M. O. and Gelencsér, A.: Black carbon or brown
car-bon? The nature of light-absorbing carbonaceous aerosols, At-mos. Chem. Phys., 6, 3131–3148, doi:10.5194/acp-6-3131-2006, 2006.
Artaxo, P., Rizzo, L. V., Paixao, M., de Lucca, S., Oliveira, P. H., Lara, L. L., Wiedemann, K. T., Andreae, M. O., Holben, B., Schafer, J., Correia, A. L., and Pauliquevis, T. M.: Aerosol Parti-cles in Amazonia: Their Composition, Role in the Radiation Bal-ance, Cloud Formation, and Nutrient Cycles, in: Amazonia and Global Change, Geophys. Monogr. Series, 186, 233–250, 2009. Athanasopoulou, E., Vogel, H., Vogel, B., Tsimpidi, A. P., Pandis,
S. N., Knote, C., and Fountoukis, C.: Modeling the meteoro-logical and chemical effects of secondary organic aerosols dur-ing an EUCAARI campaign, Atmos. Chem. Phys., 13, 625–645, doi:10.5194/acp-13-625-2013, 2013.
Barker, H. W., Cole, J. N. S., Morcrette, J. J., Pincus, R., Raisae-nen, P., von Salzen, K., and Vaillancourt, P. A.: The Monte Carlo Independent Column Approximation: An assessment using sev-eral global atmospheric models, Q. J. Roy. Meteorol. Soc., 134, 1463–1478, doi:10.1002/qj.303, 2008.
Bellouin, N., Boucher, O., Haywood, J., and Reddy, M. S.: Global estimate of aerosol direct radiative forcing from satellite mea-surements, Nature, 438, 1138–1141, doi:10.1038/nature04348, 2005.
Bellouin, N., Quaas, J., Morcrette, J. J., and Boucher, O.: Esti-mates of aerosol radiative forcing from the MACC re-analysis, Atmos. Chem. Phys., 13, 2045–2062, doi:10.5194/acp-13-2045-2013, 2013.
Bond, T. C. and Bergstrom, R. W.: Light absorption by carbona-ceous particles: An investigative review, Aerosol Sci. Technol., 40, 27–67, doi:10.1080/02786820500421521, 2006.
Bond, T. C., Bhardwaj, E., Dong, R., Jogani, R., Jung, S. K., Ro-den, C., Streets, D. G., and Trautmann, N. M.: Historical emis-sions of black and organic carbon aerosol from energy-related combustion, 1850–2000, Global Biogeochem. Cy., 21, Gb2018, doi:10.1029/2006gb002840, 2007.
Bosilovich, M. G., Robertson, F. R., and Chen, J. Y.: Global En-ergy and Water Budgets in MERRA, J. Climate, 24, 5721–5739, doi:10.1175/2011jcli4175.1, 2011.
Boucher, O. and Tanre, D.: Estimation of the aerosol perturba-tion to the Earth’s radiative budget over oceans using POLDER satellite aerosol retrievals, Geophys. Res. Lett., 27, 1103–1106, doi:10.1029/1999gl010963, 2000.
Bouwman, A. F., Lee, D. S., Asman, W. A. H., Dentener, F. J., Van-derHoek, K. W., and Olivier, J. G. J.: A global high-resolution emission inventory for ammonia, Global Biogeochem. Cy., 11, 561–587, 1997.
Cappa, C. D., Onasch, T. B., Massoli, P., Worsnop, D. R., Bates, T. S., Cross, E. S., Davidovits, P., Hakala, J., Hayden, K. L., Jobson, B. T., Kolesar, K. R., Lack, D. A., Lerner, B. M., Li, S. M., Mellon, D., Nuaaman, I., Olfert, J. S., Petaja, T., Quinn, P. K., Song, C., Subramanian, R., Williams, E. J., and Zaveri, R. A.: Radiative Absorption Enhancements Due to the Mixing State of Atmospheric Black Carbon, Science, 337, 1078–1081, doi:10.1126/science.1223447, 2012.
Carslaw, K. S., Boucher, O., Spracklen, D. V., Mann, G. W., Rae, J. G. L., Woodward, S., and Kulmala, M.: A review of natu-ral aerosol interactions and feedbacks within the Earth system, Atmos. Chem. Phys., 10, 1701–1737, doi:10.5194/acp-10-1701-2010, 2010.
Carslaw, K. S., Lee, L. A., Reddington, C. L., Pringle, K. J., Rap, A., Forster, P. M., Mann, G. W., Spracklen, D. V., Woodhouse, M. T., Regayre, L. A., and Pierce, J. R.: Large contribution of natural aerosols to uncertainty in indirect forcing, Nature, 503, 67–71, doi:10.1038/nature12674, 2013.
Chung, S. H. and Seinfeld, J. H.: Global distribution and climate forcing of carbonaceous aerosols, J. Geophys. Res.-Atmos., 107, 4407, doi:10.1029/2001JD001397, 2002.
Clough, S. A., Iacono, M. J., and Moncet, J. L.: Line-by-line calcu-lations of atmospheric fluxes and cooling rates – application to water-vapor, J. Geophys. Res.-Atmos., 97, 15761–15785, 1992. Clough, S. A., Shephard, M. W., Mlawer, E., Delamere, J.
S., Iacono, M., Cady-Pereira, K., Boukabara, S., and Brown, P. D.: Atmospheric radiative transfer modeling: a summary of the AER codes, J. Quant. Spectrosc. Ra., 91, 233–244, doi:10.1016/j.jqsrt.2004.05.058, 2005.
Dentener, F., Kinne, S., Bond, T., Boucher, O., Cofala, J., Generoso, S., Ginoux, P., Gong, S., Hoelzemann, J. J., Ito, A., Marelli, L., Penner, J. E., Putaud, J.-P., Textor, C., Schulz, M., van der Werf, G. R., and Wilson, J.: Emissions of primary aerosol and precur-sor gases in the years 2000 and 1750 prescribed data-sets for Ae-roCom, Atmos. Chem. Phys., 6, 4321–4344, doi:10.5194/acp-6-4321-2006, 2006.
Drury, E. E., Jacob, D. J., Spurr, R. J. D., Wang, J., Shinozuka, Y., Anderson, B. E., Clarke, A. D., Dibb, J., McNaughton, C., and Weber, R. J.: Synthesis of satellite (MODIS), aircraft (ICARTT), and surface (IMPROVE, EPA-AQS, AERONET) aerosol observations over eastern North America to improve MODIS aerosol retrievals and constrain aerosol concentra-tions and sources, J. Geophys. Res.-Atmos., 115, D14204, doi:10.1029/2009JD012629, 2010.
Fairlie, T. D., Jacob, D. J., and Park, R. J.: The impact of transpacific transport of mineral dust in the United States, Atmos. Environ., 41, 1251–1266, 2007.
Fisher, J. A., Jacob, D. J., Wang, Q., Bahreini, R., Carouge, C. C., Cubison, M. J., Dibb, J. E., Diehl, T., Jimenez, J. L., Leibensperger, E. M., Meinders, M. B. J., Pye, H. O. T., Quinn, P. K., Sharma, S., van Donkelaar, A., and Yantosca, R. M.: Sources, distribution, and acidity of sulfate-ammonium aerosol in the Arc-tic in winter-spring, Atmos. Environ., 45, 7301–7318, 2011. Ford, B. and Heald, C. L.: An A-train and model
perspec-tive on the vertical distribution of aerosols and CO in the Northern Hemisphere, J. Geophys. Res.-Atmos., 117, D06211, doi:10.1029/2011JD016977, 2012.
Fountoukis, C. and Nenes, A.: ISORROPIA II: a
computa-tionally efficient thermodynamic equilibrium model for K+
-Ca2+-Mg2+-NH+4-Na+-SO2−4 -NO−3-Cl−-H2O aerosols,
At-mos. Chem. Phys., 7, 4639–4659, doi:10.5194/acp-7-4639-2007, 2007.
Fu, Q.: An accurate parameterization of the solar
ra-diative properties of cirrus clouds for climate
mod-els, J. Climate., 9, 2058–2082,
Fu, Q., Yang, P., and Sun, W. B.: An accurate parameterization of the infrared radiative properties of cirrus clouds for cli-mate models, J. Clicli-mate., 11, 2223–2237, doi:10.1175/1520-0442(1998)011<2223:AAPOTI>2.0.CO;2 1998.
Ginoux, P., Prospero, J. M., Torres, O., and Chin, M.: Long-term simulation of global dust distribution with the GOCART model: correlation with North Atlantic Oscillation, Environ. Modell. Softw., 19, 113–128, 2004.
Goto, D., Takemura, T., and Nakajima, T.: Importance of global aerosol modeling including secondary organic aerosol formed from monoterpene, J. Geophys. Res.-Atmos., 113, D07205, doi:10.1029/2007jd009019, 2008.
Guenther, A., Karl, T., Harley, P., Wiedinmyer, C., Palmer, P. I., and Geron, C.: Estimates of global terrestrial isoprene emissions using MEGAN (Model of Emissions of Gases and Aerosols from Nature), Atmos. Chem. Phys., 6, 3181–3210, doi:10.5194/acp-6-3181-2006, 2006.
Heald, C. L. and Spracklen, D. V.: Global budget of organic aerosol from fungal spores, Geophys. Res. Lett., 36, L09806, doi:10.1029/2009GL037493, 2009.
Heald, C. L., Jacob, D. J., Park, R. J., Russell, L. M., Huebert, B. J., Seinfeld, J. H., Liao, H., and Weber, R. J.: A large organic aerosol source in the free troposphere missing from current models, Geo-phys. Res. Lett., 32, L18809, doi:10.1029/2005GL023831, 2005. Heald, C. L., Henze, D. K., Horowitz, L. W., Feddema, J., Lamar-que, J. F., Guenther, A., Hess, P. G., Vitt, F., Seinfeld, J. H., Goldstein, A. H., and Fung, I.: Predicted change in global sec-ondary organic aerosol concentrations in response to future cli-mate, emissions, and land use change, J. Geophys. Res.-Atmos., 113, D05211, doi:10.1029/2007JD009092, 2008.
Heald, C. L., Wilkinson, M. J., Monson, R. K., Alo, C. A., Wang, G. L., and Guenther, A.: Response of isoprene
emis-sion to ambient CO2 changes and implications for global
bud-gets, Global Change Biol., 15, 1127–1140, doi:10.1111/j.1365-2486.2008.01802.x, 2009.
Heald, C. L., Coe, H., Jimenez, J. L., Weber, R. J., Bahreini, R., Middlebrook, A. M., Russell, L. M., Jolleys, M., Fu, T.-M., Al-lan, J. D., Bower, K. N., Capes, G., Crosier, J., Morgan, W. T., Robinson, N. H., Williams, P. I., Cubison, M. J., DeCarlo, P. F., and Dunlea, E. J.: Exploring the vertical profile of atmo-spheric organic aerosol: comparing 17 aircraft field campaigns with a global model, Atmos. Chem. Phys., 11, 12673–12696, doi:10.5194/acp-11-12673-2011, 2011.
Heald, C. L., Collett, J. L., Lee, T., Benedict, K. B., Schwandner, F. M., Li, Y., Clarisse, L., Hurtmans, D. R., Van Damme, M., Clerbaux, C., Coheur, P. F., Philip, S., Martin, R. V., and Pye, H. O. T.: Atmospheric ammonia and particulate inorganic nitrogen over the United States, Atmos. Chem. Phys., 12, 10295–10312, doi:10.5194/acp-12-10295-2012, 2012.
Heintzenberg, J., Covert, D. C., and Van Dingenen, R.: Size distribution and chemical composition of marine aerosols: a compilation and review, Tellus Ser. B, 52, 1104–1122, doi:10.1034/j.1600-0889.2000.00136.x, 2000.
Henze, D. K. and Seinfeld, J. H.: Global secondary organic aerosol from isoprene oxidation, Geophys. Res. Lett., 33, L09812, doi:10.1029/2006GL025976, 2006.
Henze, D. K., Seinfeld, J. H., Ng, N. L., Kroll, J. H., Fu, T.-M., Jacob, D. J., and Heald, C. L.: Global modeling of secondary organic aerosol formation from aromatic hydrocarbons: high-vs. low-yield pathways, Atmos. Chem. Phys., 8, 2405–2420, doi:10.5194/acp-8-2405-2008, 2008.
Hess, M., Koepke, P., and Schult, I.: Optical properties of aerosols and clouds: The software package OPAC, B. Am. Meteorol. Soc., 79, 831–844, 1998.
Holmes, C. D., Prather, M. J., Sovde, O. A., and Myhre, G.: Future methane, hydroxyl, and their uncertainties: key climate and emis-sion parameters for future predictions, Atmospheric Chemistry and Physics, 13, 285–302, doi:10.5194/acp-13-285-2013, 2013. Hu, Y. X. and Stamnes, K.: An Accurate Parameterization of
the Radiative Properties of Water Clouds Suitable for Use in Climate Models, J. Climate., 6, 728–742, doi:10.1175/1520-0442(1993)006<0728:AAPOTR>2.0.CO;2, 1993.
Iacono, M. J., Delamere, J. S., Mlawer, E. J., and Clough, S. A.: Evaluation of upper tropospheric water vapor in the NCAR Community Climate Model (CCM3) using modeled and ob-served HIRS radiances, J. Geophys. Res.-Atmos., 108, 4037, doi:10.1029/2002jd002539, 2003.
Iacono, M. J., Delamere, J. S., Mlawer, E. J., Shephard, M. W., Clough, S. A., and Collins, W. D.: Radiative forcing by long-lived greenhouse gases: Calculations with the AER radia-tive transfer models, J. Geophys. Res.-Atmos., 113, D13103, doi:10.1029/2008jd009944, 2008.
IPCC: Climate Change: The IPCC Scientific Assessment, Cam-bridge, UK, 365 pp., 1990.
IPCC: Climate Change 1995: The Science of Climate Change, Cambridge, UK, 573 pp., 1995.
IPCC: Climate Change 2001: The Scientific Basis, edited by: Houghton, J. T., Ding, Y., Griggs, D. J., Noguer, M., van der Lin-den, P. J., Dai, X., Maskell, K., and Johnson, C. A., Cambridge University Press, Cambridge, UK, 881 pp., 2001.
IPCC: Climate Change 2007: The Physical Science Basis, edited by: Solomon, S., Qin, D., Manning, M., Marquis, M., Averyt, K., Tignor, M. M. B., Miller, H. L., and Chen, Z., Cambridge University Press, Cambridge, UK, 996 pp., 2007.
IPCC: Climate Change 2013: The Physical Science Basis: Sum-mary for Policymakers, Cambridge, UK, 2013.
Jacobson, M. Z.: A physically-based treatment of elemental carbon optics: Implications for global direct forcing of aerosols, Geo-phys. Res. Lett., 27, 217–220, 2000.
Jaeglé, L., Quinn, P. K., Bates, T. S., Alexander, B., and Lin, J.-T.: Global distribution of sea salt aerosols: new constraints from in situ and remote sensing observations, Atmos. Chem. Phys., 11, 3137–3157, doi:10.5194/acp-11-3137-2011, 2011.
Jo, D. S., Park, R. J., Kim, M. J., and Spracklen, D. V.: Effects of chemical aging on global secondary organic aerosol using the volatility basis set approach, Atmos. Environ., 18, 230–244, doi:10.1016/j.atmosenv.2013.08.055, 2013.
Kim, J., Yoon, S. C., Kim, S. W., Brechtel, F., Jefferson, A., Dutton, E. G., Bower, K. N., Cliff, S., and Schauer, J. J.: Chemical ap-portionment of shortwave direct aerosol radiative forcing at the Gosan super-site, Korea during ACE-Asia, Atmos. Environ., 40, 6718–6729, doi:10.1016/j.atmosenv.2006.06.007, 2006.
Kinne, S., Schulz, M., Textor, C., Guibert, S., Balkanski, Y., Bauer, S. E., Berntsen, T., Berglen, T. F., Boucher, O., Chin, M., Collins, W., Dentener, F., Diehl, T., Easter, R., Feichter, J., Fillmore, D., Ghan, S., Ginoux, P., Gong, S., Grini, A., Hendricks, J., Herzog, M., Horowitz, L., Isaksen, I., Iversen, T., Kirkevåg, A., Kloster, S., Koch, D., Kristjansson, J. E., Krol, M., Lauer, A., Lamarque, J. F., Lesins, G., Liu, X., Lohmann, U., Montanaro, V., Myhre, G., Penner, J., Pitari, G., Reddy, S., Seland, O., Stier, P., Take-mura, T., and Tie, X.: An AeroCom initial assessment – optical properties in aerosol component modules of global models, At-mos. Chem. Phys., 6, 1815–1834, doi:10.5194/acp-6-1815-2006, 2006.
Koch, D., Schulz, M., Kinne, S., McNaughton, C., Spackman, J. R., Balkanski, Y., Bauer, S., Berntsen, T., Bond, T. C., Boucher, O., Chin, M., Clarke, A., De Luca, N., Dentener, F., Diehl, T., Dubovik, O., Easter, R., Fahey, D. W., Feichter, J., Fillmore, D., Freitag, S., Ghan, S., Ginoux, P., Gong, S., Horowitz, L., Iversen, T., Kirkevåg, A., Klimont, Z., Kondo, Y., Krol, M., Liu, X., Miller, R., Montanaro, V., Moteki, N., Myhre, G., Penner, J. E., Perlwitz, J., Pitari, G., Reddy, S., Sahu, L., Sakamoto, H., Schuster, G., Schwarz, J. P., Seland, Ø., Stier, P., Takegawa, N., Takemura, T., Textor, C., van Aardenne, J. A., and Zhao, Y.: Eval-uation of black carbon estimations in global aerosol models, At-mos. Chem. Phys., 9, 9001–9026, doi:10.5194/acp-9-9001-2009, 2009.
Kopke, P., Hess, M., Schult, I., and Shettle, E. P.: Global aerosol data set, Max Planck Inst. fur Meteorol., Hamburg, Germany, 1997.
Lacis, A. A. and Oinas, V.: A description of the correlated kappa-distribution method for modeling nongray gaseous absorption, thermal emission, and multiple-scattering in vertically inhomo-geneous atmosphere J. Geophys. Res.-Atmos., 96, 9027–9063, doi:10.1029/90jd01945, 1991.
Lack, D. A., Langridge, J. M., Bahreini, R., Cappa, C. D., Mid-dlebrook, A. M., and Schwarz, J. P.: Brown carbon and internal mixing in biomass burning particles, Proc. Natl. Acad. Sci. USA, 109, 14802–14807, doi:10.1073/pnas.1206575109, 2012. Lapina, K., Heald, C. L., Spracklen, D. V., Arnold, S. R., Bates, T.
S., Allan, J. D., Coe, H., McFiggans, G., Zorn, S. R., Drewnick, F., Hind, A., and Smirnov, A.: Investigating organic aerosol load-ing in the remote marine environment, Atmos. Chem. Phys., 11, 8847–8860, doi:10.5194/acp-11-8847-2011, 2011.
Liao, H., Seinfeld, J. H., Adams, P. J., and Mickley, L. J.: Global radiative forcing of coupled tropospheric ozone and aerosols in a unified general circulation model, J. Geophys. Res.-Atmos., 109, D16207, doi:10.1029/2003jd004456, 2004.
Liu, H. Y., Jacob, D. J., Bey, I., and Yantosca, R. M.: Constraints from Pb-210 and Be-7 on wet deposition and transport in a global three-dimensional chemical tracer model driven by as-similated meteorological fields, J. Geophys. Res.-Atmos., 106, 12109–12128, 2001.
Ma, X., Yu, F., and Luo, G.: Aerosol direct radiative forcing based on GEOS-Chem-APM and uncertainties, Atmos. Chem. Phys., 12, 5563–5581, doi:10.5194/acp-12-5563-2012, 2012.
Mahowald, N.: Aerosol Indirect Effect on
Biogeochem-ical Cycles and Climate, Science, 334, 794–796,
doi:10.1126/science.1207374, 2011.
Mahowald, N. M. and Luo, C.: A less dusty future?, Geophys. Res. Lett., 30, 1903, doi:10.1029/2003gl017880, 2003.
Mahowald, N. M., Yoshioka, M., Collins, W. D., Conley, A. J., Fill-more, D. W., and Coleman, D. B.: Climate response and radiative forcing from mineral aerosols during the last glacial maximum, pre-industrial, current and doubled-carbon dioxide climates, Geophys. Res. Lett., 33, L20705 doi:10.1029/2006gl026126, 2006.
Massoli, P., Bates, T. S., Quinn, P. K., Lack, D. A., Baynard, T., Lerner, B. M., Tucker, S. C., Brioude, J., Stohl, A., and Williams, E. J.: Aerosol optical and hygroscopic properties dur-ing TexAQS-GoMACCS 2006 and their impact on aerosol di-rect radiative forcing, J. Geophys. Res.-Atmos., 114, D00f07, doi:10.1029/2008jd011604, 2009.
Menon, S., Del Genio, A. D., Koch, D., and Tselioudis, G.: GCM Simulations of the aerosol indirect effect: Sensitivity to cloud pa-rameterization and aerosol burden, J. Atmos. Sci., 59, 692–713, doi:10.1175/1520-0469(2002)059<0692:gsotai>2.0.co;2, 2002. Mlawer, E. J. and Clough, S. A.: Shortwave and longwave
enhance-ments in the rapid radiative transfer model, 7th Atmospheric Ra-diation Measurement (ARM) Science Team Meeting, San Anto-nia, Texas, 409–413, 1998.
Mlawer, E. J., Taubman, S. J., Brown, P. D., Iacono, M. J., and Clough, S. A.: Radiative transfer for inhomoge-neous atmospheres: RRTM, a validated correlated-k model for the longwave, J. Geophys. Res.-Atmos., 102, 16663–16682, doi:10.1029/97jd00237, 1997.
Myhre, G., Samset, B. H., Schulz, M., Balkanski, Y., Bauer, S., Berntsen, T. K., Bian, H., Bellouin, N., Chin, M., Diehl, T., Easter, R. C., Feichter, J., Ghan, S. J., Hauglustaine, D., Iversen, T., Kinne, S., Kirkevag, A., Lamarque, J. F., Lin, G., Liu, X., Lund, M. T., Luo, G., Ma, X., van Noije, T., Penner, J. E., Rasch, P. J., Ruiz, A., Seland, O., Skeie, R. B., Stier, P., Takemura, T., Tsigaridis, K., Wang, P., Wang, Z., Xu, L., Yu, H., Yu, F., Yoon, J. H., Zhang, K., Zhang, H., and Zhou, C.: Radiative forcing of the direct aerosol effect from AeroCom Phase II simulations, Atmos. Chem. Phys., 13, 1853–1877, doi:10.5194/acp-13-1853-2013, 2013.
Olivier, J. G. J., Berdowski, J. J. M., Peters, J. A. H. W., Bakker, J., Visschedijk, A. J. H., and Bloos, J.-P.J. : Applications of EDGAR Including a description of EDGAR 3.0: reference database with trend data for 1970–1995 Natl. Inst. of Public Health and Envi-ron., Bilthoven, Netherlands, 2001.
Oreopoulos, L. and Mlawer, E.: THE CONTINUAL INTERCOM-PARISON OF RADIATION CODES (CIRC) Assessing Anew the Quality of GCM Radiation Algorithms, B. Am. Meteorol. Soc., 91, 305–310, doi:10.1175/2009bams2732.1, 2010. Oreopoulos, L., Mlawer, E., Delamere, J., Shippert, T., Cole, J.,
Fomin, B., Iacono, M., Jin, Z. H., Li, J. N., Manners, J., Raisa-nen, P., Rose, F., Zhang, Y. C., Wilson, M. J., and Rossow, W. B.: The Continual Intercomparison of Radiation Codes: Re-sults from Phase I, J. Geophys. Res.-Atmos., 117, D06118, doi:10.1029/2011jd016821, 2012.
Park, R. J., Jacob, D. J., Chin, M., and Martin, R. V.: Sources of carbonaceous aerosols over the United States and implica-tions for natural visibility, J. Geophys. Res.-Atmos., 108, 4355, doi:10.1029/2002JD003190, 2003.
Park, R. J., Jacob, D. J., Field, B. D., Yantosca, R. M., and Chin, M.: Natural and transboundary pollution influences on sulfate-nitrate-ammonium aerosols in the United States: Im-plications for policy, J. Geophys. Res.-Atmos., 109, D15204, doi:10.1029/2003JD004473, 2004.
Park, R. J., Jacob, D. J., Kumar, N., and Yantosca, R. M.: Regional visibility statistics in the United States: Natural and transbound-ary pollution influences, and implications for the Regional Haze Rule, Atmos. Environ., 40, 5405–5423, 2006.
Pincus, R., Barker, H. W., and Morcrette, J. J.: A fast, flexible, ap-proximate technique for computing radiative transfer in inho-mogeneous cloud fields, J. Geophys. Res.-Atmos., 108, 4376, doi:10.1029/2002jd003322, 2003.
Pinder, R. W., Adams, P. J., and Pandis, S. N.: Ammonia emission controls as a cost-effective strategy for reducing atmospheric par-ticulate matter in the eastern United States, Environ. Sci. Tech-nol., 41, 380–386, doi:10.1021/es060379a, 2007.
Pye, H. O. T., Liao, H., Wu, S., Mickley, L. J., Jacob, D. J., Henze, D. K., and Seinfeld, J. H.: Effect of changes in climate and emissions on future sulfate-nitrate-ammonium aerosol lev-els in the United States, J. Geophys. Res.-Atmos., 114, D01205, doi:10.1029/2008jd010701, 2009.
Raes, F., Liao, H., Chen, W. T., and Seinfeld, J. H.: Atmospheric chemistry-climate feedbacks, J. Geophys. Res.-Atmos., 115, D12121, doi:10.1029/2009jd013300, 2010.
Rap, A., Scott, C. E., Spracklen, D. V., Bellouin, N., Forster, P. M., Carslaw, K. S., Schmidt, A., and Mann, G.: Natural aerosol di-rect and indidi-rect radiative effects, Geophys. Res. Lett., 40, 3297– 3301, doi:10.1002/grl.50441, 2013.
Ridley, D. A., Heald, C. L., and Ford, B. J.: North African Dust Export and Impacts: An Integrated Satellite and Model Perspective, J. Geophys. Res.-Atmos., 117, D02202, doi:10.1029/2011JD016794, 2012.
Ridley, D. A., Heald, C. L., and Prospero, J. M.: What con-trols the recent changes in African mineral dust aerosol across the Atlantic?, Atmos. Chem. Phys. Discuss., 14, 3583–3627, doi:10.5194/acpd-14-3583-2014, 2014.
Rothman, L. S., Jacquemart, D., Barbe, A., Benner, D. C., Birk, M., Brown, L. R., Carleer, M. R., Chackerian, C., Chance, K., Coudert, L. H., Dana, V., Devi, V. M., Flaud, J. M., Gamache, R. R., Goldman, A., Hartmann, J. M., Jucks, K. W., Maki, A. G., Mandin, J. Y., Massie, S. T., Orphal, J., Perrin, A., Rinsland, C. P., Smith, M. A. H., Tennyson, J., Tolchenov, R. N., Toth, R. A., Vander Auwera, J., Varanasi, P., and Wagner, G.: The HITRAN 2004 molecular spectroscopic database, J. Quant. Spectrosc. Ra., 96, 139–204, doi:10.1016/j.jqsrt.2004.10.008, 2005.
Schaaf, C. B., Gao, F., Strahler, A. H., Lucht, W., Li, X. W., Tsang, T., Strugnell, N. C., Zhang, X. Y., Jin, Y. F., Muller, J. P., Lewis, P., Barnsley, M., Hobson, P., Disney, M., Roberts, G., Dun-derdale, M., Doll, C., d’Entremont, R. P., Hu, B. X., Liang, S. L., Privette, J. L., and Roy, D.: First operational BRDF, albedo nadir reflectance products from MODIS, Remote Sens. Environ., 83, 135–148, doi:10.1016/s0034-4257(02)00091-3, 2002. Schultz, M. G.: REanalysis of the TROpospheric chemical
compo-sition over the past 40 years Max Planck Institute for Meteorol-ogy, Julich/Hamburg, Germany, 2007.
Schwarz, J. P., Spackman, J. R., Gao, R. S., Watts, L. A., Stier, P., Schulz, M., Davis, S. M., Wofsy, S. C., and Fahey, D. W.: Global-scale black carbon profiles observed in the remote at-mosphere and compared to models, Geophys. Res. Lett., 37, L18812, doi:10.1029/2010gl044372, 2010.
Shindell, D. T., Faluvegi, G., Koch, D. M., Schmidt, G. A., Unger, N., and Bauer, S. E.: Improved Attribution of Climate Forcing to Emissions, Science, 326, 716–718, doi:10.1126/science.1174760, 2009.
Shindell, D. T., Lamarque, J. F., Schulz, M., Flanner, M., Jiao, C., Chin, M., Young, P. J., Lee, Y. H., Rotstayn, L., Mahowald, N., Milly, G., Faluvegi, G., Balkanski, Y., Collins, W. J., Conley, A. J., Dalsoren, S., Easter, R., Ghan, S., Horowitz, L., Liu, X., Myhre, G., Nagashima, T., Naik, V., Rumbold, S. T., Skeie, R., Sudo, K., Szopa, S., Takemura, T., Voulgarakis, A., Yoon, J. H., and Lo, F.: Radiative forcing in the ACCMIP historical and fu-ture climate simulations, Atmos. Chem. Phys., 13, 2939–2974, doi:10.5194/acp-13-2939-2013, 2013.
Sidran, M.: Broad-Band Reflectance and Emissivity of Specu-lar and Rough Water Surface, Appl. Opt., 20, 3176–3183, doi:10.1364/AO.20.003176, 1981.
Sinyuk, A., Torres, O., and Dubovik, O.: Combined use of satel-lite and surface observations to infer the imaginary part of re-fractive index of Saharan dust, Geophys. Res. Lett., 30, 1081, doi:10.1029/2002gl016189, 2003.
Smith, S. J. and Bond, T. C.: Two hundred fifty years of aerosols and climate: the end of the age of aerosols, Atmos. Chem. Phys. Dis-cuss., 13, 6419–6453, doi:10.5194/acpd-13-6419-2013, 2013. Spracklen, D. V., Mickley, L. J., Logan, J. A., Hudman, R. C.,
Yevich, R., Flannigan, M. D., and Westerling, A. L.: Im-pacts of climate change from 2000 to 2050 on wildfire ac-tivity and carbonaceous aerosol concentrations in the west-ern United States, J. Geophys. Res.-Atmos., 114, D20301, doi:10.1029/2008jd010966, 2009.
Spracklen, D. V., Jimenez, J. L., Carslaw, K. S., Worsnop, D. R., Evans, M. J., Mann, G. W., Zhang, Q., Canagaratna, M. R., Al-lan, J., Coe, H., McFiggans, G., Rap, A., and Forster, P.: Aerosol mass spectrometer constraint on the global secondary organic aerosol budget, Atmos. Chem. Phys. Discuss., 11, 5699–5755, doi:10.5194/acpd-11-5699-2011, 2011.
Stier, P., Seinfeld, J. H., Kinne, S., and Boucher, O.: Aerosol absorp-tion and radiative forcing, Atmos. Chem. Phys., 7, 5237–5261, doi:10.5194/acp-7-5237-2007, 2007.
Tegen, I. and Lacis, A. A.: Modeling of particle size distribution and its influence on the radiative properties of mineral dust aerosol, J. Geophys. Res.-Atmos., 101, 19237–19244, 1996.
Tegen, I., Werner, M., Harrison, S. P., and Kohfeld, K. E.: Rela-tive importance of climate and land use in determining present and future global soil dust emission, Geophys. Res. Lett., 31, L05105, doi:10.1029/2003gl019216, 2004.
Tsigaridis, K. and Kanakidou, M.: Secondary organic aerosol im-portance in the future atmosphere, Atmos. Environ., 41, 4682– 4692, 2007.
van der Werf, G. R., Randerson, J. T., Giglio, L., Collatz, G. J., Mu, M., Kasibhatla, P. S., Morton, D. C., DeFries, R. S., Jin, Y., and van Leeuwen, T. T.: Global fire emissions and the contribution of deforestation, savanna, forest, agricultural, and peat fires (1997– 2009), Atmos. Chem. Phys., 10, 11707–11735, doi:10.5194/acp-10-11707-2010, 2010.
van Donkelaar, A., Martin, R. V., Leaitch, W. R., Macdonald, A. M., Walker, T. W., Streets, D. G., Zhang, Q., Dunlea, E. J., Jimenez, J. L., Dibb, J. E., Huey, L. G., Weber, R., and Andreae, M. O.: Analysis of aircraft and satellite measurements from the Inter-continental Chemical Transport Experiment (INTEX-B) to quan-tify long-range transport of East Asian sulfur to Canada, At-mos. Chem. Phys., 8, 2999–3014, doi:10.5194/acp-8-2999-2008, 2008.
van Vuuren, D. P., Edmonds, J., Kainuma, M., Riahi, K., Thom-son, A., Hibbard, K., Hurtt, G. C., Kram, T., Krey, V., Lamarque, J. F., Masui, T., Meinshausen, M., Nakicenovic, N., Smith, S. J., and Rose, S. K.: The representative concentration pathways: an overview, Clim. Change, 109, 5–31, doi:10.1007/s10584-011-0148-z, 2011.
Wan, Z. M., Zhang, Y. L., Zhang, Q. C., and Li, Z. L.: Validation of the land-surface temperature products retrieved from Terra Mod-erate Resolution Imaging Spectroradiometer data, Remote Sens. Environ., 83, 163–180, doi:10.1016/s0034-4257(02)00093-7, 2002.
Wang, Q., Jacob, D. J., Fisher, J. A., Mao, J., Leibensperger, E. M., Carouge, C. C., Le Sager, P., Kondo, Y., Jimenez, J. L., Cubi-son, M. J., and Doherty, S. J.: Sources of carbonaceous aerosols and deposited black carbon in the Arctic in winter-spring: impli-cations for radiative forcing, Atmos. Chem. Phys., 11, 12453– 12473, doi:10.5194/acp-11-12453-2011, 2011.
Westerling, A. L., Hidalgo, H. G., Cayan, D. R., and Swet-nam, T. W.: Warming and earlier spring increase west-ern US forest wildfire activity, Science, 313, 940–943, doi:10.1126/science.1128834, 2006.
Wild, O., Zhu, X., and Prather, M. J.: Fast-j: Accurate simulation of in- and below-cloud photolysis in tropospheric chemical models, J. Atmos. Chem., 37, 245–282, doi:10.1023/a:1006415919030, 2000.
Yevich, R. and Logan, J. A.: An assessment of biofuel use and burn-ing of agricultural waste in the developburn-ing world, Global Bio-geochem. Cy., 17, 1095, doi:10.1029/2002GB001952, 2003. Yu, H., Kaufman, Y. J., Chin, M., Feingold, G., Remer, L. A.,
An-derson, T. L., Balkanski, Y., Bellouin, N., Boucher, O., Christo-pher, S., DeCola, P., Kahn, R., Koch, D., Loeb, N., Reddy, M. S., Schulz, M., Takemura, T., and Zhou, M.: A review of measurement-based assessments of the aerosol direct ra-diative effect and forcing, Atmos. Chem. Phys., 6, 613–666, doi:10.5194/acp-6-613-2006, 2006.
Zender, C. S., Bian, H. S., and Newman, D.: Mineral Dust Entrainment and Deposition (DEAD) model: Description and 1990s dust climatology, J. Geophys. Res.-Atmos., 108, 4416, doi:10.1029/2002JD002775, 2003.
Zhang, L. M., Gong, S. L., Padro, J., and Barrie, L.: A size-segregated particle dry deposition scheme for an atmospheric aerosol module, Atmos. Environ., 35, 549–560, 2001.
Zhang, L., Jacob, D. J., Knipping, E. M., Kumar, N., Munger, J. W., Carouge, C. C., van Donkelaar, A., Wang, Y. X., and Chen, D.: Nitrogen deposition to the United States: distribution, sources and processes, Atmos. Chem. Phys., 12, 4539–4554, doi:10.5194/acp-12-4539-2012, 2012.