HAL Id: halshs-02568219
https://halshs.archives-ouvertes.fr/halshs-02568219
Preprint submitted on 8 May 2020
HAL is a multi-disciplinary open access archive for the deposit and dissemination of sci-entific research documents, whether they are pub-lished or not. The documents may come from
L’archive ouverte pluridisciplinaire HAL, est destinée au dépôt et à la diffusion de documents scientifiques de niveau recherche, publiés ou non, émanant des établissements d’enseignement et de
Spatial dynamics of settlement pattern and cultivated
areas from Protohistory to Middle Ages: Comparative
approaches with spatial statistics indicators
Nicolas Poirier, Cristina Gandini
To cite this version:
Nicolas Poirier, Cristina Gandini. Spatial dynamics of settlement pattern and cultivated areas from Protohistory to Middle Ages: Comparative approaches with spatial statistics indicators. 2010. �halshs-02568219�
Spatial dynamics of settlement pattern and cultivated areas
from Protohistory to Middle Ages:
Comparative approaches with spatial statistics indicators.
N. Poirier*, C. Gandini**
* LEA ModelTer, CNRS USR 3124 MSHE C.N. Ledoux, Besançon, France ** CNRS UMR 8546 AOROC, ENS, Paris, France
Abstract: In the framework of the French Archaedyn program, the parallel works done on settlements networks and cultivated areas documented by off-site material collected during fieldwalking campaigns led to a crossed approach. Using indicators of spatial statistics like centroids and standard deviation ellipses permitted to measure the extent of spatial dynamics that affect the exploitation centres on one hand (weighted by their rank in the network) and cultivated areas on the other (depending on the density of ceramic collected). At each step, the definition of relative instead of absolute estimators allowed the development of a comparative approach made difficult by the long period taken into account. We reason as well in terms of mobility or stability, concentration or dispersion of the objects studied, depending on the local characteristics of the environment.
Keywords: Settlement, agrarian areas, spatial statistics, time-space dynamics, comparative approach
Introduction
The French Archaedyn project1, directed by F. Favory and L. Nuninger, is dedicated to
the study of territorial dynamics in the long term, especially regarding settlements and catchment’s areas identified by ceramic scatters discovered during fieldwalking campaigns.
The aim of the project is to delve deeper into the analysis of spatial interactions between social groups, the resources that they exploit to insure their subsistence, the manufacturing of objects and trade with other groups over a short, medium and long distance, and the itineraries which govern the flow at different periods. The objective is clearly to model the evolution of spaces which concern these occupations and activities, and to characterize, on the one hand, their rate of human influence and, on the other hand, the evolution of this human influence: modes of the agrarian conquest of space, growth and decline, eventually the abandonment of the occupation, types of activities, the consumption of what kinds of objects. With this aim, the objective is to specify the quantitative and qualitative indicators which enable us to measure territorial dynamics, their attractiveness, their skills, their relation to the social hierarchy as a factor of stimulation and economic development. It will then be possible to establish a typology of territories according to their evolution and in function of different fixed indicators, and to compare the different paths taken by these territorial types (Nuninger et al. 2008; Gandini et al. 2008)
The parallel works done on settlements networks (Gandini & Bertoncello 2008; Bertoncello et al. 2008) and cultivated areas (Poirier & Tolle 2008; Poirier et al. 2008) led to a crossed approach, allowing to measure the extent of spatial dynamics that affected the exploitation centres on one hand, and cultivated areas on the other, from the Iron Age to Middle Ages .
Methodological principles
In order to analyze the spatial pattern and the degree of dispersion of the archaeological features over the long term, with a common and simple index, we used the method of the mean centre and standard deviation ellipse.
This technical procedure developed one century ago belongs to the field of descriptive spatial statistics ((Lefever 1926). The principle of the mean centre (or barycentre, or centre of gravity) consists in summarising a seed point by calculating the geographical mean of the spatial entities studied, which can possibly be weighted. The centre of gravity is then “a useful reference for comparing several seed points in a same geographical area or even for comparing the position of the same seed points over time” (Pumain & Saint-Julien 2001). This method has already been used to this purpose in archaeology (Hodder & Orton 1976; Gauthier 2004; Gauthier 2005; Mordant et al. 2007). In our case, the innovative principle is to compare the mobility vs. stability of the centre of human activity based on several types of remains from these human activities.
After having summarized the available information on a single point, the second aspect of this descriptive spatial analysis consists in measuring the dispersion of the values around this index of central tendency, as the standard deviation shows the dispersion of values around a mean. The standard deviation ellipse applied in geography from the 1970's, is particularly helpful for comparative purposes (Raine 1978). It was used in our project to measure the dispersion of the values around the mean centre of each phase. The standard ellipse takes into account the anisotropy of the distribution, in other words, its deformation in one direction or another (Zaninetti 2005). The long axis of the ellipse indicates the direction of the greatest variability between the values. Naturally, the direction of this ellipse can be influenced by the very pattern of the study area.
In both thematics – settlements and agrarian areas –, the variations in the size of the standard deviation ellipses, from one phase to another, were the object of a simple rate of variation (t = ((Va – Vd) /Vd) * 100 where Va is the end value (or size) and Vd is the start value (or size)).
This standardization of measurements makes it possible to visualize on a single graph the variations of two chosen indices within different study areas (Saligny et al. 2008).
Settlement patterns
The aim of the workgroup dealing with “Settlement patterns” is to analyze the intensity, the stability and the modalities of rural settlement over the long term (from 800 BC to 800 AD) and at an interregional scale, since 12 study areas are concerned (Gandini & Bertoncello 2008 ; Bertoncello et al. 2008).
Settlement is considered here in a broad sense, such as it is defined in geography by R. Brunet, including as well dwellings as simply agricultural constructions. (Brunet et al., 1992: 229).
Comparison of several spatial distributions, under different historical and geographical contexts, is one of the difficulties faced by archaeological studies of settlement. By using these two indices, we aim at identifying the phases of extension or withdrawal and pinpointing the variations in the localization of the occupied areas.
The method was tested on five study areas, located in central and southern France, and the calculations concerned the settlements occupied between the 5th c BC and the 7th c AD,
that correspond at the most documented period in all the study areas. So, for each chronological period, the mean centre corresponds to the mean of the X and Y coordinates of the settlements, weighted by the hierarchical level of the settlements, such as it had been defined by an automatic classification (Bertoncello et al. 2008). This weighting was determined empirically after several tests. Thus, it doesn’t take into account only the quantitative change in the settlement but also its structural transformation. Effectively, the variations of the number of occupied sites do not have the same significance depending on the nature and the function of the settlements: small uninhabited agricultural buildings have different demographic and do not play the same role as the villas or farms.
The position of each mean centre has not interest in itself. That is interpretable and carries historical information is the displacement of the location of the barycentre over the long term. The period by period comparison of the displacements of the barycentre gives a first synthetic indicator of the distribution of habitat in a given space.
In order to compare the spatial dynamics in the different micro-regions, it was necessary to normalize the measurements of the mean centre's displacements. For this, we looked at the rate of variations in the mean centre localization per period, which can then be expressed in percentages and visualize on a graph. As mean centre localization for each period can be influenced by the size and shape of the study area, the measurement was related to the greatest possible distance within the study area. The greatest possible distance is easily obtained by drawing a rectangle on the dataset and by measuring the diagonal.
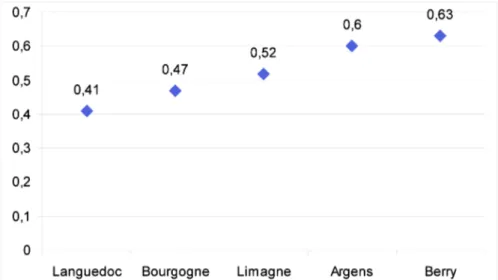
Figure 1: Indicator of general tendency of the stability / instability of settlement in 5 study-areas, between the 5thC BC and 7th C AD
It is the sum (in meters) of displacements of the mean centre, between each century, related to the largest possible distance (in meters as well). This approach is simple to implement and enables quickly to compare the trajectory of the study areas between them.
As shown on figure 1, the settlement evolution varies according to different rhythms and modalities from one region to another. The study area comparison shows that the spatial evolution of settlement in the Languedoc, between 5thC BC and 7th C AD, is the most stable,
while the Berry is the most unstable region.
Figure 2: Displacements of the settlement mean centre between the 5th c BC and the 7th c AD
(data: Languedoc: F. Favory, E. Fovet, L. Nuninger, Cl. Raynaud ; Limagne: D. Coin, B. Dousteyssier, F. Trément, M. Ségard ; calculation: C. Gandini)
The comparison of the 2 profiles of Eastern Languedoc (located in Transalpine Gaul) and Limagne (located in the Three Gauls) globally shows the same tendency, but with a more unstable evolution in the Limagne area, with important changes of localization from one period to another. On the contrary, in Languedoc, after a phase of mobility of the mean centres between the 5th and the 1st c BC, the localization of the settlement tends to stabilize during the roman period.
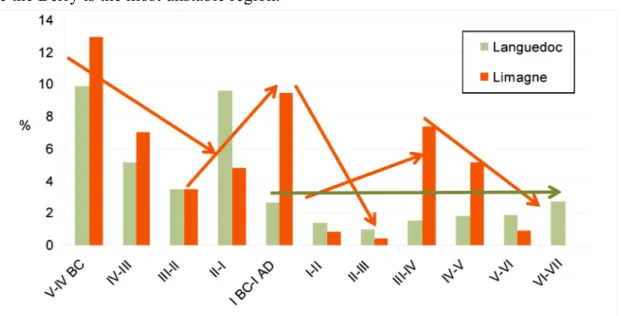
Figure 3: Changes in the standard deviation ellipse in the Languedoc and Limagne study areas between the 5th C BC and the 7th C AD.
(data: Languedoc: F. Favory, E. Fovet, L. Nuninger, Cl. Raynaud ; Limagne: D. Coin, B. Dousteyssier, F. Trément, M. Ségard ; calculation: C. Gandini)
The standard deviation ellipse expresses the dispersion of the settlements around the mean centre of each period. The more the ellipse is big and distended, the more the spatial and quantitative variability of the settlement pattern is important; on the contrary, a small ellipse contracted around the mean centre evidences the settlements concentration. The variations in the size of the standard deviation ellipse clarify the results of the mean centre analysis for Limagne and Languedoc:
- In Languedoc, between the 5th and 1st c BC, the ellipse alternates between phases of contraction and expansion, before stabilizing during the roman period,
- In Limagne, the ellipse is very narrow and stretched between the 5th and the 3rd c BC. It becomes wider in the 2nd c BC, expressing the phase of settlements’ creations in the 2nd c BC. This level is maintained until the end of the period, even if the ellipse tends to contract at the end of Antiquity, in relation to a drop in the number of occupied settlements.
These results obviously must be interpreted by combining them with the results of the other analyses, as the evolution curves. But this example already shows the utility of these two basic indices of spatial statistics for apprehending the spatio-temporal dynamics of settlement patterns and for making synthetic regional comparisons, whose aim is to identify common tendencies to local particularities which will have to be explained.
Agrarian manurings
In the context of the workgroup dedicated to “Catchment areas”, the calculation of the mean centres and the standard deviation ellipses was used with the goal of measuring the extent of the spatio-temporal mobility which affects the localization of the cultivated areas over time and to model the displacements and the dispersion of agrarian areas at each time step. The location of infield areas is assessed by the finding of off-site material during fieldwalking campaigns. This off-site material is interpreted as remain of manure. Manure collected in stables is supposed to have been mixed with domestic refuses before its spreading in cultivated fields. Interpreting off-site scatters as remains of manure practices is an idea now supported by most researchers interested in the history of landscape and settlements (Wilkinson 1982; Bintliff & Snodgrass 1988). This interpretation is based on several ancient texts which offer proof of this practice from Antiquity to the present (Oschinsky 1971). It is also based on recent examples of excavated structures used to prepare manure (Puig 2003) or manured zones identified by geochemical measurements, such as phosphates (Neil Rimmington 2000). Since the 2000s, many projects have been based on the study of time-space distribution of off-site material in order to approach past landscapes and territories (Nuninger 2002; Nuninger & Bertoncello 2010; Jones 2004). Analysing scatters of artefacts over the long term enables us to study the dynamics of arable spaces with precision, in terms of spatial variability and the quantitative investment of ancient societies within these spaces.
The application of mean centres to agrarian manuring was developed in the framework of a PhD thesis (Poirier 2007; Poirier 2010). The calculated mean centre is the centre of gravity of a point cloud formed by all of the centroids of the collection units of off-site artefacts at different periods. The localization of the seed point remains, of course, unchanged from one phase to another; what changes is the weighting of each point according to the density of off-sites artefacts collected in each area for each phase under consideration. The
mean centre is thus drawn towards the collection units which supplied the highest densities of off-site artefacts, those that are interpreted as having been the most intensely exploited during the chronological phase under study.
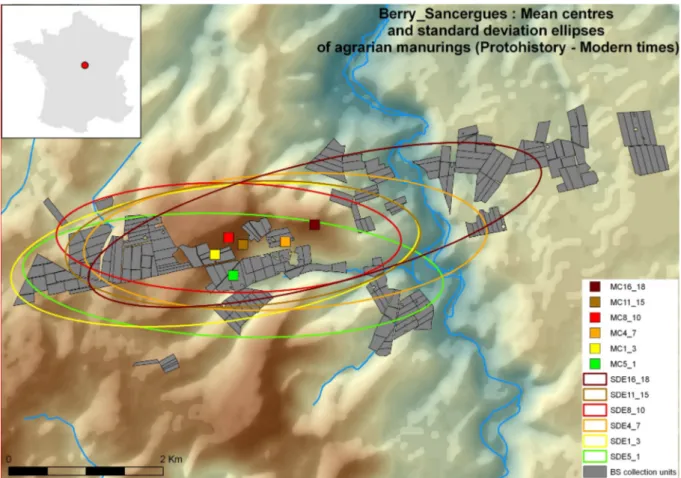
A different mean centre corresponds to each time step (or chronological phase); each mean centre is associated with a standard deviation ellipse whose size and orientation are also different (Figure 4). The measurement of the surface taken by each ellipse, and the observation of the variations in size of this ellipse from one phase to another can be interpreted as an index of the extension or the contraction of the intensely exploited areas. In practical terms, the more the ellipse is large and dilated, the more the spatial and quantitative variability of the manurings is important; on the contrary, an ellipse of a small size and restricted around the mean centre is a proof of the concentration of cultivated areas.
Figure 4: Study of agrarian manuring –Berry-Sancergues study area: Mean centre and dispersion
(Sources and map: N. Poirier)
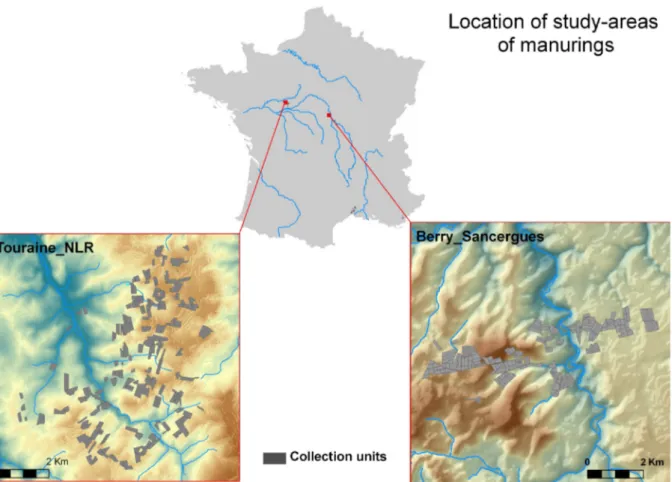
Two study-areas were integrated in the calculation of these spatial indices: The area around Sancergues (in Berry) and the area around Neuvy-le-Roi (in Touraine) (Figure 5).
Figure 5: Location of the study-areas of Berry_Sancergues and Touraine_NLR
(sources : Poirier 2007 ; Poirot 1998 ; map : N. Poirier)
To compare the dynamics between the two study areas, we also had to normalize the raw values of distance between the different mean centres. We choose to normalize it by the maximum possible distance within the extent of the study-area (i.e. the diagonal of the extent rectangle).
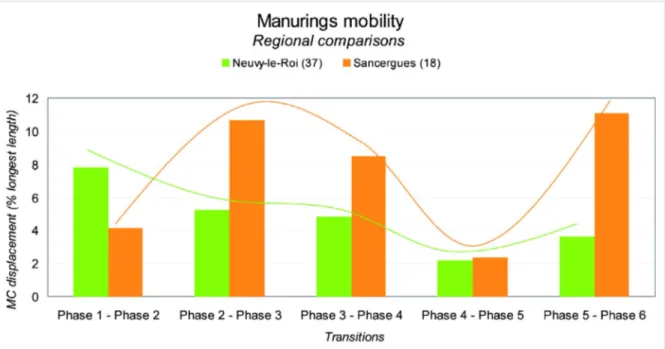
The variations of mean centres of the agrarian manurings within every micro-region draw rather different curves for each area (Figure 6). While the region of Sancergues presents a rather chaotic evolution, resulting from an alternation between phases of big mobility on spaces recently exploited and episodes of stabilization, the mobility curve of the agrarian spaces at Neuvy-le-Roi is much more regular. At Neuvy-le-Roi, the phase of the greatest mobility concerns the transition between the phase [5-1] and the phase [1-3]. The mean centre of manurings records then a movement of about 8 % of the biggest length of the study-area. This mobility decreases then regularly till the end of the Middle Ages (phase [11-15]). The transition between the phases [8-11] and [11-15] presents a mobility only of 2 %, equal besides in that recorded at Sancergues. The transition between late Middle Ages and modern period presents an increase of agrarian spaces’ mobility, the mean centre moving of about 4 %. This mobility is however much lower than that recorded in the region of Sancergues where the value of this movement exceeds the 10 %.
Figure 6: Dynamics of agrarian manurings in Sancergues (Berry, France) and Neuvy-le-Roi (Touraine, France)
Crossed approach: comparing the spatial dynamics of settlements and
agrarian areas.
Using the same indices of spatial statistics, the two workgroups opened up the way to cross the observations realized. It is to compare the dynamics of the settlements with that of their associated agrarian areas. In other words, are the rhythms of evolution of settlements patterns the same as those of cultivated areas?
But this ambition is confronted by a certain number of difficulties in particular related to the different resolutions of the processes observed:
First, spatial resolutions which do not always make it possible to compare evolutions readable on a local scale and others on a regional scale. That’s why the method is tested only on two study areas: Berry_Sancergues and Touraine_Neuvy-le-Roi, where settlements and agrarian areas were equally documented during fieldwalking campaigns and spatially overlap.
Second, temporal resolutions, determined in a large part by our capabilities to date archaeological objects. So, we will use the broad chronological phases of 3 or 4 centuries that are used to date agrarian manurings.
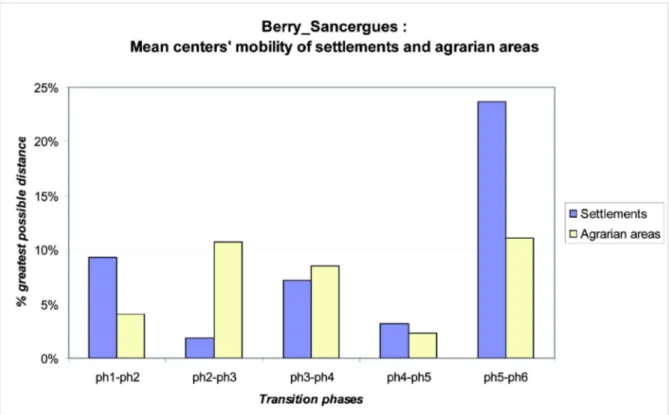
Figure 7: Mean centres' mobility of settlements and agrarian areas in Sancergues (Berry, France)
In Berry_Sancergues (Figure 7), the transition between Iron Age and Roman period shows a low mobility of agrarian manurings (4% of greatest distance), while the settlement network shows a bigger mobility (9%).
The transition between the roman times and the late Antiquity and very early middle ages shows a low mobility of the settlement network, because a lot of the occupied sites were created during the previous chronological phase. On the contrary, the agrarian manurings shows a great mobility of more than 10% of the greatest possible distance. This can be explained by the fact that the manurings were very centralized around occupied sites in the previous phase, on the contrary to the Late Antiquity, where manurings are more dispersed all around the study area, and not only in the immediate vicinity of the settlements.
The transition between the Late Antiquity and the Early Middle Ages shows a big mobility, both for settlement networks and agrarian manurings. Most of the occupied sites of this phase are new ones, as for the majority of the cultivated spaces. This transition is the one of the enhancement of new spaces of the study area.
Low values are observed for both settlements and manurings mobility during the transition between Early Middle Ages and Classical Middle Ages, essentially because we see a kind of stabilization of the settlements at the places that are still occupied today, while the agrarian space is organized around these settlements.
The greatest values of mobility are observed for the last transition, between Middle Ages and Modern Era, with a displacement of the mean centres of more than 10 and 20 % of the greatest possible distance, both for settlements and manurings. We know that this great mobility is related to the settling of new farms, exploiting completely new spaces in the Far East of the study area (Poirier 2010: 63).
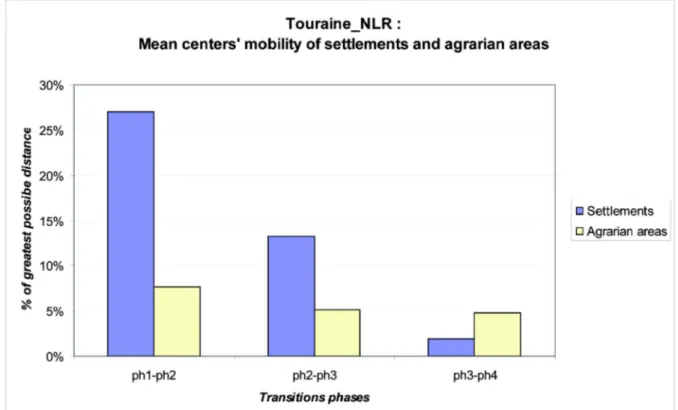
Figure 8: Mean centres' mobility of settlements and agrarian areas in Neuvy-le-Roi (Touraine, France)
The Touraine_NLR study area shows a general trend to the stabilization of both settlement pattern and agrarian spaces, characterized by a regular decrease of the mobility value of the mean centres (Figure 8). This can be explained by the observation of an early polarization of settlement and agrarian activities around the settlements that are still occupied today, proven by the medieval written sources (Poirot 1998). The great moving of the settlement's mean centre between phase 1 and 2 can be explained by a data bias related to the fact that only a single settlement was discovered for the Iron Age while proofs of agrarian activities for this phase were identified in the whole study area.
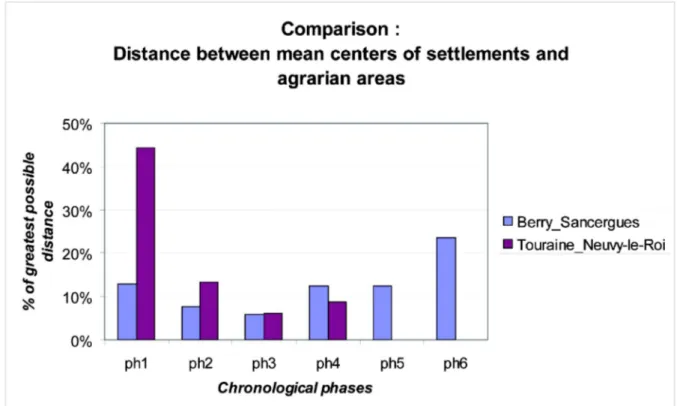
Figure 9: Distance between mean centres of settlements and agrarian areas in Berry_Sancergues and Touraine_Neuvy-le-Roi.
The observation of the distance separating the settlements' mean centre and the manurings' mean centre illustrates the disconnection between the archaeologically observed settlements pattern and spaces actually amended (Figure 9). This disconnection is high enough for phase 1 (Protohistory), decreases for phases 2 and 3 (Antiquity, Late Antiquity, early Middle Ages), and then increases steadily until the modern period (phase 6) where it is very strong in Berry_Sancergues (nearly 25% of the maximum possible distance within the study area).
Discussion
The steady increase of this disconnection is likely to be explained largely by the effect of sources. Indeed, the high values observed for phase 1 illustrate the difficulties in detecting protohistoric sites through their surface image which is often tenuous. Similarly, it should be noted that from the Middle Ages, even the early Middle Ages, the only archaeological image of the settlement pattern is certainly insufficient to accurately reflect all the points of settlement that had really existed. It should be possible to include in the analysis all the settlements that are mentioned in written sources and those that are currently still occupied, and implanted in these periods. It is not possible, because we can not precisely date the creation of these habitats, their first mention in written sources only providing a terminus ante quem.
Finally, spatial statistic indicators appear as interesting tools to develop comparative approaches: It allows a comparison between the dynamics of different kinds of archaeological
entities (settlements vs agrarian areas), and comparison of the dynamics over different micro-regions. The normalization of the raw values of mean centre's displacements permit to put all the areas at the same level, and then confront the rhythms of their development, and enhancement of new spaces. These spatial statistic indicators allow going further in spatial analysis, especially by evaluating biases and sources effects and re-introducing the spatial dimension in spatial analysis.
To go further, our aim will be to compute these spatial statistic indicators in each area under study, both for settlements and cultivated areas, in order to reconstruct the general dynamics of land use in the long term. Those rhythms will then be compared to determine global tendencies and local particularities, considering historical, geographical and natural contexts.
References
Bertoncello, F. et al., 2008. The spatio-temporal dynamics of settlement patterns from 800 BC to 800 AD in Central and Southern Gaul: models for an interregional comparison over the long term. In Gandini C., Favory F., Nuninger L. (eds.) 7 millenia of territorial dynamics: settlement pattern, production and trades,
from Neolithic to Middle Ages, Dijon, 23-25 juin 2008. Besançon: MSHE, pp. 141-154.
Bintliff, J. & Snodgrass, A., 1988. Off-site potery distributions: A regional and interregional perspective.
Current Anthropology, 29 (3), pp.506-513.
Gandini, C. & Bertoncello, F., 2008. Hierarchical Typology and Settlement Patterns Modelling at Interregional Scale. In A. Posluschny, A. Karsten, & I. Herzog, (eds.) Layers of Perception. Proceedings of the 35th
Computer Applications and Quantitative Methods in Archaeology Conference, Berlin, Germany, April 2-6, 2007 (Kolloquien zur Vor- und Frühgeschichte, vol. 10). Bonn: Habelt.
Gandini, C., Favory, F. & Nuninger, L. (eds.) 2008. 7 millenia of territorial dynamics : settlement pattern,
production and trades, from Neolithic to Middle Ages, Dijon, 23-25 juin 2008, Besançon: MSHE.
Gauthier, E., 2004. L'évolution de la consommation du métal à l'Âge du Bronze, en France orientale et en Transdanubie. The Development of Metal Consumption in eastern France and the Transdanube during the Bronze Age. Histoire et Mesure, 19 (3/4), pp.345-376.
Gauthier, E., 2005. Recherche d’une méthode d’analyse comparée des flux de métal à l’Âge du Bronze (XVII e -IX e s.) en France orientale et en Transdanubie. Utilisation et adaptation de la méthode des sommes focales. In F. Bertoncello et al. (eds.) Temps et espaces de l’homme en société, analyses et modèles
spatiaux en archéologie, actes des XXVe rencontres internationales d’archéologie et d’histoire d’Antibes, 21-23 octobre 2004. Antibes: APDCA.
Hodder, I. & Orton, C., 1976. Spatial analysis in archaeology, Cambridge.
Jones, R., 2004. Signatures in the soil: The use of pottery in manure scatters in the identification of medieval arable farming regimes. The Archaeological Journal, 161, pp.159-188.
Lefever, D., 1926. Measuring geographic concentration by means of the standard deviational ellipse. American
Journal of Sociology, 32, pp.89-94.
Mordant, C., Rottier, S. & Saligny, L., 2007. Dynamisme et espaces culturels. De la notion de mobilité au sein des populations, du Bronze moyen à l'étape initiale du Bronze final en France orientale (XV-XIIIe s. av. J.-C.). In H. Richard, M. Magny, & C. Mordant (eds.) Environnements et cultures à l'Âge du Bronze en
Europe occidentale, actes du 129e CTHS. Besançon, Paris: Editions du CTHS, pp. 143-157.
Neil Rimmington, J., 2000. Soil geochemistry and artefact scatters in Beotia, Greece. In M. Pasquinucci & F. Trément (eds.) The Archaeology of mediterranean landscape : Non-destructive techniques applied to
landscape archaeology. Oxford: Oxbow Books, pp. 190-199.
Nuninger, L., 2002. Peuplement et territoires protohistoriques du 8e au 1er s. av. J.-C. en Languedoc oriental
(Gard, Hérault). Besançon: Université de Franche-Comté. Available at:
http://tel.archives-ouvertes.fr/tel-00002981/fr/.
Nuninger, L. & Bertoncello, F., 2010. From Archaeological Sherds to Qualitative Information for Settlement Pattern Studies. In F. Niccolucci & S. Hermon, eds. Beyond the artefact – Digital Interpretation of the
Past - Proceedings of CAA2004 - Prato 13-17 April 2004. Budapest: Archaeolingua.
Nuninger, L., Favory, F. & Tourneux, P., 2008. From Archaeomedes to ArchaeDyn. In A. Posluschny, L. Karsten, & I. Herzog (eds.) Layers of Perception. Proceedings of the 35th Computer Applications and
Quantitative Methods in Archaeology Conference, Berlin, Germany, April 2-6, 2007 (Kolloquien zur Vor-und Frühgeschichte, vol. 10). Bonn: Habelt.
Oschinsky, D., 1971. Walter of Henley and other treaties on estate management and accounting, Oxford: Clarendon Press.
Poirier, N., 2007. Un espace rural en Berry dans la longue durée : expérience de micro-analyse des dynamiques
spatio-temporelles du paysage et du peuplement dans la région de Sancergues (Cher). Tours: Université
Poirier, N., 2010. Un espace rural à la loupe : paysage, peuplement et territoires en Berry de la Préhistoire à
nos jours, Tours: Presses Universitaires François-Rabelais, 232 p.
Poirier, N. et al., 2008. The time-space dynamics of agricultural areas from Antiquity to Modern times. In C. Gandini, F. Favory, & L. Nuninger (eds.) 7 millenia of territorial dynamics : settlement pattern,
production and trades, from Neolithic to Middle Ages, Dijon, 23-25 juin 2008. Besançon, pp. 81-94.
Poirier, N. & Tolle, F., 2008. Measurements of Diachronic Stability of Agrarian Exploitation. In A. Posluschny, L. Karsten, & I. Herzog (eds.) Layers of Perception. Proceedings of the 35th Computer Applications and
Quantitative Methods in Archaeology Conference, Berlin, Germany, April 2-6, 2007 (Kolloquien zur Vor-und Frühgeschichte, vol. 10). Bonn: Habelt.
Poirot, A., 1998. Neuvy-le-Roi (Indre-et-Loire), depuis ses origines jusqu'au XIXe siècle. Revue archéologique
du Centre de la France, 37, pp.139-178.
Puig, C., 2003. Du fumier à l'épandage, enrichir le sol en Rousillon entre les XIe et XIVe siècles ap. J.-C. In F. Favory & A. Vignot (eds.) Actualités de la recherche en Histoire et archéologie agraires: actes du
colloque AGER V, 19-20 septembre 2000. Besançon: Presses Universitaires Franc-Comtoises, pp. 67-78.
Pumain, D. & Saint-Julien, T., 2001. Les interactions spatiales, Paris: A. Colin.
Raine, J., 1978. Summarizing point patterns with the standard deviational ellipse. Area, 10 (5), pp.328-333. Saligny, L. et al., 2008. Models for territorial dynamics studies. In Gandini C., Favory F., Nuninger L. (eds.) 7
millenia of territorial dynamics : settlement pattern, production and trades, from Neolithic to Middle Ages, Dijon, 23-25 juin 2008. Dijon, pp. 25-44.
Wilkinson, T., 1982. The definition of ancient manured zones by means of extensive sherd-sampling techniques.
Journal of Field Archaeology, 9 (3), p.323–333.