HAL Id: hal-02489904
https://hal.archives-ouvertes.fr/hal-02489904
Submitted on 26 Jan 2021HAL is a multi-disciplinary open access archive for the deposit and dissemination of sci-entific research documents, whether they are pub-lished or not. The documents may come from teaching and research institutions in France or abroad, or from public or private research centers.
L’archive ouverte pluridisciplinaire HAL, est destinée au dépôt et à la diffusion de documents scientifiques de niveau recherche, publiés ou non, émanant des établissements d’enseignement et de recherche français ou étrangers, des laboratoires publics ou privés.
Micro-structuring the surface reactivity of a borosilicate
glass via thermal poling
Antoine Lepicard, Thierry Cardinal, Evelyne Fargin, Frédéric Adamietz,
Vinvent Rodriguez, K. Richardson, Marc Dussauze
To cite this version:
Antoine Lepicard, Thierry Cardinal, Evelyne Fargin, Frédéric Adamietz, Vinvent Rodriguez, et al.. Micro-structuring the surface reactivity of a borosilicate glass via thermal poling. Chemical Physics Letters, Elsevier, 2016, 664, pp.10-15. �10.1016/j.cplett.2016.09.077�. �hal-02489904�
1
Micro-structuring the Surface Reactivity of a
Borosilicate Glass via Thermal Poling
A. Lepicard 1,2, T. Cardinal 3, E. Fargin 3, F. Adamietz 1, V. Rodriguez 1, K. Richardson 2, M. Dussauze 1,*
*
marc.dussauze@u-bordeaux.fr
© 2016. This manuscript version is made available under the Elsevier user license http://www.elsevier.com/open-access/userlicense/1.0/
2
1
Université de Bordeaux, Institut des Sciences Moléculaires, UMR 5255 CNRS, 351 Cours de la Libération, 33405 Talence Cedex, France
2
Department of Materials Science and Engineering, College of Optics and Photonics, University of Central Florida, Orlando, FL, United States
3
Institut de Chimie de la Matière Condensée de Bordeaux, UPR 9048 CNRS, Université de Bordeaux, 87 avenue du Dr. Albert Schweitzer, 33600 Pessac Cedex, France
ABSTRACT: Thermal poling was proven successful to induce second order nonlinear
properties and concurrent modification of composition, structure and chemical reactivity in glasses. With current efforts to reduce devices sizes in components employing such attributes, means to control changes at the micrometer scale are needed. We present a micro-imprinting poling process to locally tailor surface properties of a glass. Measurements using infrared, Raman and second harmonic generation microscopies confirm that changes in glass structure associated with an induced static electric field are responsible for the enhanced surface reactivity that is successfully controlled at the micrometer scale.
Graphical abstract
3
New developments in integrated photonics, nanotechnology, lab-on-a-chip and other photonic applications require local control of the surface properties to develop “smart substrates”. Glasses are ideal materials for such applications as they have good optical properties and are easy to manufacture. Recently, we demonstrated modification of glass surface reactivity using thermal poling. 1 Specifically, we showed that it was possible, through careful selection of the parent glass composition, to induce a charged structure in the glass’ surface, yielding an enhancement of surface affinity towards atmospheric water.
Thermal poling is performed on a sample heated below its glass transition temperature. The temperature is high enough to increase the mobility of cations present inside the glass matrix. A strong DC electric field is then applied across the sample which induces charge dissociation at the anodic side of the poled glass. Upon thermal poling various types of charges are moving; their nature and role has been the center of many discussions in the literature and a complete description of the process is yet to be found. The process implying positive charge migration has been thoroughly described and is accepted by the community. Under the electric field, positive charges migrate towards the cathode. The process taking place is mainly a cationic conduction which involves sodium cation migration for the most part. Over time, a layer depleted of these cations is formed under the anodic surface. 2 For glasses containing more than one cationic specie, other cations also migrate and accumulate at the limit between the sodium depleted layer and bulk glass. 3, 4 If positive charge migration alone is taken into account, the static electric field building up at the anode quickly reaches value exceeding the dielectric breakdown. It is thus necessary to account for further compensation processes which are strongly dependent on the poling conditions, blocking versus non-blocking electrodes, and on the glass itself. If thermal poling is performed in non-blocking electrodes conditions, protons and water can be injected
4
inside the glass through the anode. 5, 6 When the treatment is performed under blocking anode conditions, only species present inside the glass matrix prior poling come into play during the process. Negative charges are thought to play a role in that process by migrating towards the anode. 7, 8 The nature and conduction mechanisms of these negative charge carriers are still unclear but several hypotheses have been suggested. Carlson first suggested that oxygen anions were forming and then migrate towards the anode where they would be neutralized. 9 This argument for the presence of an oxygen depleted layer has been proven true in several papers. 10, 11
Other studies have mentioned that molecular oxygen could be forming through oxidation of oxygen anions and that conduction was then taking place through the electrons release during oxidation. 7, 12, 13 However, other studies have suggested that the process also present a strong electronic contribution. 14-16 When the internal electric field reaches value close to the dielectric breakdown, the electronic charge carriers come into play and are no longer negligible, 4, 16, 17 formation of oxygen can then be accounted for through bond breakage and formation of peroxide radicals. Two of these peroxide entities would then react to form molecular oxygen. 18 All discussions agree that upon cooling charges are frozen inside the matrix, 19-21 inducing a strong static electric field in the glass, which can reach values up to 0.1-1 GV/m and be stable for years in some glass matrix. 22-24
The first use of thermal poling was for glass to metal sealing 25 but it was then found to be useful in nonlinear optics since the formation of the strong electric field effectively breaks the glass’ centrosymmetry. This process disrupts the glass’ initial isotropic nature inducing second-order nonlinear optical properties such as second harmonic generation (SHG) 22, 26 through an electro-optical effect called electric field induced second harmonic generation (EFISH). 23 More recently the poling-induced electric field itself has been proven useful for enhancing surface reactivity in
5
bioglasses and ceramics to promote bone growth and bonding. 27-29 Thermal poling has also been shown to enable control of a material’s properties at a micrometer scale. The process has been demonstrated to work up to submicronic scales by mean of patterned electrodes 30-34 but to date, only the optical properties and surface relief have been studied. In this letter we demonstrate that the surface reactivity of a borosilicate glass can be precisely controlled at the micrometer scale by use of patterned electrodes.
Borosilicate glasses of composition SiO2 39%, B2O3 51% and Na2O 10% were prepared as described elsewhere. 1 The glass slab was then cut in one-millimeter-thick samples which were optically polished. Glasses were visually inspected and showed no sign of inhomogeneity or phase separation.
A microscope glass slide with a 100 nm thick ITO layer deposited on it was used as the anode. The ITO layer was structured by laser ablation using a 1064 nm nanosecond yttrium aluminum garnet (YAG) laser. Various patterns were written on the surface by moving the sample with a motorized stage (X, Y) under the laser beam. AFM measurements performed in simple peak force taping mode, not presented here, show that the 100 nm thick ITO layer is entirely removed from the glass surface following laser ablation ensuring no electronic conductivity in these regions. Rectangles 40x60 μm2
were written on the ITO electrode as this dimension allows spatial mapping over this area using μ-SHG, μ-Raman and μ-IR spectroscopy.
The glass sample was put between the patterned electrode at the anode and a silicon wafer at the cathode and placed in the poling cell. The treatment took place in a nitrogen atmosphere and the sample was heated at 300°C. After 10 minutes, when a constant temperature was reached, a DC bias of 3000 V was applied across the sample for 30 minutes. The sample was then brought back to room temperature and only then the DC bias was removed.
6
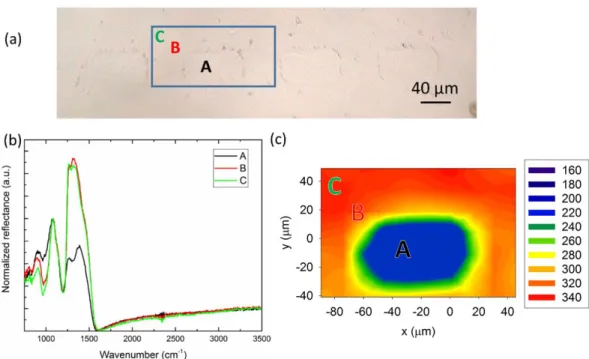
To prevent any reaction of the poled glass with the laboratory atmosphere, the cell was placed in a glove bag, filled with nitrogen, once the poling was performed. The sample was taken out of the poling cell and placed in a controlled atmosphere cell fitting under an optical microscope. To evaluate the efficiency of the thermal poling, the sample was first studied under an optical microscope to examine the patterned electrode’s transfer fidelity to the glass’ poled surface. The pattern is precisely transferred to the glass surface through the electrostatic imprint process taking place during poling, as observed on figure 1-(a). 35
It has been documented that an efficient thermal poling breaks the centrosymmetry of the glass by inducing a strong static electric field in the near anode surface. 22 This electric field contributes to SHG in the glass through the electro-optical effect EFISH mentioned earlier. To evaluate the effectiveness of the poling at the micrometer scale, we used a SHG microscope based on a modified micro-Raman spectrometer HR800 equipped with a 1064 nm picosecond laser, described elsewhere. 36 A SHG map of one of the rectangle imprinted on the glass surface was obtained with a 50x objective, using a radial polarized doughnut shaped beam profile that probes the longitudinal (along z) SHG contribution, Figure 1-b. It is important to define the referential in which our SHG measurements are made. In this article, in-plane components correspond to a signal located in the plane of the glass surface (x-y plane) while longitudinal components are perpendicular to the x-y plane, i.e. along the z-axis.
7
Figure 1. (a) Optical micrograph of a rectangle inscribed on the surface after poling, (b) corresponding µ-SHG map across the rectangle imprinted on the sample
The SHG active zone is spatially located around the rectangle. The maximum of intensity in the active zone is 10 times higher than the background measure inside the rectangle pattern. The intensity variation between the ITO-free area and the poled area and the location of the SHG active zone are in agreement with the literature. 37 These measurements however differ with our results previously published for niobium borophosphate glasses.38 In this other study, we could observe two contributions to the SHG signal with the longitudinal polarization that were located on each side of the edges of the patterns. In the case of the borosilicate glass presented here, the second contribution is not clearly observed. The second major difference with previous literature results is that the SHG active zone is present over distances as wide as 10 μm, while on the niobium borophosphate glasses, the signal was confined to spatial regions of less than 5 μm. The third major difference in our study is that components of the SHG signal in the plane of the substrate are not contributing as much to the SHG signal and have considerably lower intensities.
The SHG response as depicted on figure 1 is however clearly structured and is linked to an edge effects and a higher density of charges induced in the border of the patterns. In a classical thermal poling treatment, carried out without structured electrodes, the electric field is perfectly
8
perpendicular to the surface thus only giving a longitudinal and uniform intensity of the SHG across the poled surface. By removing strips of ITO on the electrode, a field enhancement phenomenon seems to be taking place by changing the charge density along the glass surface as well as promoting charge displacement not only along the z-axis but also in the x-y plane of the glass (the x-y plane being in the plane of the glass surface and the z axis going inside the sample). Along the patterned area, an increase of two order of magnitude in the charge concentration is observed, thus giving more trapped charges after poling and enhancing the SHG in these areas. 38 The in-plane poling contribution which should give the other contribution to the electric field is greatly related to the ITO-ablated area and to surface current formation. The overall SHG intensity is smaller in thermal poling of borosilicate glasses compared to borophosphate niobium glasses. The geometry of the electro-optical anisotropy induced in both glasses is different and it is possible that depending on the glass composition, surface currents responsible for this effect are accessible at different ranges in the structured areas. The area over which the electric field is going to be induced and structure would therefore be different, therefore leading to various thickness and intensity of the SONL active area.
To evaluate the departure/migration of sodium from the poled region, vibrational spectroscopy is suitable in this glass as sodium migration leads to a necessary re-arrangement of the glass matrix which greatly impacts the borate network. 1, 39 A µ-IR spectroscopic study was performed using a PerkinElmer Spotlight 400 spectrometer under air with a resolution of 4 cm-1 between 4000 and 750 cm-1 with a 1 cm-1 resolution. The borosilicate glass used here lies on the boric acid anomaly and its structure was fully described elsewhere. 1, 39, 40 Its glass network is made of reticulated silica tetrahedra and borate groups close to pentaborate entities. Every sodium added to the glass is present in the vicinity of a 4-coordinated boron tetrahedron acting as a charge compensator.
9
The remaining boron entities are 3-coordinated (where denotes a bridging oxygen) triangular units in rings and non-rings units.
Following thermal poling, µ-IR reflectance spectroscopy was used to probe the structural changes close to the glass’ surface inside and outside the patterns. An optical micrograph of several patterns imprinted on the glass is shown on part (a) of figure 2, as well as three individual spectra recorded on positions A, B & C, shown on the optical micrograph, and the corresponding IR-map showing the integrated area linked to triangular units asymmetric stretching mode [1200 and 1550 cm-1]distribution.
Figure 2. Optical micrographs of the surface (a), spectra taken on positions A, B & C on the optical micrographs and IR map (b) and corresponding micro-IR map taken on the blue rectangle presents on the optical micrograph, presenting the intensity distribution of the
band between 1200 and 1500 cm-1
(c)
All spectra presented in this figure were normalized to the intensity of the band peaking at 1075 cm-1, attributed to the asymmetric stretching vibrations of Q4silicon – oxygen tetrahedra, i.e. fully cross-linked SiO4 tetrahedra. 41-43 The band peaking at 910 cm-1 is attributed to the
10
asymmetric stretching vibrational mode of tetrahedra, i.e. a boron tetrahedron with a neighboring sodium cation to balance its charge. 39, 44 The boron network presents another contribution between 1250 and 1500 cm-1 that corresponds to an asymmetric stretching vibrational mode of triangular units in ring and non-ring configurations. 40 The IR spectrum taken inside the pattern, at position A, presents the same signature as the unpoled base glass, showing that poling was not effective in this area. Now looking at the IR spectra taken outside the patterns, positions B and C, on figure 2 (b) several changes should be highlighted. The most drastic change concerns the signature of the triangular units which, in addition to its large increase, goes from a double band to a single band. Simultaneously, the band of the tetrahedra decreases in intensity. The IR map (figure 1-c) taken on the highlighted blue rectangle of the optical micrograph (figure 1-a) shows the intensity distribution of the band around a pattern. It is observed that inside the pattern the contribution of this group is highly lowered compared to its surroundings. This map also shows that the structural change taking place in the poled region (outside the rectangle) is homogeneous while the region inside the rectangle is left unchanged.
Changes observed in the regions where thermal poling was effectively taking place can be directly linked to the departure of sodium cations towards the cathode. Absence of charge compensators in the vicinity of tetrahedra forces them to re-arrange into triangular units, thus forming a network close to pure B2O3 which have a single band in IR-spectroscopy. 1, 39
In the process it should be noted that the silica tetrahedra are not impacted by the poling.
The structural changes observed in in IR spectroscopy indicates the departure of sodium from the vicinity of the tetrahedra and indirectly indicates the formation of molecular oxygen. It is however difficult to conclude on the intermediate reaction and on the nature of the oxygen specie
11
during this process. Two hypothesis can be considered, (i) the creation of oxygen anions or (ii) the creation of peroxide radicals. The first possibility implies the breakage of a bonds and the formation of oxygen anions which recombine following a redox process to form molecular oxygen. The second possibility is the breakage of a or bond followed by the release of one electron and the formation of peroxide radicals which will then combine to form molecular oxygen. 18 In our case, we do not rule out any of these two possibilities but conclusions cannot easily be drawn and the question remains open.
As shown in our previous article, once poled, the formation of a new structure, associated with a strong internal electric field enhanced the glass’ reactivity towards atmospheric water. All measurements shown so far were carried out before the glass reacted with the laboratory atmosphere, either under controlled atmosphere or in air before any reaction. To evaluate the glass surface’s reactivity, the sample was let free to react with its surrounding environment until it started to show signs of reaction as observed previously. 1 One should keep in mind that the kinetic of this process is highly dependent on the humidity content of the laboratory and that this parameter is not controlled in this study.
12
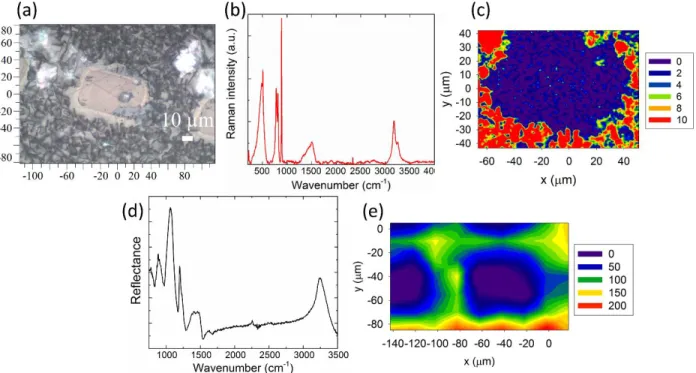
Figure 3. Optical micrograph of the glass surface after exposure to atmosphere (a), Raman spectrum taken outside of a pattern after exposure to atmosphere (b), Raman map recorded around the pattern presented on the optical micrograph, the intensity of the band of boric acid
peaking at 880 cm-1 was imaged (c), IR reflectance spectrum taken outside a pattern after exposure to atmosphere (d) and IR map recorded around four squares showing the distribution of the intensity of the integrated band of asymmetric stretching vibration of OH groups between
3000 and 3500 cm-1 (e)
Figure 3 focuses on the vibrational study of the surface after it reacted with the atmosphere. The top row shows the Raman vibrational study and the bottom row, the infrared study. The optical micrograph (figure 3-a) shows visible signs of reactivity with the appearance of dark spots on the surface of the glass. Part (b) of the figure presents a Raman spectrum recorded at the surface which presents fine peaks in addition to the broader contribution of the glass network. The borate network has two main active modes, at 770 and 805 cm-1, respectively corresponding to a triborate group with one and to triangular units in rings.45, 46 At lower wavenumbers, a large envelope can be attributed to mixed stretching and bending vibrations from the silicate network. 47 In addition to the mode of the glass, several contributions from boric acid, H3BO3, as seen previously in the literature, 1 are present. The bending mode of the O-B-O bound is
13
observed at 500 cm-1, the B-O symmetrical and antisymetrical stretching vibrational mode at 880 cm-1 and1384 cm-1 and the bending mode of B-OH bonds at1172 cm-1 are all present. The two last contributions at 3165 and 3251 cm-1 are attributed to O-H stretching vibrational modes. 48 Presence of boric acid is easily explained, as it is known that following the creation of the charged borate structure, atmospheric water is attracted to the surface of the glass, and then reacts with it through a leaching process to form boric acid. 1 Map (c) depicts the distribution of the integrated area under the main peak of boric acid at 880 cm-1. From this map, it can be observed that boric acid is only present outside the pattern. The intensity of the integrated band is null across the pattern while outside of it, it is more than an order of magnitude stronger. Boric acid is thought to be dissolved in water at the surface of the glass as it is known to be soluble in water even at room temperature. 49
Infrared reflectance spectroscopy (bottom row) allows further confirmation of the information observed with Raman spectroscopy. Spectra recorded in areas that have reacted with the atmosphere present a distinctly different signature from either the base glass or post-poled glass, illustrated in figure 3 – (d). A large contribution from asymmetric stretching vibration of OH groups is observed between 3000 and 3500 cm-1. The vibrations originating from the glass network are also changed with a large decrease of the triangular units. However, as a large water band is present in the spectrum, it is hard to draw conclusions on the glass network. Infrared reflectance measurements only probe the first few microns of a surface and the water band thus masks the contribution of the sub-surface glass network. Such a spectrum can only give valid information on the presence of water at the surface. A map of the distribution of this water band is shown on part € of figure 3. The infrared map was recorded on a larger zone to image four squares (one fully and the three others partially). Water presence is correlated to the
14
areas where changes occur upon poling while inside the patterns, no water signature is observed. The important information to remember from this IR-map is that inside the pattern, the OH band is null whereas outside of it, it strongly increases, thus showing the unique spatial selectivity of the surface reactivity enhancement imparted by the μ-poling process.
In conclusion, the use of a patterned electrode during thermal poling has been proven as an effective way to imprint spatially specific designs, control the location of the induced electric field, control the scale over which structural modifications take place and finally control the reactivity on a glass’ surface. It is also shown that with the use of patterned electrodes, an enhancement of the SHG signal at the border of the patterns is observed due to a confinement effect of the electric field. Moreover, as observed in infrared spectroscopy, the glass structure is efficiently modified at a micrometer scale around the pattern. A poling-induced charged surface structure was formed and tailored on a micrometric scale. The poled area also exhibited enhanced surface reactivity towards atmospheric water. This reactivity was only enhanced on the effectively poled area, corresponding to areas in close contact with ITO upon poling. These new results allow to foresee the use of a micro-poling technique to tailor physical and chemical properties of glasses and to use it for a variety of applications, ranging from photonics to lab-on-a-chip devices.
ACKNOWLEDGMENTS
This study has been carried out with financial support from the French State, managed by the French National Research Agency (ANR) in the frame of “the Investments for the future” Programme IdEx Bordeaux – LAPHIA (ANR-10-IDEX-03-02), and the French Aquitaine region [Grant 20121101025]. The authors (AL and KR) acknowledges the support of the National Science Foundation, award #DMR-1308946.
15
References
(1) Lepicard, A.; Cardinal, T.; Fargin, E.; Adamietz, F.; Rodriguez, V.; Richardson, K.; Dussauze, M. Surface Reactivity Control of a Borosilicate Glass using Thermal Poling. J.
Phys. Chem. C 2015, 119, 22999-23007.
(2) Carlson, D. E.; Hang, K. W.; Stockdale, G. F. Ion Depletion of Glass at a Blocking Anode - 1, 2. J Am Ceram Soc 1974, 57, 291-300.
(3) Lepienski, C. M.; Giacometti, J. A.; Leal Ferreira, G. F.; Freire Jr., F. L.; Achete, C. A. Electric Field Distribution and Near-Surface Modifications in Soda-Lime Glass Submitted to a Dc Potential. J. Non Cryst. Solids 1993, 159, 204-212.
(4) Zakel, J.; Balabajew, M.; Roling, B. On the Mechanism of Field-Induced Mixed Ionic-Electronic Transport during Electro-Thermal Poling of a Bioactive Sodium-Calcium Phosphosilicate Glass. Solid State Ionics 2014, 265, 1-6.
(5) Carlson, D. E. Anodic Proton Injection in Glasses. J. Am. Ceram. Soc. 1974, 57, 461-466. (6) Cremoux, T.; Dussauze, M.; Fargin, E.; Cardinal, T.; Talaga, D.; Adamietz, F.; Rodriguez, V.
Trapped Molecular and Ionic Species in Poled Borosilicate Glasses: Toward a Rationalized Description of Thermal Poling in Glasses. J. Phys. Chem. C. 2014, 118, 3716-3723.
(7) Dussauze, M.; Kamitsos, E. I.; Fargin, E.; Rodriguez, V. Structural Rearrangements and Second-Order Optical Response in the Space Charge Layer of Thermally Poled Sodium-Niobium Borophosphate Glasses. J. Phys. Chem. C 2007, 111, 14560-14566.
(8) Ziemath, E. C.; Araújo, V. D.; Escanhoela Jr., C. A. Compositional and Structural Changes at the Anodic Surface of Thermally Poled Soda-Lime Float Glass. J. Appl. Phys. 2008, 104. (9) Carlson, D. E.; Hang, K. W.; Stockdale, G. F. Electrode "Polarization" in Alkali-Containing
Glasses. J. Am. Ceram. Soc. 1972, 55, 337-341.
(10) Schmidt, B.; Nitzsche, P.; Lange, K.; Grigull, S.; Kreissig, U.; Thomas, B.; Herzog, K. In Situ Investigation of Ion Drift Processes in Glass during Anodic Bonding. Sens Actuators A
Phys 1998, 67, 191-198.
(11) Nitzsche, P.; Lange, K.; Schmidt, B.; Grigull, S.; Kreissig, U.; Thomas, B.; Herzog, K. Ion Drift Processes in Pyrex-Type Alkali-Borosilicate Glass during Anodic Bonding. J.
16
(12) Dussauze, M.; Rodriguez, V.; Velli, L.; Varsamis, C. P. E.; Kamitsos, E. I. Polarization Mechanisms and Structural Rearrangements in Thermally Poled Sodium-Alumino Phosphate Glasses. J. Appl. Phys 2010, 107.
(13) Dussauze, M.; Cremoux, T.; Adamietz, F.; Rodriguez, V.; Fargin, E.; Yang, G.; Cardinal, T. Thermal Poling of Optical Glasses: Mechanisms and Second-Order Optical Properties. Int.
J. Appl. Glass Sci. 2012, 3, 309-320.
(14) Krieger, U. K.; Lanford, W. A. Field Assisted Transport of Na+ Ions, Ca2+ Ions and Electrons in Commercial Soda-Lime Glass I: Experimental. J. Non Cryst. Solids 1988, 102, 50-61.
(15) Lipovskii, A. A.; Melehin, V. G.; Petrov, M. I.; Svirko, Y. P.; Zhurikhina, V. V. Bleaching Versus Poling: Comparison of Electric Field Induced Phenomena in Glasses and Glass-Metal Nanocomposites. J. Appl. Phys. 2011, 109.
(16) Mariappan, C. R.; Roling, B. Mechanism and Kinetics of Na+ Ion Depletion Under the Anode during Electro-Thermal Poling of a Bioactive Glass. J. Non Cryst. Solids 2010, 356, 720-724.
(17) Keller, K. J. Breakdown and Electric Conductivity of Glass. Physica 1951, 17, 511-530. (18) Redkov, A. V.; Melehin, V. G.; Lipovskii, A. A. How does Thermal Poling Produce
Interstitial Molecular Oxygen in Silicate Glasses? J. Phys. Chem. C 2015, 119, 17298-17307.
(19) Mukherjee, N.; Myers, R. A.; Brueck, S. R. J. Dynamics of Second-Harmonic Generation in Fused Silica. J Opt Soc Am B 1994, 11, 665-669.
(20) Alley, T. G.; Brueck, S. R. J.; Wiedenbeck, M. Secondary Ion Mass Spectrometry Study of Space-Charge Formation in Thermally Poled Fused Silica. J. Appl. Phys. 1999, 86, 6634-6640.
(21) Quiquempois, Y.; Godbout, N.; Lacroix, S. Model of Charge Migration during Thermal Poling in Silica Glasses: Evidence of a Voltage Threshold for the Onset of a Second-Order Nonlinearity. Phys. Rev. A 2002, 65, 438161-4381614.
(22) Myers, R.; Mukherjee, N.; Brueck, S. R. Large Second-Order Nonlinearity in Poled Fused Silica. Opt. Lett. 1991, 16, 1732-1734.
(23) Kazansky, P. G.; Russel, P. S. J. Thermally Poled Glass: Frozen-in Electric Field Or Oriented Dipoles? Opt.Commun. 1994, 110, 611-614.
(24) Dussauze, M.; Fargin, E.; Lahaye, M.; Rodriguez, V.; Adamietz, F. Large Second-Harmonic Generation of Thermally Poled Sodium Borophosphate Glasses. Opt. Express 2005, 13, 4064-4069.
17
(25) Wallis, G.; Pomerantz, D. I. Field Assisted Glass-Metal Sealing. J. Appl. Phys. 1969, 40, 3946-3949.
(26) Bethea, C. G. Electric Field Induced Second Harmonic Generation in Glass. Appl. Opt.
1975, 14, 2435-2437.
(27) Yamashita, K.; Oikawa, N.; Umegaki, T. Acceleration and Deceleration of Bone-Like Crystal Growth on Ceramic Hydroxyapatite by Electric Poling. Chem. Mater. 1996, 8, 2697-2700.
(28) Obata, A.; Nakamura, S.; Moriyoshi, Y.; Yamashita, K. Electrical Polarization of Bioactive Glass and Assessment of their in Vitro Apatite Deposition. J. Biomed. Mater. Res. A 2003,
67, 413-420.
(29) Nakamura, S.; Kobayashi, T.; Nakamura, M.; Itoh, S.; Yamashita, K. Electrostatic Surface Charge Acceleration of Bone Ingrowth of Porous Hydroxyapatite/ß-Tricalcium Phosphate Ceramics. J. Biomed. Mater. Res. A. 2010, 92, 267-275.
(30) Lipovskii, A. A.; Kuittinen, M.; Karvinen, P.; Leinonen, K.; Melehin, V. G.; Zhurikhina, V. V.; Svirko, Y. P. Electric Field Imprinting of Sub-Micron Patterns in Glass-Metal
Nanocomposites. Nanotechnology 2008, 19.
(31) Chervinskii, S.; Sevriuk, V.; Reduto, I.; Lipovskii, A. Formation and 2D-Patterning of Silver Nanoisland Film using Thermal Poling and Out-Diffusion from Glass. J. Appl. Phys.
2013, 114.
(32) Lipovskii, A. A.; Rusan, V. V.; Tagantsev, D. K. Imprinting Phase/Amplitude Patterns in Glasses with Thermal Poling. Solid State Ionics 2010, 181, 849-855.
(33) Redkov, A. V.; Melehin, V. G.; Statcenko, V. V.; Lipovskii, A. A. Nanoprofiling of Alkali-Silicate Glasses by Thermal Poling. J. Non Cryst. Solids 2014, 409, 166-169.
(34) Brunkov, P. N.; Melekhin, V. G.; Goncharov, V. V.; Lipovskii, A. A.; Petrov, M. I.
Submicron-Resolved Relief Formation in Poled Glasses and Glass-Metal Nanocomposites.
Tech. Phys. Lett. 2008, 34, 1030-1033.
(35) Takagi, H.; Miyazawa, S. -.; Takahashi, M.; Maeda, R. Electrostatic Imprint Process for Glass. Appl. Phys. Express 2008, 1.
(36) Rodriguez, V.; Talaga, D.; Adamietz, F.; Bruneel, J. L.; Couzi, M. Hyper-Raman Macro- and Micro-Spectroscopy in Materials: Towards High Quality Signals and Good Spatial Resolution. Chem. Phys. Lett. 2006, 431, 190-194.
(37) Yang, G.; Dussauze, M.; Rodriguez, V.; Adamietz, F.; Marquestaut, N.; Deepak, K. L. N.; Grojo, D.; Uteza, O.; Delaporte, P.; Cardinal, T.; Fargin, E. Large Scale Micro-Structured
18
Optical Second Harmonic Generation Response Imprinted on Glass Surface by Thermal Poling. J. Appl. Phys. 2015, 118.
(38) Dussauze, M.; Rodriguez, V.; Adamietz, F.; Yang, G.; Bondu, F.; Lepicard, A.; Chafer, M.; Cardinal, T.; Fargin, E. Accurate Second Harmonic Generation Microimprinting in Glassy Oxide Materials. Adv. Opt. Mater. 2016, , 929-935.
(39) Möncke, D.; Dussauze, M.; Kamitsos, E. I.; Varsamis, C. P. E.; Ehrt, D. Thermal Poling Induced Structural Changes in Sodium Borosilicate Glasses. Phys. Chem. Glasses: Eur. J.
Glass Sci. Technol. B 2009, 50, 229-235.
(40) Möncke, D.; Ehrt, D.; Varsamis, C. -. E.; Kamitsos, E. I.; Kalampounias, A. G. Thermal History of a Low Alkali Borosilicate Glass Probed by Infrared and Raman Spectroscopy.
Glass Technol. Part A 2006, 47, 133-137.
(41) Tenney, A. S.; Wong, J. Vibrational Spectra of Vapor-Deposited Binary Borosilicate Glasses. J. Chem. Phys. 1972, 56, 5516-5523.
(42) Bell, R. J.; Carnevale, A.; Kurkjian, C. R.; Peterson, G. E. Structure and Phonon Spectra of SiO2, B2O3 and Mixed SiO2B2O3 Glasses. J. Non Cryst. Solids 1980, 35-36, 1185-1190. (43) Kamitsos, E. I.; Patsis, A. P.; Kordas, G. Infrared-Reflectance Spectra of Heat-Treated
Sol-Gel-Derived Silica. Phys. Rev. B 1993, 48, 12499-12505.
(44) Kamitsos, E. I.; Patsis, A. P.; Karakassides, M. A.; Chryssikos, G. D. Infrared Reflectance Spectra of Lithium Borate Glasses. J. Non Cryst. Solids 1990, 126, 52-67.
(45) Konijnendijk, W. L. The Structure of Borosilicate Glasses, Eindhoven : Technische Hogeschool, 1975.
(46) Furukawa, T.; Fox, K. E.; White, W. B. Raman Spectroscopic Investigation of the Structure of Silicate Glasses. III. Raman Intensities and Structural Units in Sodium Silicate Glasses. J.
Chem. Phys. 1981, 75, 3226-3237.
(47) Brethous, J.; Levasseur, A.; Villeneuve, G.; Echegut, P.; Hagenmuller, P.; Couzi, M. Etudes Par Spectroscopie Raman Et Par RMN Des Verres Du Système B2O3 SiO2 Li2O. J. Solid
State Chem. 1981, 39, 199-208.
(48) Krishnan, K. The Raman Spectrum of Boric Acid. P. Indian Acad. Sci.A 1963, 57, 103-108. (49) Thomas, R. Determination of the H3BO3 Concentration in Fluid and Melt Inclusions in
Granite Pegmatites by Laser Raman Microprobe Spectroscopy. American Mineralogist
2002, 87, 56-68.