HAL Id: hal-00298226
https://hal.archives-ouvertes.fr/hal-00298226
Submitted on 9 Jun 2008HAL is a multi-disciplinary open access
archive for the deposit and dissemination of sci-entific research documents, whether they are pub-lished or not. The documents may come from teaching and research institutions in France or abroad, or from public or private research centers.
L’archive ouverte pluridisciplinaire HAL, est destinée au dépôt et à la diffusion de documents scientifiques de niveau recherche, publiés ou non, émanant des établissements d’enseignement et de recherche français ou étrangers, des laboratoires publics ou privés.
Influence of orbital forcing on the seasonality and
regionality of the Asian Summer monsoon precipitation
M. E. Hori, M. Abe, T. Yasunari, A. Kitoh
To cite this version:
M. E. Hori, M. Abe, T. Yasunari, A. Kitoh. Influence of orbital forcing on the seasonality and regionality of the Asian Summer monsoon precipitation. Climate of the Past Discussions, European Geosciences Union (EGU), 2008, 4 (3), pp.719-740. �hal-00298226�
CPD
4, 719–740, 2008 Influence of orbital parameter on the Asian monsoon M. E. Hori et al. Title Page Abstract Introduction Conclusions References Tables Figures ◭ ◮ ◭ ◮ Back Close Full Screen / EscPrinter-friendly Version Interactive Discussion Clim. Past Discuss., 4, 719–740, 2008
www.clim-past-discuss.net/4/719/2008/
© Author(s) 2008. This work is distributed under the Creative Commons Attribution 3.0 License.
Climate of the Past Discussions
Climate of the Past Discussions is the access reviewed discussion forum of Climate of the Past
Influence of orbital forcing on the
seasonality and regionality of the Asian
Summer monsoon precipitation
M. E. Hori1, M. Abe2, T. Yasunari3, and A. Kitoh4
1
Graduate School of Environmental Sciences, Nagoya University, Nagoya, Japan
2
National Institute for Environmental Studies, Tsukuba, Japan
3
Hydrosphere/Atmosphere Research Center, Nagoya University, Nagoya, Japan
4
Meteorological Research Institute, Tsukuba, Japan
Received: 3 April 2008 – Accepted: 18 April 2008 – Published: 9 June 2008 Correspondence to: M. E. Hori (mhori@hyarc.nagoya-u.ac.jp)
CPD
4, 719–740, 2008 Influence of orbital parameter on the Asian monsoon M. E. Hori et al. Title Page Abstract Introduction Conclusions References Tables Figures ◭ ◮ ◭ ◮ Back Close Full Screen / EscPrinter-friendly Version Interactive Discussion
Abstract
The response of Asian monsoon precipitation to contrasting orbital parameters is sim-ulated using the MRI-CGCM climate model. Results show that for the 125 kya B. P. ex-periment, a large continental heating due to obliquity forcing is apparent and accounts for the strengthened cross equatorial flow, stronger monsoon westerly over the
Ara-5
bian Sea, and an enhanced precipitation over the Indian subcontinent. For the 115 kya B. P. experiment, while the monsoon westerly becomes weaker in the Arabian Sea, the overall strength of the monsoon westerly becomes stronger in the Bay of Ben-gal. This eastward extension of the monsoon westerly converges with the equatorial trade wind to give rise to an increased precipitation over the maritime continent and
In-10
dochina peninsula. Such increase in precipitation is accompanied with an earlier onset of the Asian monsoon, and an earlier warming of the tropical SST due to precessional forcing. It is concluded that while the obliquity forcing creates the baseline land-sea contrast which maintains the Asian monsoon westerly, when such forcing is compara-bly weaker, the Indian monsoon is diminished and the precessional forcing becomes
15
more dominating to create a distinct earlier warming of the tropical SST which leads to an earlier onset of the maritime monsoon over the western Pacific. This study implies that even under weaker insolation forcing, the precessional signal may act to enhance certain regional precipitation and onset timing of the Asian monsoon.
1 Introduction
20
Understanding the monsoon variability of the past from paleoclimate records gives valuable information for projecting the future change in this highly populated region.
In the orbital timescales, past studies have shown that strong insolation accounts for increased precipitation in the Indian monsoon region (Prell and Kutzbach, 1992; Clemens et al., 1996). These studies show that the Asian monsoon is sensitive to both
25
relation-CPD
4, 719–740, 2008 Influence of orbital parameter on the Asian monsoon M. E. Hori et al. Title Page Abstract Introduction Conclusions References Tables Figures ◭ ◮ ◭ ◮ Back Close Full Screen / EscPrinter-friendly Version Interactive Discussion ships. Clemens et al. (1991) found strong coherence of Arabian Sea sediment record
with the precessional forcing and related them to the strength of cross-equatorial trans-port and release of latent heat over the monsoon region. Through a simple sensitivity experiment, Clement and Seager et al. (1999) also showed that the tropical ocean-atmosphere coupled system is sensitive to the precessional forcing due to interactions
5
with the altered seasonality to the El-Ni ˜no Southern Oscillation (ENSO).
Previous studies were mostly concerned with the summer Asian monsoon; however, the Asian monsoon itself has various sub regions with differing seasonality and charac-teristic precipitation patterns. The earliest onset of precipitation in the Asian monsoon is located over the Indochina peninsula during late April to early May, which is followed
10
by the onset over the Bay of Bengal, Indian subcontinent and southern China (Wang and Lin Ho, 2002).
Seasonality of the insolation has a strong impact on such monsoon seasonal evo-lution. Lestari and Iwasaki (2006) conducted two sensitivity experiments where SST seasonality is fixed at 1 April against the insolation seasonality and vise-versa. Their
15
result shows that land-sea heating contrast created primarily by the insolation forc-ing creates a heat-low surroundforc-ing the Eurasian continent and thereby formforc-ing the basic monsoon westerly flow. The SST seasonality with a fixed solar insolation acts to reduce the land-sea thermal contrast, but enhances the monsoon westerly via the strengthening of the Hadley circulation and effective angular momentum transport.
20
Changes in orbital parameter introduce not only an increase/decrease in the amount of solar radiation received during the monsoon season, but also the timing of the inso-lation forcing. In this study, the influence of orbital parameter on the seasonality and rationality of the Asian summer monsoon precipitation is examined using a coupled atmosphere-ocean general circulation model (AOGCM).
25
We selected two time periods from the late Eemian, the 115 kya B. P. and 125 B. P. for our sensitivity experiments. The two are notable periods in the earth’s past climate where the northern hemisphere insolation during summer was at its minimum (115 kya) and maximum (125 kya). The two periods have large difference in obliquity and nearly
CPD
4, 719–740, 2008 Influence of orbital parameter on the Asian monsoon M. E. Hori et al. Title Page Abstract Introduction Conclusions References Tables Figures ◭ ◮ ◭ ◮ Back Close Full Screen / EscPrinter-friendly Version Interactive Discussion opposite precessional signs, which is ideal for the present study (Cubasch et al., 2006).
2 Model experiment
2.1 Model explanation
The AOGCM used is the MRI-CGCM2.3.2b developed by the Meteorological Research Institute (Yukimoto et al., 2001). The resolution of the model is T42 in wave truncation
5
which is approximately 2.8◦
×2.8◦in longitude and latitude. There are 30 vertical levels in the model with a top at 0.4 hPa. The parameterization for deep moist convection is the Arakawa- Schubert scheme with prognostic closure.
The ocean model is a Bryan-Cox type general circulation model with a resolution of 2.5◦ in longitude and 2◦in latitude poleward of 12◦in both hemispheres. In the tropics,
10
the meridional resolution of the grid is higher in order to provide good resolution of equatorial oceanic waves. Heating of the ocean surface due to absorbed solar radiation is a constant of e folding at 10 m depth. The seasonality of the model is retained through a flux adjustment of heat and freshwater which is obtained from the spin-up run.
15
2.2 Experimental design
In order to quantify the effect of orbital forcing on the seasonality of the monsoon precip-itation, we performed two simplified sensitivity experiments, one with an orbital forcing of the 115 kya period BP and another with the 125 kya period BP (referred to as the 115 kya and 125 kya experiment in the following text).
20
The imposed orbital parameters are calculated from Berger (1991) and are sum-marized in Table 1. During the 125 kya period, the obliquity angle was greater and the longitude of perihelion was almost the opposite compared to the 115 kya period. Within the model experiments, the vernal equinox is fixed at 20 March, which causes
CPD
4, 719–740, 2008 Influence of orbital parameter on the Asian monsoon M. E. Hori et al. Title Page Abstract Introduction Conclusions References Tables Figures ◭ ◮ ◭ ◮ Back Close Full Screen / EscPrinter-friendly Version Interactive Discussion the perihelion to conincide with the boreal hemisphere summer for the 125 kya
exper-iment and coincide with the boreal winter for the 115 kya experexper-iment. This results in a large difference of seasonal cycle of insolation.
The amount of Greenhouse gas (GHG) concentration is constrained at the pre-industrial level of 280 ppm for CO2, 700 ppb for CH4, and 265 ppb for N2O following
5
the experiment setting of Cubasch et al. (2006). We did not use the historical recon-struction of GHG concentration for the particular time periods to constrain the model response to orbital forcing only. With the same rational, the sea level, continental ice-sheet, and vegetation distribution are all kept as the same as the present day control experiment.
10
The sensitivity experiment is branched off from a long-term spin-up run, which is then integrated for 60 years. The first 10 years of integration is excluded from the model run to let the surface mixed layer of the ocean to adjust to the new boundary conditions. The climatology of the last 50 years of integration is used for the rest of this study. Ideally, the ocean circulation should be stabilized through long-term integration.
15
However, for the purpose of this study, the change in boundary condition is weaker compared to other changes (such as inclusion of continental ice-sheets, or a change in coast lines), and a 10 year spin-up time is sufficient for the ocean mixed layer to relax towards the imposed orbital parameters. The model also exerts an interannual to decadal variability in the tropical ocean due to simulated El-Ni ˜no fluctuations, which is
20
effectively removed by taking a 50 year averaged climatology.
In addition, a long-term integration of the present-day control experiment is used as a reference to the two sensitivity experiments.
3 Results
Figure 1a shows the time series of July insolation at 15◦N based on the calculation of
25
Berger and Loutre (1991). Large difference of insolation can be seen in the Eemian interglacial period starting around 131 kya BP. The incoming radiation reaches a
max-CPD
4, 719–740, 2008 Influence of orbital parameter on the Asian monsoon M. E. Hori et al. Title Page Abstract Introduction Conclusions References Tables Figures ◭ ◮ ◭ ◮ Back Close Full Screen / EscPrinter-friendly Version Interactive Discussion imum of 496 W/m2 around 125 kya and shows a minimum value of 417 W/m2 around
115 kya. The 115 kya period coincides with the last glacial inception and the 125 kya period is known to correspond well with the warmest period in the Eemian glacial min-imum.
Figure 1b and c shows the simulated zonal averaged short-wave radiation at the
5
top of the atmosphere for the 115 kya and 125 kya experiment, respectively. The con-tour denotes the incoming solar radiation and the shading corresponds to the anomaly against the present-day control experiment. It can be seen that during the 115 kya period, negative anomaly in incoming radiation is largest in the boreal summer over northern hemisphere and in the boreal autumn for the southern hemisphere.
10
The absolute value of cooling (heating) anomaly in the 115 kya (125 kya) during bo-real summer is mostly a result of smaller (larger) obliquity angle of the earth’s rotation axis. On the other hand, the slant of the anomaly extending from the boreal summer to autumn corresponds to a shift in seasonality of the incoming radiation and is a result of the precession of the earth’s rotating axis. Due to these orbital effects, the meridional
15
gradient in incoming solar radiation becomes diminished (enhanced) in the 115 kya (125 kya) period.
There is also a notable change in seasonality of incoming radiation in the tropical area. During the 115 kya period, the tropics experiences an early anomalous heating in excess of 30 W/m2, which rapidly diminishes towards summer and autumn. The
20
situation is reversed in the 125 kya period where the tropical region experiences a decreased solar radiation of over 50 W/m2in the boreal winter and during the following spring, which rapidly changes to a positive anomaly in the summer. Such change in seasonality exists mostly in the tropical area, with the mid-latitudes sharing only a part of this this anomaly.
25
This feature becomes much clear in Fig. 2, where a cross-section of Fig. 1b and c is taken in a slab averaged over 20◦in latitude centered along 20◦N, the equator, and
20◦S for each sensitivity experiments. In the northern hemisphere mid-latitudes, the
CPD
4, 719–740, 2008 Influence of orbital parameter on the Asian monsoon M. E. Hori et al. Title Page Abstract Introduction Conclusions References Tables Figures ◭ ◮ ◭ ◮ Back Close Full Screen / EscPrinter-friendly Version Interactive Discussion same seasonality is shared for the 115 kya period but with a diminished peak value.
The shape of the seasonality is symmetric for the southern hemisphere where the solar radiation becoming a minimum in the boreal summer.
This seasonality changes drastically in the tropics. During the 115 kya period, the maximum in solar radiation occurs in the early spring and takes a minimum value in the
5
boreal summer. Seasonality for the 125 kya period is in strong contrast to the 115 kya period where the incoming radiation shows a minimum during the boreal winter and gradually increases towards early autumn where it becomes a maximum. This out-of-phase relationship in the insolation over the tropical region is mostly a result of the precession of the earth’s rotating axis, which has a large signal in the tropics.
10
Next, we examine the annual mean precipitation of the two experiments to access the effect of this altered seasonal evolution in insolation, which is shown in Fig. 3. The use of annual mean precipitation is meaningful in this case since any anomaly due to changes in orbital parameters tends to cancel out when it is averaged over the whole year, and an anomaly in annual precipitation is a result of the net effect of
15
altered seasonality of the imposed insolation. Over the Indian subcontinent, there is a strong negative anomaly in the 115 kya period and a strong positive anomaly in the 125 kya period. This corresponds to a diminished (enhanced) monsoon precipitation for the 115 kya (125 kya) period and is consistent with the findings of Prell and Kutzbach (1992).
20
On the other hand, a salient positive anomaly (note that the range in Fig. 3a is half that of Fig. 3b) over the maritime continent region of equ. −20◦N, 90–140◦E is
observed for the 115 kya period. In the 125 kya period experiment, a strong negative precipitation anomaly replaces this feature and the signal is reversed.
This alternation of anomaly in precipitation between the Indian monsoon and the
25
maritime continent region implies that in the absence of a strong Indian monsoon, the “maritime monsoon” over the tropical Southeast Asian monsoon becomes more dominant and vise-versa.
CPD
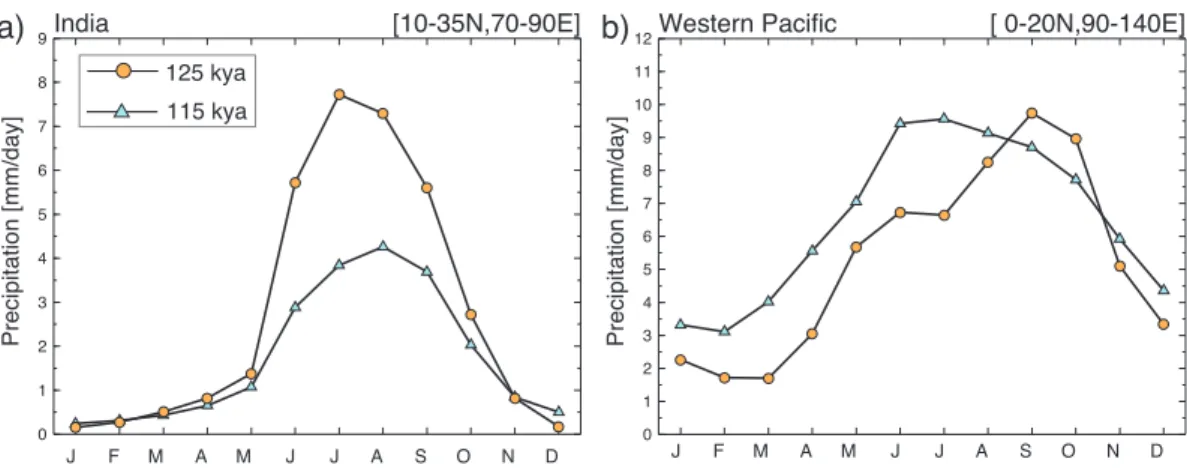
4, 719–740, 2008 Influence of orbital parameter on the Asian monsoon M. E. Hori et al. Title Page Abstract Introduction Conclusions References Tables Figures ◭ ◮ ◭ ◮ Back Close Full Screen / EscPrinter-friendly Version Interactive Discussion averaged precipitation for the Indian subcontinent region of 10–35◦N, 70–90◦E and the
western Pacific region of equ. −20◦N, 90–140◦E is summarized in Fig. 4. In the
In-dian monsoon region, the seasonal precipitation reaches a maximum during the boreal summer season. The precipitation is larger for the 125 kya experiment, which signifies the effect of increased continental heating due to increase of insolation. On the other
5
hand, the western Pacific region shows a shift in the monsoon season with an earlier onset of the monsoon in the 115 kya experiment. Also, precipitation is slightly higher for most months, which is indicative of an enhanced moisture convergence in the region throughout the year.
These two contrasting seasonality in precipitation can be explained by the fact that
10
the Indian subcontinent lies in the mid-latitudes where obliquity forcing is more domi-nating, whereas the western Pacific maritime continent is influenced more strongly by the change in the seasonality of insolation due to the precessional signal.
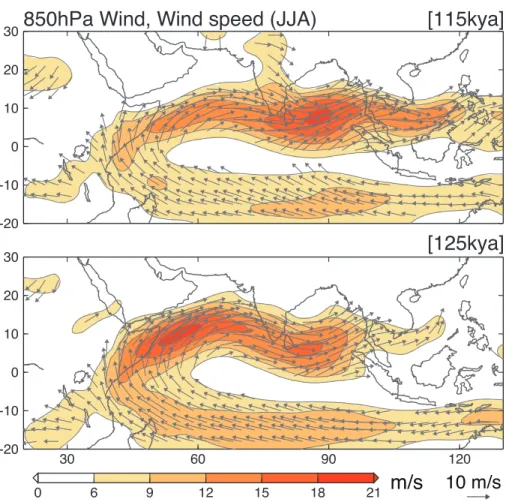
Changes in the structure of the Asians summer monsoon between the two sensitivity experiments are highlighted in the 850 hPa wind vector and scalar wind speed shown
15
in Fig. 5. In both figures, strong cross-equatorial wind flow and the monsoon westerly’s can be seen. However, while the region of maximum monsoon westerly can be seen in the Bay of Bengal around 5◦N, 80◦E for the 115 kya experiment, the 125 kya
ex-periment shows the maximum monsoon westerly near the Arabian sea around 10◦N,
50◦E. In the 125 kya experiment, the Somali jet is stronger than the 115 kya experiment
20
and a northern shift of the monsoon westerly near the Arabian Sea is notable.
Figure 6 shows the difference in vertically integrated moisture flux convergence with the 125 kya experiment subtracted from the 115 kya experiment. March to August aver-age is taken to account for the earlier monsoon onset of the 115 kya experiment as well as the summer monsoon season depicted in the 125 kya experiment. A positive
(neg-25
ative) value corresponds to a convergence of moisture in the lower troposphere in the 115 kya (125 kya) experiment. It can be seen that east to the maximum wind monsoon westerly region in Fig. 5, there is a strong convergence, which in turn corresponds to the anomaly of precipitation in Fig. 3. In the 115 kya experiment the monsoon westerly
CPD
4, 719–740, 2008 Influence of orbital parameter on the Asian monsoon M. E. Hori et al. Title Page Abstract Introduction Conclusions References Tables Figures ◭ ◮ ◭ ◮ Back Close Full Screen / EscPrinter-friendly Version Interactive Discussion does not converge over the Indian subcontinent but over the Bay of Bengal and the
maritime continent, whereas in the 125 kya experiment the monsoon westerly is much closer to the Arabian Peninsula and the convergence zone is located over the Indian subcontinent.
The reason for the strong cross-equatorial flow and monsoon westerly over the
Ara-5
bian sea in the 125 kya experiment can be explained by the strong land surface heating due to obliquity forcing. Figure 7 shows the difference in surface temperature between the 125 kya experiment and the 115 kya (in this case, the difference is calculated as the 125 kya experiment minus the 115 kya experiment for clarity) for the June to Au-gust season. Strong heating of the land surface in excess of 4◦C is discernable over
10
northern Africa, the Arabian Peninsula, and much of the mid-latitudes. This positive dif-ference in temperature is apparent in most of the lower troposphere (figure not shown) and corresponds to a stronger land-sea temperature gradient for the 125 kya experi-ment. Such temperature gradient is especially stronger over the coast of the Arabian Peninsula, where the location of land surface heating is nearer to the ocean, which
15
accounts for the maximum wind monsoon westerly in the Arabian Sea for the 125 kya experiment.
On the other hand, this signature becomes reversed in the 115 kya experiment that signifies a significant weakening of the heat-low over the continent and the monsoon westerly is displaced farther from the coastline.
20
In the absence of a strong continental heating due to obliquity forcing, the role of sea surface temperature (SST) becomes more evident in controlling the monsoon wind field. In Fig. 8, the SST seasonality and 850 hPa wind field for the latitudinal section of equ. −20◦N is shown. In the 115 kya experiment, the SST over the Arabian Sea
and the Bay of Bengal becomes higher during the boreal spring. Early onset of the
25
monsoon westerly is discernable as early as April and a strong convergence between the tropical trade wind can be seen in the 100–120◦E region. In contrast, the 125 kya
experiment shows a maturing of SST in the boreal summer and autumn. This large difference in SST seasonality is closely tied to the difference in tropical seasonality of
CPD
4, 719–740, 2008 Influence of orbital parameter on the Asian monsoon M. E. Hori et al. Title Page Abstract Introduction Conclusions References Tables Figures ◭ ◮ ◭ ◮ Back Close Full Screen / EscPrinter-friendly Version Interactive Discussion insolation shown in Fig. 2. The early warming of the SST in the 115 kya experiment
coincides with the maximum insolation during boreal spring.
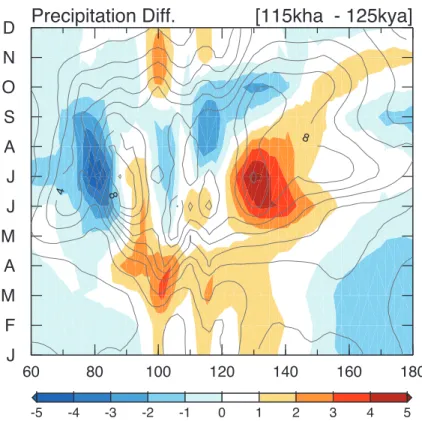
Figure 9 shows the difference of precipitation between the 115 kya experiment and 125 kya experiment for the 0–20◦N latitudinal section. The climatological precipitation
for the present day control run is shown in black contours as a reference. A positive
5
anomaly is located in the spring season around 100–140◦E, which corresponds to the
maturity of the SST beyond the 28.5◦C threshold in the 115 kya experiment (Fig. 8a).
A strong negative anomaly in the summer season near 80◦E and the positive anomaly
around 130◦E correspond to a stronger Indian monsoon precipitation and an absence
of precipitation over the western Pacific region for the 125 kya experiment.
10
4 Discussions and conclusion
In this study, the influence of orbital forcing on the seasonality of the Asian monsoon precipitation has been examined using two sensitivity experiments using the MRI-CGCM climate model. Simplified sensitivity experiments for the contrasting orbital parameters in the late Eemian period of 115 kya B. P. and 125 kya B. P. showed an
15
enhancement of the western Pacific maritime continent monsoon and a weakening of the Indian monsoon for the 115 kya experiment and a reversed signal for the 125 kya experiment.
Changes in the Indian monsoon is sensitive to the obliquity parameter which cre-ates a heating over the continent which drives a stronger cross-equatorial flow and a
20
maximum of monsoon westerly in the coast of the Arabian peninsula. In the absence of such obliquity forcing in the mid-latitudes, the monsoon westerly converges in the western Pacific region thereby enhancing the maritime monsoon precipitation. The enhancement of this maritime monsoon has a different seasonality than the obliquity forced Indian monsoon where the onset of precipitation is in the boreal spring.
25
Such maritime monsoon precipitation has a weaker sensitivity than the Indian mon-soon where the level of variability is roughly half of that of the Indian monmon-soon (see
CPD
4, 719–740, 2008 Influence of orbital parameter on the Asian monsoon M. E. Hori et al. Title Page Abstract Introduction Conclusions References Tables Figures ◭ ◮ ◭ ◮ Back Close Full Screen / EscPrinter-friendly Version Interactive Discussion Fig. 3). Thus the response of regional precipitation to changes in both the obliquity and
the precessional signal will become strongly non-linear.
In any case, the result of this study shows that there is strong possibility that the mon-soon seasonality will be shifted and the total amount of rainfall may be influenced due to the precessional parameter especially in the western Pacific and Indochina peninsula.
5
Most paleoclimate records do not retain any seasonality and only gives a representa-tive reference value for a given period of time. Results of this study shows that for a more detailed interpretation of such paleoclimate records, it may be suitable to take such changes in seasonality into account rather than assuming that all precipitation occurs during the boreal summer.
10
Since this is a simplified sensitivity experiment with no changes in GHG concentra-tions or changes in ice-sheet and vegetation distribuconcentra-tions, further studies are required to fully understand the contrasting effect of the obliquity and precessional parameters on the monsoon seasonality. Also, the monsoon variability and seasonality is strongly affected by the strength of the ENSO variability in the eastern tropics. The seasonality
15
of SST in the central to eastern Pacific is strongly influenced by the precessional pa-rameters (Fig. 8) which may have a strong impact on the simulated ENSO seasonality and its coupling with the Asian monsoon. These issues are to be addressed in the future using an LGM boundary condition to execute similar sensitivity experiments.
Acknowledgements. The authors thank Shukuro Manabe of Princeton University for his
en-20
couragement and discussions during the course of this study. O. Arakawa and S. Murakami of the Meteorological Research Institute provided technical assistance for the GCM experiments.
References
Berger A. and Loutre, M. F.: Insolation values for the climate of the last 10 million of years, Quaternary Sci. Rev., 104, 297–317, 1991.
25
Clemens, S. C., Murray, D. W., and Prell, W. L.: Nonstationary phase of the plio-pleistocene Asian monsoon, Science, 274(5289), 943–948, 1996.
CPD
4, 719–740, 2008 Influence of orbital parameter on the Asian monsoon M. E. Hori et al. Title Page Abstract Introduction Conclusions References Tables Figures ◭ ◮ ◭ ◮ Back Close Full Screen / EscPrinter-friendly Version Interactive Discussion
Clemens, S., Prell, W., Murray, D., Schimmield, G., and Weedon, G.: Forcing Mechanisms of the Indian-Ocean Monsoon, Nature, 353(6346), 720–725, 1991.
Clement, A. C., Seager, R., and Cane, M. A.: Orbital controls on the El Nino/Southern Oscilla-tion and the tropical climate, Paleoceanography, 14(4), 441–456, 1999.
Cubasch, U., Zorita, E., Kaspar, F., et al.: Simulation of the role of solar and orbital forcing 5
on climate, Particle Acceleration, Space Plasma Physics, Solar Radiation and the Earth’s Atmosphere and Climate, 37(8), 1629–1634, 2006.
Lestari, R. K. and Iwasaki, T.: A GCM study on the roles of the seasonal marches of the SST and land-sea thermal contrast in the onset of the Asian summer monsoon, J. Meteorol. Soc. Jpn., 84(1), 69–83, 2006.
10
Prell, W. L. and Kutzbach, J. E.: Sensitivity of the Indian Monsoon to Forcing Parameters and Implications for Its Evolution, Nature, 360, 647–652, 1992.
Wang, B. and LinHo: Rainy season of the Asian-Pacific summer monsoon, J. Climate, 15(4), 386–398, 2002.
Yukimoto, S., Noda, A., Kitoh, A., Sugi, M., Kitamura, Y., Hosaka, M., Shibata, K., Maeda, S., 15
and Uchiyama, T.: The New Meteorological Research Institute Coupled GCM (MRI-CGCM2) – Model Climate and Variability, Pap. Meteorol. Geophys., 51(2), 47–88, 2001.
CPD
4, 719–740, 2008 Influence of orbital parameter on the Asian monsoon M. E. Hori et al. Title Page Abstract Introduction Conclusions References Tables Figures ◭ ◮ ◭ ◮ Back Close Full Screen / EscPrinter-friendly Version Interactive Discussion Table 1. Orbital parameters for the sensitivity experiments. Orbital parameters are taken from
Berger (1991).
Obliquity Longitude of perihelion Eccentricity
115 kya BP 22.438 109.54 0.043983
CPD
4, 719–740, 2008 Influence of orbital parameter on the Asian monsoon M. E. Hori et al. Title Page Abstract Introduction Conclusions References Tables Figures ◭ ◮ ◭ ◮ Back Close Full Screen / EscPrinter-friendly Version Interactive Discussion [115kya] [125kya] 10 0 200 300 400 400 400 400 -60 -30 0 30 60 b) 90 -90 J F M A M J J A S O N D 100 200 300 400 400 40 0 400 50 0 -60 -30 0 30 60 c) 90 -90 J F M A M J J A S O N D -60 -50 -40 -30 -20 -10 0 10 20 30 40 50 60 W/m2 Latitude a) 420 440 460 480 500 0 20 40 60 80 100 120 140 Insolation
Time Before Present (kya)
115kya
125kya
Fig. 1. (a) Timeseries of July insolation at 15◦N. Units in W/m2, (b) Zonal mean averaged
sea-sonality of incoming short-wave radiation at the top of the atmosphere for the 115 kya B. P. ex-periment. Contours denote the insolation and shadings denote the anomaly from the present day control experiment, (c) Same as (b) but for the 125 kya B. P. experiment.
CPD
4, 719–740, 2008 Influence of orbital parameter on the Asian monsoon M. E. Hori et al. Title Page Abstract Introduction Conclusions References Tables Figures ◭ ◮ ◭ ◮ Back Close Full Screen / EscPrinter-friendly Version Interactive Discussion
a)
b)
c)
20N
equ.
20S
250 300 350 400 450 500 550 J F M A M J J A S O N D 350 400 450 500 250 300 350 400 450 500 550 115 kya 125 kyaFig. 2. Seasonality of insolation for the two sensitivity experiments averaged over the 20◦
CPD
4, 719–740, 2008 Influence of orbital parameter on the Asian monsoon M. E. Hori et al. Title Page Abstract Introduction Conclusions References Tables Figures ◭ ◮ ◭ ◮ Back Close Full Screen / EscPrinter-friendly Version Interactive Discussion Annual Precip. 125kya
[Anomaly from present] Annual Precip. 115kya
-10 0 10 20 30 60 90 120 150 180 -2.0 -1.6 -1.2 -0.8 -0.4 0.0 0.4 0.8 1.2 1.6 2.0 -10 0 10 20 30 -4.0 -3.0 -2.0 -1.0 0.0 1.0 2.0 3.0 4.0 units: mm/day
Fig. 3. Anomaly of annual precipitation from the present day control experiment for (a) the
CPD
4, 719–740, 2008 Influence of orbital parameter on the Asian monsoon M. E. Hori et al. Title Page Abstract Introduction Conclusions References Tables Figures ◭ ◮ ◭ ◮ Back Close Full Screen / EscPrinter-friendly Version Interactive Discussion India [10-35N,70-90E] a) Precipitation [mm/day] 0 1 2 3 4 5 6 7 8 9 J F M A M J J A S O N D
Western Pacific [ 0-20N,90-140E] b) Precipitation [mm/day ] 0 1 2 3 4 5 6 7 8 9 10 11 12 J F M A M J J A S O N D 115 kya 125 kya
Fig. 4. Seasonality of the precipitation for the two sensitivity experiments over (a) the Indian
subcontinent region of 10–35◦N, 70–90◦E, and (b) the western Pacific region of 0–20◦N, 90–
CPD
4, 719–740, 2008 Influence of orbital parameter on the Asian monsoon M. E. Hori et al. Title Page Abstract Introduction Conclusions References Tables Figures ◭ ◮ ◭ ◮ Back Close Full Screen / EscPrinter-friendly Version Interactive Discussion
850hPa Wind, Wind speed (JJA)
[125kya]
[115kya]
-20 -10 0 10 20 30 0 6 9 12 15 18 21 -20 -10 0 10 20 30 30 60 90 12010 m/s
m/s
Fig. 5. The June to August averaged 850 hPa wind vector and scalar wind speed for (a) the
115 kya B. P. experiment and (b) the 125 kya B. P. experiment. Vectors with wind speed less than 6 m/s is now drawn.
CPD
4, 719–740, 2008 Influence of orbital parameter on the Asian monsoon M. E. Hori et al. Title Page Abstract Introduction Conclusions References Tables Figures ◭ ◮ ◭ ◮ Back Close Full Screen / EscPrinter-friendly Version Interactive Discussion
Moisture Flux Convergence (Mar - Aug) [115kya - 125kya]
-10 0 10 20 30 40 60 90 120 150 180 -6 -5 -4 -3 -2 -1 1 2 3 4 5 6 x10⁻⁴
Fig. 6. Difference in convergence of the vertically integrated moisture flux averaged over March
through August. Positive (negative) value corresponds to a convergence of moisture for the 115 kya (125 kya) experiment.
CPD
4, 719–740, 2008 Influence of orbital parameter on the Asian monsoon M. E. Hori et al. Title Page Abstract Introduction Conclusions References Tables Figures ◭ ◮ ◭ ◮ Back Close Full Screen / EscPrinter-friendly Version Interactive Discussion Difference in Tsfc (JJA) [125kya - 115kya]
-10 0 10 20 30 40 50 0 30 60 90 120 150 -10 -8 -6 -4 -2 0 2 4 6 8 10 ˚C
Fig. 7. Difference in surface temperature for the June to August season. The difference is for
CPD
4, 719–740, 2008 Influence of orbital parameter on the Asian monsoon M. E. Hori et al. Title Page Abstract Introduction Conclusions References Tables Figures ◭ ◮ ◭ ◮ Back Close Full Screen / EscPrinter-friendly Version Interactive Discussion
[125kya]
60 80 100 120 140 160 180
SST, 850hPa Wind [115kya]
60 80 100 120 140 160 180 J F M A M J J A S O N D ˚C 25.0 25.5 26.0 26.5 27.0 27.5 28.0 28.5 29.0 29.5 30.0 5 m/s
Fig. 8. Seasonality of sea surface temperature (SST) and 850 hPa wind field averaged over the
equator to 20◦N latitudinal section. Wind vectors weaker than 6 m/s in scalar wind speed is not
CPD
4, 719–740, 2008 Influence of orbital parameter on the Asian monsoon M. E. Hori et al. Title Page Abstract Introduction Conclusions References Tables Figures ◭ ◮ ◭ ◮ Back Close Full Screen / EscPrinter-friendly Version Interactive Discussion
Precipitation Diff.
[115kha - 125kya]
60 80 100 120 140 160 180 4 8 8 J F M A M J J A S O N D -5 -4 -3 -2 -1 0 1 2 3 4 5
Fig. 9. Difference in precipitation between the 115 kya B. P. experiment and the 125 kya B. P.
ex-periment averaged over the equator to 20◦
C latitudinal section. Shades denote the difference. Black contours denote the climatological precipitation for the present day control run. Units in mm/day.