HAL Id: hal-00295976
https://hal.archives-ouvertes.fr/hal-00295976
Submitted on 10 Jul 2006
HAL is a multi-disciplinary open access
archive for the deposit and dissemination of
sci-entific research documents, whether they are
pub-lished or not. The documents may come from
teaching and research institutions in France or
abroad, or from public or private research centers.
L’archive ouverte pluridisciplinaire HAL, est
destinée au dépôt et à la diffusion de documents
scientifiques de niveau recherche, publiés ou non,
émanant des établissements d’enseignement et de
recherche français ou étrangers, des laboratoires
publics ou privés.
convection at mid-latitudes
Y. G. Choi, S. C. Lee, A. J. Mcdonald, D. A. Hooper
To cite this version:
Y. G. Choi, S. C. Lee, A. J. Mcdonald, D. A. Hooper. Wind-profiler observations of gravity waves
produced by convection at mid-latitudes. Atmospheric Chemistry and Physics, European Geosciences
Union, 2006, 6 (10), pp.2825-2836. �hal-00295976�
www.atmos-chem-phys.net/6/2825/2006/ © Author(s) 2006. This work is licensed under a Creative Commons License.
Chemistry
and Physics
Wind-profiler observations of gravity waves produced by convection
at mid-latitudes
Y. G. Choi1, S. C. Lee2, A. J. McDonald3, and D. A. Hooper4
1Geophysical Prospecting Laboratory, Seoul National University, Korea
2Department of Physics, Kangnung National University, Korea
3Department of Physics and Astronomy, University of Canterbury, Private Bag 4800, Christchurch, New Zealand
4Rutherford Appleton Laboratory, Chilton, Didcot, Oxon, OX11 0QX, UK
Received: 12 September 2005 – Published in Atmos. Chem. Phys. Discuss.: 1 November 2005 Revised: 21 April 2006 – Accepted: 12 June 2006 – Published: 10 July 2006
Abstract. This work presents a case study which includes
regions of large rapidly varying vertical velocities observed
by a VHF wind-profiler at Aberystwyth (52.4◦N, 4.1◦W).
Analysis indicates that this region is associated with gravity waves above the tropopause level and simultaneous regions of convective activity below the tropopause level. This case study also suggests that convective activity can be identified effectively by finding periods of large uncertainties on the de-rived velocities. These regions are hypothesized to be related to regions of small-scale inhomogeneity in the wind field.
Examination suggests that the large vertical velocity fluc-tuations above these convective regions are short period grav-ity wave packets as expected from theory. In addition the vertical flux of the horizontal momentum associated with the gravity waves also displays the pattern of reversal observed in previous studies.
1 Introduction
The aim of this work is to show a case study observed with wind profiler data from a mid-latitude site where convection has been identified as the probable cause of enhanced gravity wave activity and compare this measurement with previous observations and theory. Observations identified as convec-tive activity at mid-latitudes have previously been discussed in Hooper et al. (2005). As indicated in Hooper et al. (2005) a number of different signals are generally observed during pe-riods of atmospheric convection, these include large rapidly varying vertical velocities, large values of vertical spectral width and occasionally enhanced signal powers in the up-per troposphere. However, unusually during this event large vertical velocity perturbations are also observed above the
Correspondence to: A. J. McDonald
tropopause level. These enhanced vertical velocity perturba-tions above the tropopause are suggested to be internal grav-ity waves which seem likely to be generated by the underly-ing convection based on our analysis.
Several numerical modelling studies have displayed the importance of convectively generated gravity waves on the large scale circulation of the middle atmosphere (Song et al., 2003; Alexander and Holton, 2004). In particular, the im-portance of short period gravity waves which are preferen-tially produced by convection has been highlighted (Beres et al., 2002). These waves have been singled out because of the large vertical fluxes of the horizontal momentum associ-ated with these waves. In addition, Song et al. (2003) have indicated that more work is necessary to understand these waves’ impacts and generation mechanisms. The global im-portance of convective gravity waves has also been high-lighted by Tsuda and Hocke (2004) which reviewed a num-ber of studies using the GPS radio occultation technique. In particular, their study indicates that the gravity wave en-ergy in the stratosphere is largely enhanced over the region of active convection in the tropics, such as Indonesia, South America, and Africa, indicating that convection is the major source of gravity waves at low latitudes. This interpretation has also been supported by model studies (Alexander et al., 2002; Kawatani et al., 2003).
Convection and gravity waves associated with convection have previously been observed at tropical latitudes by wind-profilers, aircraft and radiosondes. The work in the tropics includes Vincent et al. (2004) which discusses observations of gravity waves made by a wind profiler during the Dar-win Area Wave EXperiment (DAWEX) campaign which are shown to be generated by convection. Alexander et al. (2000) used wind measurements from the ER2 aircraft in the strato-sphere to obtain information on the horizontal momentum flux carried by gravity waves. Their study compared the cloud top brightness temperature below the aircraft, which
is assumed to be an indicator of deep convective activity, with momentum flux data taken by the ER2 aircraft during the STEP project. Their work indicated a striking correla-tion between cold, high clouds and large wave momentum flux. Dewan et al. (1998) explained concentric circles ob-served in satellite data as gravity waves originating from iso-lated thunderstorms. Karoly et al. (1996) examined gravity wave activity associated with tropical convection detected in TOGA COARE sounding data.
Wind-profiler observations with some similarities to those indicated in Vincent et al. (2004) have also been discussed in Dhaka et al. (2002) using the Indian MST radar. In addi-tion work discussed in Dhaka et al. (2005) uses two days of continuous data acquired using the Equatorial Atmosphere Radar (EAR), Boundary Layer Radar (BLR), X-band radar, radiosonde and other co-located facilities to demonstrate the relationship between the evolution of strong convection and its role in forcing gravity waves that penetrate from the tro-posphere into the lower stratosphere. In addition another recent study at mid-latitudes has indicated a region of con-vection and examined the potential of convective mixing for exchanging air between the boundary layer and a region as-sociated with a tropopause fold (Reid and Vaughan, 2004). That study confirms that the convection interacts with the tropopause fold and potentially produces a subsequent mix-ing of stratospheric and tropospheric air. Sato et al. (1995) also display observations of convection which display en-hanced vertical velocities, in one case up to the tropopause
level. However, the magnitude of their vertical velocity
fluctuations is significantly smaller than those described in Hooper et al. (2005). The study by Sato et al. (1995) also displays possible wave generation from cumulus convection and possible absorption at a critical layer at higher altitudes. A number of previous studies have also focussed on the characteristics of waves produced by diurnal solar heating of the ground under fair weather conditions (Bohme et al.,
2004; Muschinski et al., 2001). The driving mechanism
is the impact of low-level convection on the stable top of the boundary layer. Such waves are thought to be ubiqui-tously spread in the horizontal. The maximum altitude to which the waves propagate has been observed to gradually increases during the course of the day, at a rate of the order of 1 km/hour, and wave activity tends to die off in the late afternoon.
As indicated previously, this study describes wind profiler observations which display large vertical velocity variability. These observations are suggested to be associated with pe-riods of strong convective activity which closely approaches the tropopause level defined by radiosonde and radar mea-surements and UK Met Office mesoscale model data. Our analysis suggests that the near-simultaneous enhanced verti-cal velocity perturbations above the tropopause are internal gravity waves generated by this convection. Section 2 de-scribes the Aberystwyth NERC MST radar and dede-scribes the processing scheme used on the raw data to derive the
obser-vations of interest. The obserobser-vations displayed are detailed in Sect. 3 and the interpretation of these observations is dis-cussed in Sect. 4.
2 Method
The Natural Environment Research Council (NERC) MST
radar at Aberystwyth (52.4◦N, 4.1◦W), described in
Vaughan (2002), operates at a frequency of 46.5 MHz and has a peak transmitted power of 160 kW. The radar beam has a one-way half-power half-width of 1.5 degrees and can be steered in sixteen possible directions. These include the vertical and at angles of 4.2, 6.0, 8.5 and 12.0 degrees off-vertical in a variety of azimuths.
This radar derives parameters from Doppler spectra us-ing a simple, sus-ingle-peak spectral processus-ing technique. The mean noise power spectral density (PSD) is first evaluated. The spectral limits of the signal are bound by those points at which the PSD, to either side of the peak PSD, first drops below the mean noise PSD. For strong signals, the limits are further restricted by identifying those points at which the PSD first drops to 0.01 of the peak PSD. The princi-pal spectral parameters of signal power, Doppler shift and spectral width are then calculated within these limits. In this study, zonal and meridional components of wind have been derived using beams at 6 degrees off-vertical in azimuths par-allel to the diagonals of the array and in the zenith direc-tion; measurements using two pairs of ±6 degree directions have also been used to derive estimates of the vertical flux of the horizontal momentum (Vincent and Reid, 1983). In the present study for each radar cycle observations were made twice in the vertical direction and once each at 6 degrees in the off-vertical in the south-west, north-west, north-east and south-east directions. This oversampling of the wind field al-lows the confidence intervals on the vertical velocity to be derived using the method described in Astin (1997). The confidence interval estimation uses the fact that to estimate three-dimensional wind vectors, three non-coplanar Doppler line-of-sight wind measurements are required. Therefore, the use of measurements in six radar beam directions allows two independent measurements of the wind vector. Alter-natively, the wind field is oversampled and the six measure-ments can be combined to give confidence intervals. Briefly, this method uses a least squares approach based on the geom-etry of the beam positions and a set of radial velocity mea-surements to determine the velocities in the cardinal direc-tions and their confidence intervals.
3 Results
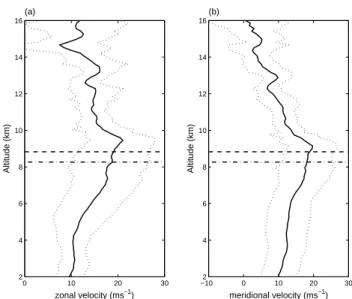
Observations of the mean vertical profiles of the zonal and meridional velocities averaged over 1 March 2003 are dis-played in Fig. 1. The spread of values at each altitude, as
represented by the standard deviation, is also displayed. Ex-amination of Fig. 1a shows that the mean zonal wind remains westerly at all altitudes. The variation of the mean zonal
wind is from 10 to 20 ms−1with a maximum around 9.5 km;
this maximum is associated with the edge of a jet which is located approximately 200 km to the south of Aberystwyth. The mean meridional wind displayed in Fig. 1b is southerly up to 16 km altitude and again has a maximum close to 9.5 km. It should be noted that the jet does not move signif-icantly relative to the position of Aberystwyth and thus the horizontal wind profile remains relatively similar throughout the day, the maximum variation is observed in the meridional
velocity which varies by about 10 ms−1 over the day, the
maximum velocity being observed at around 18:00 UT. The mean tropopause altitude, identified using the radar signal power structure using a method similar to that discussed in Gage and Green (1982), is located at 8.3 km. Examination of temperature data from UK Met Office mesoscale model runs has been used to derive the altitude of the thermal tropopause as 8.8 km. Comparison of these values suggest that there is a good correspondence between the tropopause height derived from the radar and the thermal data (also see Fig. 5). Close examination shows the zonal and meridional velocity pro-files above 12 km display fluctuations with a vertical wave-length of approximately 1.2 km which are associated with an inertia gravity wave. However, it is important to note that this gravity wave is not considered to be associated with the convection because of its long apparent period which means that this wave would not be observable at the location of the source (see Eq. 1).
Figure 2 displays time-altitude contour plots of the verti-cal velocity, the confidence interval on the vertiverti-cal velocity and the vertical signal power for observations on 1 March 2003. Examination of Fig. 2a shows a clear enhancement in the magnitude of the vertical velocities observed at around 13:20 UT. These enhancements are most obvious between 2 and 9 km. A smaller enhancement in the vertical veloc-ity field is also observed at around 14:00 UT at altitudes be-tween 2 and 6 km. Figure 2b shows simultaneous enhance-ments in the uncertainty on the vertical velocity using the confidence interval as the measure of uncertainty. The con-fidence intervals are used in this study because large val-ues can be used to indicate where the underlying assump-tion of local homogeneity in the Doppler Beam Swinging (DBS) technique used in the velocity estimation is no longer valid (Astin, 1997). Vincent et al. (2004) indicate that the horizontal scale necessary to produce such a heterogeneous wind field would be at the scale of the area subtended by the radar beam, which at 10 km altitude is roughly 1 km in the horizontal for the NERC MST radar, gravity waves with horizontal wavelengths this short seem unlikely and later ex-amination suggests that the horizontal wavelengths observed are significantly larger than this value. Work detailed in the recent study by Dhaka et al. (2005) also indicates that dur-ing convection, measurements of horizontal winds usdur-ing the
0 10 20 30 2 4 6 8 10 12 14 16 zonal velocity (ms−1) Altitude (km) (a) −102 0 10 20 30 4 6 8 10 12 14 16 meridional velocity (ms−1) Altitude (km) (b)
Fig. 1. Altitude profiles of mean zonal (a) and meridional (b) wind
velocity observed on 1 March 2003. The spread of values at each height, as represented by the standard deviation, is shown by dotted lines. Also shown are the mean tropopause altitude as derived from MST radar data (dash-dotted line) and UK Met Office mesoscale model temperature profiles (dashed line).
Equatorial Atmospheric Radar (EAR) when compared with radiosonde data showed errors of about 10 percent. Thus, this observation and previous work both suggest that the un-certainties derived could be used to identify regions associ-ated with convection.
The large uncertainties in the vertical velocity around 13:20 UT between 2 and 9 km are suggested to be related to a lack of local homogeneity in the wind-field which would be observed in a convective cell. Careful inspection also suggests that this inhomogeneity is not observed to such a great degree above the tropopause level. This strongly sug-gests that there is a fundamental difference between the ver-tical velocity perturbations below and above the tropopause level (around 8–9 km). In addition the increase of the Brunt-V¨ais¨al¨a frequency at the tropopause means that the vertical velocity variations significantly above the tropopause level are unlikely to be regions of convection. Thus, we believe that this suggests that the large vertical velocities in the tro-posphere are convective updrafts and downdrafts and those above the tropopause can not be interpreted in a similar man-ner.
Ancillary information from satellite and radiosonde soundings (not shown) suggests that the interpretation of the large vertical velocity fluctuations in the troposphere as con-vective signatures is valid. In particular, thermal infrared im-agery shows an approximately NW–SE aligned band of cloud which corresponds to the trailing edge of an occluded front approximately 600 km to the NE of the radar site. The posi-tion of this front shifts only slightly during the course of the
0:00 6:00 12:00 18:00 00:00 5 10 15 Altitude (km) (a) −1 −0.5 0 0.5 1 0:00 6:00 12:00 18:00 00:00 5 10 15 Altitude (km) (b) 0.5 1 1.5 0:00 6:00 12:00 18:00 00:00 5 10 15 Altitude (km) (c) 40 50 60
Fig. 2. Time-altitude contour plots of (a) vertical velocity (ms−1), (b) the confidence interval on the vertical velocity (ms−1) and (c) vertical signal power (dB) for the 1 March 2003 are displayed.
day and so the radar site was within the cold air sector be-hind the front throughout. Convective activity is confirmed by evidence of high-topped cumulus clouds in the AVHRR satellite imagery shown in Fig. 3. However, the convection observed by the VHF radar is associated with a trough which moved several hundred kilometres from west to east during the course of the day and which is responsible for the clouds covering much of the British Isles. Imagery suggests that the British Isles were virtually cloud free at 03:56 UT, but that low cloud was beginning to pass over the radar site at 09:58 UT, and higher cloud by 11:39 UT.
The period of the vertical velocity enhancements are also related to a period of particularly heavy surface rainfall
at Aberystwyth. A radiosonde launch at 05:00 UT on
1 March 2003 suggests that the atmosphere examined is close to instability and could easily produce localized convective activity later in the day. UK Met Office mesoscale unified model data has also been used to derive values of the Convec-tive Available Potential Energy (CAPE). Examination
sug-gests regions with values of CAPE greater than 500 Jkg−1
are observed close to Aberystwyth previous to the period of interest. It should be noted that because of the difficulty in
modelling the precise location and intensity of convection in mesoscale models this information is only indicative, but does confirm the expectation that the radar is observing a mildly convectively active region. Therefore this data is only used to indicate that the radar remains in the same air-mass in the remainder of this paper. Examination of thermody-namic data from a radiosonde at Camborne (approximately 270 km to the south of Aberystwyth) launched at 11:00 UT suggests that the depth of the layer in which condensation can release latent heat is approximately 5 km. Many previous modelling studies have also indicated the importance of the horizontal extent of the heating and the requirement to ade-quately represent the horizontal scale of the updrafts (Holton et al., 2002; Lane and Knievel, 2005). However, the ancillary information required to identify the horizontal extent of the heating is either of too low a horizontal resolution, for exam-ple the mesoscale model data is defined on a 12 km by 12 km gird, or is not available, in the case of UKMO weather radar data. Therefore it is not possible to identify this important criterion. However, a simple analysis based on the theory in-dicated in Holton et al. (2002) allows us to identify possible upper limits of this value in Sect. 4.
Fig. 3. Thermal-infrared satellite taken at 13:51 UT on 1 March
2003.
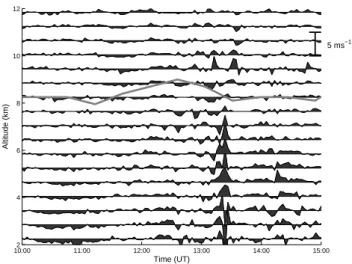
Figure 4 displays time series of the vertical velocity at a range of altitudes between 2 and 12 km. To ensure only good velocity estimates are utilized the velocity data related to low signal strengths are removed. Large vertical velocity fluctuations are observed throughout the period displayed in Fig. 4. At lower altitudes, between 2 and 8.5 km, at around 13:30 UT a particularly large updraft with a maximum
mag-nitude of 7.4 ms−1is observed. The updraft is followed by
a downdraft which is dominant up to approximately 4.5 km altitude. Above 4.5 km the updraft continues to be the domi-nant structure up to the tropopause level. The vertical veloci-ties above the tropopause are also enhanced in this period. However, the average magnitude of the vertical velocities is much smaller above the tropopause level and inspection shows clear periodic wave-like structure in the velocity data. In Fig. 4 the tropopause level is defined using the radar sig-nal power structure (Gage and Green, 1982). Examination suggests that the tropopause is poorly defined and is more variable in the region directly above the convective region. It is possible that this poor definition is associated with the mixing of stratospheric and tropospheric air at the top of the convective region since large spectral widths, these being re-lated to the eddy dissipation rate, are also observed. It should be noted at these high altitudes the Doppler spectra are gener-ally considered to be uncontaminated by precipitation echoes and can therefore be related to turbulence. Observations dis-cussed in Reid and Vaughan (2004) display similar observa-tions which highlight the impact that convection can have on stratosphere-troposphere exchange. It is also possible that any gravity waves produced by the convection could produce mixing around the tropopause level (Pavelin et al., 2002).
In addition to the structure identified below the tropopause level, several wave-like fluctuations are observed in the ver-tical velocity field well above the tropopause altitude. These wave-like structures which are observed to have very short periods, 45 min or below, seem likely to be triggered locally
10:002 11:00 12:00 13:00 14:00 15:00 4 6 8 10 12 Time (UT) Altitude (km) 5 ms−1
Fig. 4. Time series of the vertical wind velocity on 1 March 2003
from 2 to 12 km. A bar which displays the scale for the vertical velocity is shown along the right hand side in ms−1. The grey line on the figure indicates the level of the tropopause derived from radar data.
by the convective region. It should be noted that short pe-riod gravity waves are expected to be observed directly above convection based on theoretical considerations (Beres et al., 2002; Alexander and Holton, 2004). This is fundamentally associated with the fact that the intrinsic wave frequency de-termines the angle of wave propagation from the vertical:
ω
N =cos(θ ) (1)
where ω is the intrinsic frequency of the gravity wave, N is the Brunt-V¨ais¨al¨a frequency and θ is the angle from the vertical at which the wave propagates. Thus, Alexander and Holton (2004) indicates that the locally observed response to a convective heat source depends strongly on the distance of the observer from the source. In particular, an observer (or wind profiler) close to the source will see long vertical wave-length waves with high frequencies lasting for a short time, while further from the source the dominant vertical wave-length would be smaller and the frequency lower, the waves would arrive later, and they would persist longer. As indi-cated previously this paper is concerned with observations made by a wind-profiling radar, which observes variations in the three dimensional wind vector within a narrow col-umn above a fixed point on the ground. These instruments therefore are most sensitive to different portions of the wave spectrum based on their position relative to the wave source. The waves observed in this instance have short periods rel-atively close to the Brunt-V¨ais¨al¨a period. Such waves prop-agate primarily vertically and so are only observed close to their source.
The intrinsic frequency of the wave also determines whether or not the wave is able to propagate upwards through the atmosphere via several mechanisms, the most usual
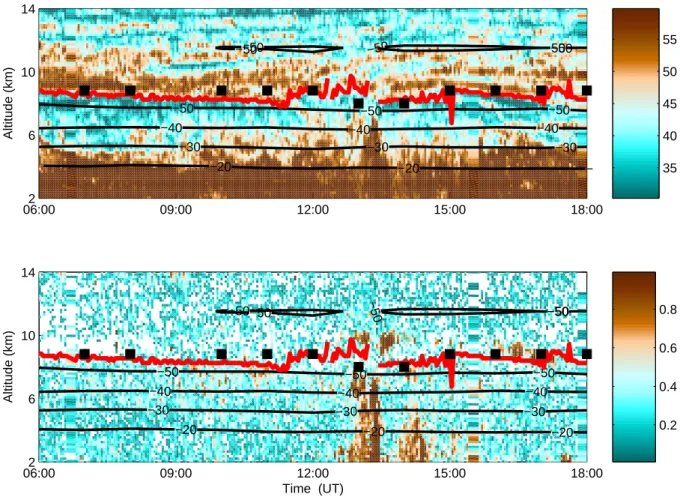
06:002 09:00 12:00 15:00 18:00 6 10 14 Altitude (km) −50 −50 −50 −50 −50 −50 −50 −50 −40 −40 −40 −30 −30 −30 −20 −20 − 35 40 45 50 55 06:002 09:00 12:00 15:00 18:00 6 10 14 Time (UT) Altitude (km) −50 −50 −50 −50 − 50 −50 −50−50 −40 −40 −40 −30 −30 −30 −20 −20 −20 0.2 0.4 0.6 0.8
Fig. 5. Time-height contour plots of (a) vertical signal power (dB) and (b) corrected spectral width (ms−1) measured by a VHF radar for 09:00 to 15:00 UT on 1 March 2003. Overplotted on each time-height plot are temperature contours (black lines) obtained from UK Met Office mesoscale Unified Model output over Aberystwyth. The values of tropopause altitude for each hour derived from UK Met Office data are also displayed as black squares. The tropopause altitude derived using radar data are displayed using a red line.
mechanism being critical level filtering (Fritts and Alexan-der, 2003, and references therein). Where waves are able to propagate vertically, they can have a significant effect on the momentum budget of the middle atmosphere. In principle modelling studies are a good way of capturing the details of the wave fields produced by convection since they can en-compass large spatial domains at high resolution. However, recent studies have shown that the scales of the waves ob-served depend on the horizontal resolution of the model used (Lane and Knievel, 2005). Horizontal grid spacings of the order of 1 km tend to produce gravity waves with horizontal wavelengths of around 20 km or greater, whereas horizontal grid spacings of the order of 100 m tend to produce gravity waves with horizontal wavelengths of around 5 km. Gravity waves which can propagate vertically in coarser resolution runs may become trapped in finer scale simulations. Obser-vational studies are therefore important for providing a truth against which model runs can be compared.
Comparison of the vertical signal power, displayed in Fig. 5a, with the temperature structure data suggests that
the tropopause level derived from the UK Met Office model data corresponds well to an enhancement in the vertical sig-nal power observed. The tropopause altitudes identified by both methods were located at heights between 7 and 9 km. The signature of the tropopause in the signal power can be attributed to the greater value of the Brunt-V¨ais¨al¨a fre-quency of the stratosphere relative to the troposphere (Gage
and Green, 1982). In addition the vertical signal power
data displayed in Fig. 5a shows a clear enhancement around 13:20 UT between 4 and 8 km. This enhancement could be due to a number of factors, but is one of the signatures of mid-latitude convection identified in Hooper et al. (2005). However, it is worth indicating that enhanced radar return signal power is the least commonly observed signature of convection and that Hooper et al. (2005) indicates that this is likely to be associated with the fact that this signature is only likely to be present when a strong contrast in humid-ity exists between the in-cloud and surrounding air. Careful comparison of the vertical signal power data with the verti-cal velocity data, shown in Fig. 2a, suggests that the region
of vertical velocity enhancement displays a greater altitudi-nal extent than the vertical sigaltitudi-nal power enhancement. This fact seems to suggest that the vertical velocity enhancements above and below the tropopause level may have a different character. This leads to the interpretation of large vertical ve-locities relating to a convective region up to the tropopause level overlaid by a region of enhanced vertical velocities which are more periodic in nature.
A time-altitude contour plot of the beam-broadening cor-rected spectral width is displayed in Fig. 5b. The clearest feature in this contour plot is a region of large corrected spec-tral widths which are coincident with the enhancement in the vertical signal power previously discussed. Under normal conditions the value of the corrected spectral width can be used as a measure of turbulent intensity. However, it should be noted that the interpretation of large spectral widths as regions of turbulence is not valid in areas associated with significant precipitation (Chu and Lin, 1994). Surface rain-fall data measured by an ARG tipping bucket rain gauge indicates particularly heavy precipitation at approximately
13:20 UT (20 mmh−1). Thus, it is not possible to
unambigu-ously identify this region as strong turbulence.
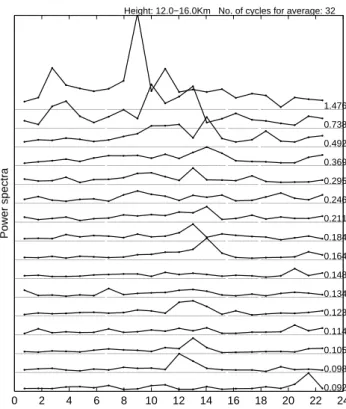
Based on the interpretation indicated above we have ap-plied a spectral approach to examine whether the periodic fluctuations in the vertical velocity field are more abundant above the convective region and to determine their dominant periodicity. The method utilized applies a Fast Fourier Trans-form algorithm to the vertical velocities in a 90 min segment and shifts the central time of the segment from the start to the end of the time series available. This method is repeated at altitudes between 12 and 16 km, the individual frequency spectra from the 90 min segments are then averaged to form a set of representative frequency spectra. The upper altitude of the height range used (16 km) was chosen because this is the highest altitude which contains reliable vertical veloci-ties without the need to interpolate the data. The lower alti-tude used (12 km) was selected in order to exclude the effect of the convective region itself by staying considerably above the local tropopause level. Figure 6 displays the power spec-tral density as a function of time for apparent periods rang-ing between 90 and 5 min. Examination of Fig. 6 suggests a number of regions where peaks in the power spectral den-sity are observed. The increase of the spectral power around the convective region indicates there are periodic fluctuations present, which coincide with the above hypothesis. Inspec-tion suggests apparent periods between 5 and 45 min are en-hanced during the convective period, with a peak at approx-imately 25 min. An enhancement in the power spectral den-sity with an apparent period between 90 and 45 min is also observed around 09:00 UT, but is not considered to be asso-ciated with convective generation.
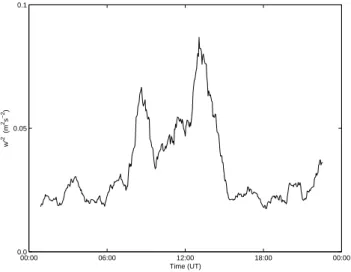
Both enhancements in the power spectral density observed in Fig. 6 can also be observed in an alternative form by cal-culating the mean vertical velocity variance as a function of time. It should be noted that the vertical wind velocity
0 2 4 6 8 10 12 14 16 18 20 22 24 0.092 0.098 0.105 0.114 0.123 0.134 0.148 0.164 0.184 0.211 0.246 0.295 0.369 0.492 0.738 1.476 Power spectra
Height: 12.0−16.0Km No. of cycles for average: 32
Fig. 6. Time-period plots of spectral power of vertical velocities
from 12–16 km using a Fast Fourier Transform. The highest curve represents low frequency (1.5 h, long period) and the lowest curve indicates high frequency (5 min, short period).
field rather than in the horizontal wind components are used because a number of studies using a range of observational techniques have indicated that short-period convective grav-ity waves can best be analyzed in the vertical wind velocgrav-ity field (Hauf, 1993; Hansen et al., 2002; Bohme et al., 2004). This result holds because the polarization relations (see Fritts and Alexander, 2003, and references therein) indicate that the perturbations in the horizontal wind will be relatively small for short period waves. The mean vertical velocity variance calculated over the altitude range 12 to 16 km is displayed in Fig. 7. Figure 7 displays bandpass filtered vertical velocity variance data. The bandpass filters used have lower and up-per limits of 6 and 60 min, respectively. Examination of the bandpass filtered data shows a distinct enhancement in activ-ity at around 13:30 UT, corresponding exactly to the convec-tive period observed below the tropopause level. This means the waves at around 13:30 UT have only short periods below 1 h. This result is expected given that similar enhancements at short periods at around 13:30 UT were observed in Fig. 6. A secondary maximum at around 09:00 UT is also observed. The time variation of the vertical fluxes of horizontal mo-mentum above the tropopause level has been calculated us-ing data from two pairs of oppositely directed radar beams which are directed 6 degrees off the vertical (Vincent and Reid, 1983). The momentum flux has been calculated for
00:00 06:00 12:00 18:00 00:00 0.0 0.05 0.1 Time (UT) w ′ 2 (m 2s −2 )
Fig. 7. Averaged vertical velocity squared plots averaged over the
altitude range 12–16 km. The vertical velocity used in this figure has been passed through a bandpass filter which has lower and upper boundaries of 1 h and 6 min, respectively.
90 min periods of data and averaged across 1.5 km. It should be noted that because the method is based on a statistical method, many data points are needed to minimize the statis-tical fluctuations. In an attempt to remove the effect of the inertia gravity wave previously discussed and displayed in Fig. 1 we have again applied a band-pass filter to the veloc-ities when using the Vincent and Reid (1983) method. The results are shown in Fig. 8. The calculation of the vertical flux of the horizontal momentum is made between 12.7 and 14.2 km above the local tropopause level. A more limited al-titude range than that used in the previous analysis has been used because the momentum flux was observed to be highly impacted by outliers in the data. It should be noted that the outliers present were generally observed in the horizontal velocity perturbations. The greater error in the horizontal component is associated to the fact that these values require Doppler shifts from the off-vertical beams in their determi-nation and the signal to noise ratios observed in these beams is significantly poorer than those observed at the same alti-tude by the vertical beam. Below the tropopause level, very large momentum fluxes around the convection region are ob-served. However, it should be noted that these momentum fluxes will have very large uncertainties because of the large uncertainties in the component velocities (see Fig. 2b). In addition, it should be noted that this analysis is not discussed for observations below the tropopause level because of the difficulty of separating any gravity wave perturbations from the convective activity. Vincent et al. (2004) notes this prob-lem with this type of study.
Examination of the horizontal momentum data above the tropopause level, displayed in Fig. 8, suggests that an en-hanced region is observed during the convective period. Close inspection also indicates that the horizontal
momen-0 2 4 6 8 10 12 14 16 18 20 22 24 10 12 14 16 18 20 13.42Km 0.1m2/s2 (EW) 0.1m2/s2 (NS)
No. of interval: 32 No. of increase: 5 Height: 12.7 to 14.2Km
Selected period for summation: 6.0 − 45.0 min
Time (UT)
Altitude (Km)
Fig. 8. Vector plots of the time variation of the horizontal
mo-mentum using the method discussed in Vincent and Reid (1983) on 1 March 2003. The momentum fluxes are averaged over altitudes from 12.7 to 14.2 km.
tum vector changes direction from northward to southward between 13:00 and 14:00 UT. A similar sign change in hor-izontal momentum has previously been observed using ER2 aircraft observations by Alexander et al. (2000) during peri-ods associated with convective gravity waves. The vertical flux of horizontal momentum thus also shows evidence of the existence of gravity waves related to convection. The in-crease of the magnitude of the momentum flux and its change of sign also suggest that there should be waves propagating around this region.
4 Discussion
Vertically propagating gravity waves generated by convec-tion are known to provide an important contribuconvec-tion to the momentum budget of the middle atmosphere (Song et al., 2003). Thus, understanding the wave field observed at higher altitudes relative to particular convective sources is an im-portant area of study. Theory predicts that isolated, suffi-ciently convective thunderstorms can launch waves and cre-ate a unique intensity pattern of concentric circles on a radi-ating surface of constant altitude above such a storm. This was confirmed by Dewan et al. (1998) which presents obser-vations from the MSX satellite which show structures that are due to gravity waves originating from isolated thunder-storms. Meteorological satellite images were also used in Dewan et al. (1998) to show that highly convective isolated thunderstorms occurred at the locations and times of the ex-pected generation zones. Close examination of Fig. 7 shows that the vertical velocity variance before and after the con-vective event is very similar with perhaps slightly more activ-ity before 13:20 UT. This slight asymmetry is also observed in the magnitude of the horizontal momentum flux vector, which should be noted reverses between 13:00 and 14:00 UT, in Fig. 8. It should be noted that recent work by Song et al.
(2003) suggests that the equal propagation of internal gravity waves as a function of direction may only be relevant to the early stages of the lifecycle of convective structures and thus the slight asymmetry observed is not unexpected. Alexander et al. (2004) also suggest that asymmetry in the wave field can be caused by upper tropospheric wind shear.
Examination of the vertical velocity perturbations (see Fig. 4) suggests these waves have a vertical wavelength of ap-proximately 3–4 km. The almost north-south orientation of the momentum fluxes, displayed in Fig. 8, suggests that the gravity waves observed propagate roughly orthogonally to the background wind at 13 km. Thus, little Doppler shifting of the wave is likely and the apparent period (approximately 25 min) should be very similar to the gravity waves’ intrin-sic period. Given these pieces of information the dispersion relation, indicated in Eq. (2), can be used to determine the horizontal wavelength of the gravity wave:
ω2m2=(N2−ω2)k2 (2)
where ω is the intrinsic frequency of the gravity wave, N is the Brunt-V¨ais¨al¨a frequency, k is the horizontal wavenum-ber and m is the vertical wavenumwavenum-ber. The horizontal wave-length of the wave is then derived to be approximately 15 km in the stratosphere for a Brunt-V¨ais¨al¨a frequency of 0.02 rads−1.
The vertical and horizontal group velocities of the
grav-ity wave can then be calculated to be 2 and 10 ms−1or 7.2
and 36 km h−1. Given these values and the position and
tim-ing of the convective events relative to the periods of wave activity it seems likely that the source of the waves is rel-atively close to the radar site in the horizontal (no more than 50 km) and thus the source of these waves can not be attributed to the jet region which is located approximately
200 km to the south of Aberystwyth. The most obvious
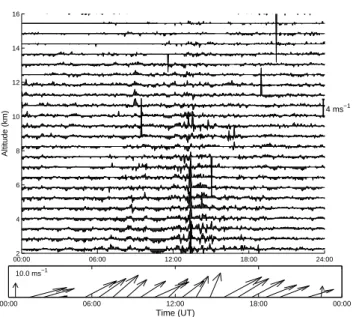
source for these waves in the local vicinity is the region of convection observed in the troposphere. However, a number of authors (Prichard et al., 1995; R¨ottger, 2000) have indi-cated that large vertical velocity perturbations are also pro-duced by mountain waves and a topographic source can not be ruled out using the group velocities alone. Previous work by Hauf (1993) has also indicated the difficultly in defining the forcing of short period waves with particular reference to convective and mountain wave sources. To examine the plausibility of the large vertical velocities being associated with mountain waves, Fig. 9 displays the vertical velocity, along with vectors of the low-level background wind speed and direction. The low-level wind speed and direction were determined from wind-profiler data averaged over the low-est height gates of the radar (i.e. 1.7–2.7 km). The directions shown in Fig. 9 are those towards which the wind is blowing, in degrees clockwise from north. Simultaneous measure-ments of large mean vertical velocities and low-level wind directions over mountainous terrain are a good indicator of mountain wave activity. Examination of the low-level data indicates that during the period of largest vertical velocities
00:002 06:00 12:00 18:00 24:00 4 6 8 10 12 14 16 Altitude (km) 4 ms−1 00:00 06:00 12:00 18:00 00:00 Time (UT) 10.0 ms−1
Fig. 9. The vertical velocity and low-level wind speed and direction
for 1 March 2003. The upper panel depicts the variations of vertical velocity at approximately 1 km intervals from 2 to 16 km. The lower panel indicates the mean horizontal wind vectors averaged over the height range 1.7–2.7 km, directions being those toward which the wind blowing degrees clockwise from north. The first arrow indi-cates a meridional wind of 10 ms−1as a scale.
the wind speed varies little and that the meteorological direc-tion remains close to the southwesterly direcdirec-tion. Prichard et al. (1995) indicates that at Aberystwyth the topography be-tween the NNW and SW direction is less than 150 m height for several kilometers. Thus, the wind direction is such that the flow will only produce significant mountain wave activity for periods of strong low-level winds.The fact that wind di-rection remains relatively unchanged and the low-level wind speed is small between 06:00 to 18:00 UT suggests similar amounts of mountain wave activity throughout this period. Thus, the large increase observed for a brief period inside this time suggests the short period waves observed are unlikely to be related to mountain wave activity. It is still possible that changes in the Brunt-V¨ais¨al¨a frequency during this period could produce this pattern. However, mesoscale tempera-ture structempera-ture data from the UK Met Office Unified model (Cullen, 1993; Lopez et al., 2003) does not suggest that the static stability of the atmosphere changes significantly in this period (see Fig. 5). However, it should be borne in mind that this mesoscale model data is only of sufficient quality to allow us to indicate that the same air mass is observed over Aberystwyth and that no useful information on localized con-vective activity is available. Thus, the balance of probability suggests that the waves observed are associated with convec-tive activity in the troposphere.
In model studies of convectively generated gravity waves it is often indicated that the vertical wavelength of the waves generated by latent heat release is roughly twice the value of
the depth of the latent heating region examined. In this study the depth of the region of latent heat release is approximately 5 km and the vertical wavelengths observed are between 3 and 4 km. Thus, the vertical wavelengths observed are sig-nificantly shorter than that expected by the “rule of thumb” if thermal forcing by latent heating is the mechanism that produces these waves. However, Holton et al. (2002) show that for fixed frequency and fixed vertical depth of thermal forcing, the vertical wavelength of maximum gravity wave response to a specified heating depends strongly on the hor-izontal scale of the forcing. The analysis in Holton et al. (2002) suggests that when the horizontal scale of the ther-mal forcing is large enough the vertical wavelength associ-ated with maximum gravity wave response will be similar or even smaller than the depth of the region of latent release. In the present study this would require the horizontal region of latent heat release to have a radius of greater than 10 km. As previously indicated we do not have any information about the horizontal extent of the convective region and thus can not rule out this possibility. However, a convective region of this size at mid-latitudes would be unusual and thus the rel-atively short vertical wavelengths observed are perhaps sur-prising.
Another possibility that could explain the shorter than ex-pected vertical wavelength is that as indicated in Eq. (2) the vertical wavelength of the gravity wave is inversely propor-tional to the BruntV¨ais¨al¨a frequency. If it is assumed that the wave forcing occurs in the troposphere then the change in Brunt-V¨ais¨al¨a frequency between the troposphere and the stratosphere, a factor of roughly two, would cause the ver-tical wavelength observed in the stratosphere to be roughly half that forced in the troposphere. By this argument, pre-viously mentioned in Salby and Garcia (1987), the vertical wavelength of the observed wave would be roughly equal to the depth of the region of latent heat release which is close to what is observed in this study. Based on the analysis in Holton et al. (2002) this would mean that the horizontal re-gion of latent heat release would have a radius of approxi-mately 5–6 km in this case. While we do not have any infor-mation on the horizontal extent of the region of latent heat release associated with this event the reduction in the area by up to a factor of four seems more reasonable. However, re-sults in Alexander and Holton (2004) suggest that the “rule of thumb” previously indicated may be an underestimate even when examining waves in the stratosphere and it seems that the vertical wavelengths observed in this study are smaller than those expected by recent theory.
The current studies observations are supported by recent work detailed in Dhaka et al. (2005) in which similar pat-terns were observed. It is suggested that the characteristics of the wind profiler observations may play some role in this disparity, the importance of observational technique limita-tion being discussed previously in Alexander et al. (2004). While the frequencies and vertical wavelengths observed in this study are similar to those indicated in Dhaka et al. (2005)
the magnitude of the momentum flux values are quite differ-ent. The significantly smaller values observed in this study may in part be explained by the filtering applied to our data which was necessary to remove the impact of the long period inertia gravity wave observed in the stratosphere (see Fig. 1). The horizontal wavelengths in the current study are slightly smaller than those generally indicated in modelling studies, the very high horizontal resolution simulations indicated in Lane and Knievel (2005) being an exception. Waves asso-ciated with convection with even smaller horizontal wave-lengths (4–8.5 km) have also been observed in Hauf (1993) suggesting that waves with similar properties have been ob-served before in the literature.
It is interesting to note that a number of other convective events have been observed in the radar data and that only one other event shows similar signs of gravity waves above the tropopause perhaps suggesting that this event is unusual in the magnitude of the waves observed. Initial analysis of the seven other convective events observed by the MST radar, one of which is discussed in Hooper et al. (2005), suggests that this event occurs during a period of low wind shear rela-tive to the other events.
This suggests that the modelling and observational stud-ies described in Beres et al. (2002) and Bohme et al. (2004) which indicate the importance of wind shear on the propa-gation of short period gravity waves could potentially be the reason for this feature. This conclusion seems to be sup-ported by the orientation of the horizontal momentum flux which suggests that the waves observed propagate roughly orthogonally to the background wind and are therefore un-likely to be trapped. Further study will focus on identifying more convective regions using the aforementioned signature in uncertianties and examining the frequency of gravity wave events relative to the form of the horizontal wind profile.
Examination of Fig. 5 suggests that the tropopause is poorly defined and is more variable in the region directly above the convective region. It was indicated that this is likely to be associated with the mixing of stratospheric and tropospheric air at the top of the convective region. This concurs with observations discussed in Dhaka et al. (2002) which indicates that there is a significant weakening of the tropopause above convection, possibly due to mixing in-duced by penetrating convection. Work by Reid and Vaughan (2004) show observations which highlight the impact that convection can have on stratosphere-troposphere exchange. Sato et al. (1995) also display observations of convectively generated gravity waves and possible absorption at a critical layer at higher altitudes. Thus, the impact of convective ac-tivity and gravity waves generated by convective acac-tivity on mixing around the tropopause level seems to be worthy of continued study.
5 Conclusions and further work
It has been suggested that by examining the uncertainties on velocity data, derived using the method indicated in Astin (1997), it is possible to identify periods of active convec-tion. This interpretation of this data leads to the analysis of the large vertical velocity perturbations observed in the case study as a period of convection in the troposphere. En-hanced vertical velocity variance and momentum flux, asso-ciated with short periods, at altitudes significantly above the local tropopause level are also observed. This suggests that the large vertical velocity perturbations observed above the tropopause are short-period gravity waves. Analysis detailed in Sect. 4 suggests that the properties of these waves means that they are likely to be associated with the convective ac-tivity.
Simulations by Alexander and Holton (2004) indicate that the locally observed response to a convective heat source depends strongly on the distance of the observer from the source. In particular their suggestion that an observer close to the source will see high frequencies lasting for a short time seems to be validated by this study, though the vertical wave-lengths observed are significantly shorter than those expected in simulations.
Acknowledgements. The MST Radar Facility at Aberystwyth is
funded by the UK Natural Environment Research Council and the data presented in this paper has been kindly provided through the British Atmospheric Data Centre. We would also like to thank the (UK) Met Office who kindly provided the UM mesoscale model data to the British Atmospheric Data Centre. AVHRR data are provided courtesy of the Dundee Satellite Receiving Station. A. J. McDonald would like to acknowledge grant U6518 from University of Canterbury. S. C. Lee has been supported by the research foundation of Kangnung National University.
Edited by: F.-J. L¨ubken
References
Alexander, M. J. and Holton, J. R.: On the spectrum of vertically propagating gravity waves generated by a transient heat source, Atmos. Chem. Phys., 4, 923–932, 2004,
http://www.atmos-chem-phys.net/4/923/2004/.
Alexander, M. J., Beres, J. H., and Pfister, L.: Tropical stratospheric gravity wave activity and relationships to clouds, J. Geophys. Res., 105, 22 299–22 309, 2000.
Alexander, M. J., Tsuda, T., and Vincent, R. A.: Latitudinal varia-tions observed in gravity waves with short vertical wavelengths, J. Atmos. Sci., 59, 1394–1404, 2002.
Alexander, M. J., May, P. T., and Beres, J. H.: Gravity waves generated by convection in the Darwin area during the Dar-win Area Wave Experiment, J. Geophys. Res., 109, D20S04, doi:10.1029/2004JD004729, 2004.
Astin, I.: Confidence interval estimation for VHF Doppler radar measurements of wind velocities, Radio Sci., 32, 2221–2231, 1997.
Beres, J. H., Alexander, M. J., and Holton, J. R.: Effects of Tro-pospheric wind shear on the spectrum of convectively generated gravity waves, J. Atmos. Sci., 59, 1805–1824, 2002.
Bohme, T., Hauf, T., and Lehmann, V.: Investigation of short-period gravity waves with the Lindenberg 482 MHz tropospheric wind profiler, Quart. J. Roy. Meteorol. Soc., 130, 2933–2952, 2004. Chu, Y.-H. and Lin, C.-H.: The severe depletion of turbulent
echo power in precipitation observed using the Chung-Li VHF Doppler radar, Radio Sci., 29, 1311–1320, 1994.
Cullen, M. J. P.: The Unified Forecast Climate Model, Meteorol. Mag., 122, 81–94, 1993.
Dewan, E. M., Picard, R. H., O’Neil, R. R., Gardiner, H. A. J. G., Mill, J. D., Richards, E., Kendra, M., and Gallery, W. O.: MSX satellite observations of thunderstorms-generated gravity waves in mid-wave infrared images of the upper stratosphere, Geophys. Res. Lett., 25, 939–942, 1998.
Dhaka, S. K., Choudhary, R. K., Malik, S., Shigabaki, Y., Ya-manaka, M. D., and Fukao, S.: Observable signatures of a con-vectively generated wave field over the tropics using Indian MST radar at Gadanki (13.5◦N, 79.2◦E), Geophys. Res. Lett., 29, 1872, doi:10.1029/2002GL014745, 2002.
Dhaka, S. K., Yamamoto, M. K., Shibagaki, Y., Hashiguchi, H., Yamamoto, M., and Fukao, S.: Convection-induced gravity waves observed by the Equatorial Atmosphere Radar (0.20◦S, 100.32◦E) in Indonesia, Geophys. Res. Lett., 32, L14820, doi:10.1029/2005GL022907, 2005.
Fritts, D. C. and Alexander, M. J.: Gravity wave dynamics and ef-fects in the middle atmosphere, Rev. Geophys., 41, 1–64, 2003. Gage, K. S. and Green, J. L.: An objective method for the
deter-mination of tropopause height from VHF radar observations, J. Appl. Meteorol., 21, 1150–1154, 1982.
Hansen, A. R., Nastrom, G. D., Otkin, J. A., and Eaton, F. D.: MST radar observations of gravity waves and turbulence near thunder-storms, J. Appl. Meteorol., 41, 298–305, 2002.
Hauf, T.: Aircraft Observation of Convection Waves over South-ern Germany – a Case-Study, Mon. Wea. Rev., 121, 3282–3290, 1993.
Holton, J., Beres, J., and Zhou, X.: On the vertical scale of gravity waves excited by localized thermal forcing, J. Atmos. Sci., 59, 2019–2023, 2002.
Hooper, D. A., McDonald, A. J., Pavelin, E., Carey-Smith, T. K., and Pascoe, C. L.: The signature of mid-latitude convection ob-served by VHF wind-profiling radar, Geophys. Res. Lett., 32, L04808, doi:10.1029/2004GL020401, 2005.
Karoly, D. J., Roff, G. L., and Reeder, M. J.: Gravity wave activity associated with tropical convection detected in TOGA COARE sounding data, Geophys. Res. Lett., 23, 261–264, 1996. Kawatani, Y., Dhaka, S. K., Takahashi, M., and Tsuda, T.: Large
potential energy of gravity waves over a smooth surface with lit-tle convection: Simulation and observation, Geophys. Res. Lett., 30, 1438, doi:10.1029/2003GL016960, 2003.
Lane, T. P. and Knievel, J. C.: Some effects of model resolution on simulated gravity waves generated by deep, mesoscale convec-tion, J. Atmos. Sci., 62, 3408–3419, 2005.
Lopez, P., Finkele, K., Clark, P., and Mascart, P.: Validation and intercomparison of three mesoscale models on three FASTEX cloud systems: Comparison with coarse-resolution simulations, Quart. J. Roy. Meteorol. Soc., 129, 1841–1871, 2003.
Schmidt, G., and Steinhagen, H.: Boundary-layer convection and diurnal variation of vertical-velocity characteristics in the free troposphere, Quart. J. Roy. Meteorol. Soc., 127, 423–443, 2001. Pavelin, E., Whiteway, J. A., Busen, R., and Hacker, J.: Air-borne observations of turbulence, mixing and gravity waves in the tropopause region, J. Geophys. Res., 107, 2070, doi:10.1029/2001JD000775, 2002.
Prichard, I., Thomas, L., and Worthington, R. M.: The characteris-tics of mountain waves observed by radar near the west coast of Wales, Ann. Geophys., 13, 757–767, 1995,
http://www.ann-geophys.net/13/757/1995/.
Reid, H. J. and Vaughan, G.: Convective mixing in a tropopause fold, Quart. J. Roy. Meteorol. Soc., 130, 1195–1212, 2004. R¨ottger, J.: ST radar observations of atmospheric waves over
moun-tainous areas: a review, Ann. Geophys., 18, 750–765, 2000, http://www.ann-geophys.net/18/750/2000/.
Salby, M. L. and Garcia, R. R.: Transient-Response to Localized Episodic Heating in the Tropics .1. Excitation and Short-Time near-Field Behavior, J. Atmos. Sci., 44, 458–498, 1987.
Sato, K., Hashiguchi, H., and Fukao, S.: Gravity-Waves and Turbu-lence Associated with Cumulus Convection Observed with the UHF/VHF Clear-Air Doppler Radars, J. Geophys. Res., 100, 7111–7119, 1995.
Song, I. S., Chun, H. Y., and Lane, T. P.: Generation mechanisms of convectively forced internal gravity waves and their propagation to the stratosphere, J. Atmos. Sci., 60, 1960–1980, 2003. Tsuda, T. and Hocke, K.: Application of GPS radio occultation data
for studies of atmospheric waves in the middle atmosphere and ionosphere, J. Meteorol. Soc. Japan, 82, 419–426, 2004. Vaughan, G.: The UK MST radar, Weather, 57, 69–73, 2002. Vincent, R. A. and Reid, I. M.: HF Doppler Measurements of
Meso-spheric Gravity-Wave Momentum Fluxes, J. Atmos. Sci., 40, 1321–1333, 1983.
Vincent, R. A., MacKinnon, A., Reid, I. M., and Alexander, M. J.: VHF profiler observations of winds and waves in the troposphere during the Darwin Area Wave Experiment (DAWEX), J. Geo-phys. Res., 109, D20S02, doi:10.1029/2004JD004714, 2004.