HAL Id: hal-02056615
https://hal.archives-ouvertes.fr/hal-02056615
Submitted on 4 Mar 2019HAL is a multi-disciplinary open access archive for the deposit and dissemination of sci-entific research documents, whether they are pub-lished or not. The documents may come from teaching and research institutions in France or abroad, or from public or private research centers.
L’archive ouverte pluridisciplinaire HAL, est destinée au dépôt et à la diffusion de documents scientifiques de niveau recherche, publiés ou non, émanant des établissements d’enseignement et de recherche français ou étrangers, des laboratoires publics ou privés.
Orchard management and preferential flow in Andosols
– comparing two kiwifruit orchards in New Zealand
Karin Muller, Céline Duwig, Anne-Julie Tinet, Alfonso Gastelum Strozzi,
Lorenzo Spadini, Marie Christine Morel, Pascal Charrier
To cite this version:
Karin Muller, Céline Duwig, Anne-Julie Tinet, Alfonso Gastelum Strozzi, Lorenzo Spadini, et al.. Orchard management and preferential flow in Andosols – comparing two kiwifruit orchards in New Zealand. Soil Research, CSIRO Publishing, 2019, �10.1071/sr18293�. �hal-02056615�
Article published in Soil Research (www.publish.csiro.au/SR/SR18293) doi.org/10.1071/SR18293
Orchard management and preferential flow in Andosols – comparing two kiwifruit
orchards in New Zealand
Karin MüllerA, Céline DuwigB, Anne-Julie TinetC,G, Alfonso Gastelum StrozziD, Lorenzo SpadiniB, Marie Christine MorelB,E and Pascal CharrierF
A
Plant & Food Research, Bisley Road, Hamilton 3214, New Zealand.
B
Université Grenoble Alpes, CNRS, IRD, Grenoble INP, IGE, F-38000 Grenoble, France.
C
Université de Lorraine, CNRS, GeoResources, F-54000 Nancy, France.
D
Centro de Ciencias Aplicadas y Desarrollo Tecnológico, Universidad Nacional Autónoma de Mexico, Mexico, D.F., México.
E
Conservatoire National des Arts et Métiers, 292 rue Saint Martin 75141 Paris cedex 03, France.
F
Université Grenoble Alpes, CNRS, Grenoble INP, 3SR, F-38000 Grenoble, France Cedex 9, France.
G
Corresponding author. Email: anne-julie.tinet@univ-lorraine.fr
Sustainable horticulture depends on the integrity of soil functions, which directly depend on soil architecture affecting aggregation, root growth, as well as liquid and gas permeability. We hypothesised that changes in soil architecture resulting from feedback mechanisms between management, soil organic carbon contents (SOC), biota and vegetation can be captured with X-ray computed tomography (CT), and that these affect the soil filtering function, which thus, can be manipulated through orchard management. We compared the transport of copper, a widely used fungicide, through intact soil cores from vine rows of kiwifruit orchards under organic and integrated management. We first derived 3D-macropore characteristics from CT-images, followed by leaching a pulse of copper and a tracer through the same cores. The organic orchard soil had a significantly higher SOC content than the integrated orchard soil, and this was positively correlated with total porosity. Macropores (>92 µm) were larger with a higher connectivity, but significantly fewer in the organic than the integrated orchard soil. This resulted in a lower macroporosity and a better copper filtering capacity of the organic than the integrated orchard soil. Copper distribution was reasonably predicted when combining SOC contents, pH and macropore characteristics. Significant relationships between soil parameters and indicators of the strength of preferential flow verified that CT-derived macropore characteristics can be used to predict functional solute transport parameters. The relevance of our results and relationships observed between macropore characteristics, functional indicators of preferential flow and the fate of copper needs verification with samples representing more soils and sites.
Additional keywords: carbon, filtering function, kiwifruit orchard, soil architecture, X-ray computed
Introduction
Kiwifruit is the fruit of a perennial woody vine. New Zealand (NZ) is among the leading kiwifruit-producing countries worldwide. Kiwifruit production totalled ~1 412 351 MT in 2012 with Italy and NZ together producing ~54% of this total (http://faostat.fao.org/site/339/default.aspx). In NZ in 2016, 9336 ha of Actinidia deliciosa ‘Hayward’ were under integrated management, which can be understood as a production system aiming at ‘environmental and economic sustainability including the efficient use of natural resources’ (http://www.zespri.com/), and 537 ha were grown according to certified organic standards (BIO-GRO; NZ’s organic protocol organisation; https://www.biogro.co.nz/).
Copper (Cu) has been applied to various crops for controlling different plant diseases since 1885, particularly in vineyards and orchards (Alloway 2013). For example, Bordeaux mixture, a combination of copper sulfate and lime, has traditionally been used for the control of fungal diseases in grapes. It is commonly accepted that long-term foliar applications of copper-based fungicides and bactericides can enhance Cu concentrations in orchard soils (Nagajyoti et al. 2010). Many studies have investigated Cu accumulation in orchard soils worldwide (Besnard et al. 2001; Pietrzak and McPhail 2004; Vavoulidou et al. 2005; Sun et al. 2018). Background concentrations of Cu in soil are dependent on the soil parent material and are generally below 30 mg kg−1 soil (Alloway 2013). Besnard et al. (2001) reported 100–1500 mg Cu kg−1 in Champagne vineyard soils compared with 5– 30 mg Cu kg−1 in adjacent agricultural soils. Horticultural soils with levels exceeding 3000 mg Cu kg−1 have been reported in a >100-year-old Brazilian vineyard (Mirlean et al. 2007).
The motivation for this research was the significant increase in the use of antimicrobial Cu sprays on the vines in NZ kiwifruit orchards as a response to the first outbreak of the bacterial disease Pseudomonas syringae pv. actinidiae (Psa) in 2010 that has been threatening the NZ kiwifruit industry (Vanneste et al. 2011). ‘BIO-GRO’ orchardists in NZ are currently permitted to use 6 kg ha−1 year−1 of Cu, which is 3 kg more than the maximum allowed before the incursion of Psa (https://www.biogro.co.nz/). New Zealand’s conventional growers producing for the international market are permitted to use 8 kg ha−1 year−1 of Cu. Several recent monitoring studies on NZ kiwifruit orchard soils have reported elevated Cu levels (Dean 2016). Increased Cu concentrations in soils enhance the risk of Cu leaching, which has been shown to be closely related to soil structure (Paradelo et al. 2013). For example, Paradelo et al. (2013) conducted displacement experiments with intact soil cores collected from a long-term contaminated pasture site with a Cu gradient of 20–3800 mg Cu kg−1 soil. They reported a strong correlation between Cu leaching and soil macroporosity derived from X-ray computed tomography (CT) scans with a resolution of 200 µm.
It is well known that carbon (C) contents affect soil structure and vice versa. The C contents in agricultural soils can be manipulated through soil management practices (Deurer et al. 2009). The link between soil biotic activity, soil organic matter decomposition and stabilisation, and soil aggregate
dynamics has been recognised and intensively studied since the beginning of the 1900s (Six et al. 2004). Soil porous structure and organic matter are not independent. Pores are created by abiotic and biotic factors (root growth and burrowing etc.) and different forms of organic matter stabilise pores of different sizes. In turn, pore characteristics influence organic matter dynamics (Kay and Vanden Bygaart 2002).
Applying 3D X-ray CT, it was found that soil organic carbon (SOC) and organic fertilisations influenced soil structure both in terms of pore morphology and pore network topology (Dal Ferro et al. 2014). Naveed et al. (2014) evaluated the soil water characteristics and gas transport and analysed soil structure via X-ray CT. Their results suggested that with increasing fertiliser application rates, the pore size distributions widened, and pore connectivity was significantly improved. Larsbo et al. (2016) found that preferential transport in macropores was reduced in soils with larger contents of SOC. These soils were also characterised by larger volumes of pores <600 μm in size.
We hypothesised that changes in pore structure resulting from the feedback mechanisms between orchard management, soil biota and vegetation can be captured with 3D X-ray CT, and that such changes can explain differences in the filtering function of soils. Accordingly, our objectives were (i) to assess the effect of orchard management on topsoil C contents and architecture, and (ii) to analyse the relationship between the soil macropore network, water flow and Cu accumulation in Andosols, a typical soil for kiwifruit production in NZ.
Materials and methods
Sites and soils
The two selected sites are kiwifruit orchards developed on Andosols (IUSS Working Group WRB, 2006) located in the Bay of Plenty, NZ. The orchards are located in the same region (Orchard 1, −37.67298, 176.05841; Orchard 2, −37.80387, 176.40095) sharing the same climatic conditions. Long-term average annual temperature in the region is 14.7°C and annual rainfall totals on average 1460 mm. The annual potential evapotranspiration rate in Te Puke is 1014 mm (Te Puke, NIWA climate station). The kiwifruit vines in the two orchards are of the same cultivar Actinidia deliciosa ‘Hayward’ and of similar age (29 and 25–30 years). One of the two orchards (O) has been under certified organic management (BIO- GRO) since its establishment. The second orchard (I) has been managed following integrated management principles, e.g. the ‘KiwiGreen’ program, an integrated pest management program, that ensures that the environmentally safest available pesticide is applied upon monitoring of occurrence or level of a particular pest or disease as well as weather conditions for its potential application. The soils developed from the same parent material. A preliminary analysis of generic soil properties of the two soil profiles to a depth of 1 m is summarised in Table 1, which confirmed that both soils had a silt loam texture. It also confirmed our expectation of significantly higher SOC contents and lower bulk densities in O than I.
The main differences between the two orchard management practices relevant to this project relate to those affecting SOC contents and thus in turn soil structure: in O ~6 t year−1 of an organic soil amendment consisting of 50% compost and 50% chicken manure have been applied since the establishment of the orchard, while in I this practice has started only in recent years (3–5 years) and at a lower rate. BIO-GRO regulations inhibit the use of herbicides. Accordingly, O’s orchard floor was under full grass cover. In contrast, the vine rows in I were kept weed-free by annual applications of a glyphosate-containing herbicide at the maximum recommended application rate (660 g a.i. ha−1).
Intact soil cores from the topsoil of the vine rows were collected on 5th March 2012. A cylindrical PVC tube with an inner diameter of 104 mm and a length of 111 mm was pushed a few centimetres into the ground by hand until the penetration resistance was too high. The remainder of the core was carefully excavated by removing soil around the PVC tube, which allowed pushing it into the soil by hand. We also took bulk soil near each core to determine its gravimetric water content. The soil cores were weighed at field water content. We calculated each core’s dry soil weight, bulk density and total porosity taking into account the PVC tube’s tare weight and the soil water content at the time of sampling and assuming a particle density of 2.65 g cm−3. On 10th April another set of intact soil cores were collected to determine the initial total Cu concentration in the topsoils. All soil cores were stored at 4°C in the dark before the experiments.
X-ray CT scanning and image analysis
The scanning of the nearly saturated soil cores with 3D X-ray CT was conducted at the 3S-R laboratory in Grenoble, France. The scanning was performed with a multi-energy X-ray source at 120 kV and 500 µA. In each scan 1200 angular projection images were collected and each radiograph was averaged over 10 frames. Ring artefacts were minimised during data acquisition and a 0.5 mm Cu filter was used to reduce beam hardening. The software package X-act (RX-solutions, Hurst, Texas, United States) was used to obtain the 3D maps of attenuation coefficients from the 2D angular projections. The 3D images of attenuation coefficients with the isotropic voxel size of 92 µm were then translated into a continuous stack of 2D 16-bit TIFF images using the software DigiCT 2.42 (Digisens 3D, Le Bourget-du-Lac, France). The algorithm FDK was used to reconstruct the slices. Voxel size was 92.94 × 92.94 × 92.94 µm. The images were binarised and the individual pores labelled using the module fuzzy – c – means clustering method of the program SMAS (Gastelum-Strozzi 2018). In brief, the following four values were used to label void voxels: three texture values, namely the intensity value, the average intensity value, the homogeneity with respect to the neighbouring voxels, and the intensity value scaled with respect to the beam hardening. A pore was defined as a set of voxels with a six–connectivity, meaning that the neighbouring voxels in the three main directions within an image were considered. To derive morphological descriptors important for flow processes, like tortuosity and curvature, a medial axis representation of pores was defined as thin segment of connected voxels equidistant to its boundaries (skeletonisation, Ballard and Brown 1982).
Only pores that could be defined by a skeleton were included in the analysis. A total of 14 morphological parameters were obtained for each pore of each core using the software SMAS (www.biocomlab.com/apps/SMAS/). In the following some of the parameters are explained. The circularity C of a pore was determined as:
2
4 A
C
P
(1)where A is the area of a pore in the plane (m2) and P is the perimeter (m). The tortuosity T is defined as the ratio between the geodesic length of the skeleton and the Euclidian distances between the highest skeleton vertex with respect to the z-axis and the lowest one. The Euclidian distance (m) is defined as:
2μ μ
E
s
s
s
s
(2)where 𝑠 is the pore skeleton, and 𝜇 is the highest skeleton vertex and 𝜈 the lowest. The geodesic length (m) can be calculated as:
1 1 s i N i i i
L
s
s
(3)where 𝑁𝑠 is the total number of vertices in the skeleton 𝑠. The tortuosity is then obtained as:
L
T
E
(4)The connectivity was determined using the plugin MorphoLibJ (http://imagej.net/MorphoLibJ; Legland et al. 2016) of the software ImageJ. The Euler number, which may be associated with the number of pores – number of loops + number of solid inclusions, was divided by the total soil volume (V) to give a connectivity density CE . To obtain parameters for entire soil cores or segments of the core, the pore parameter values were averaged for each core or the respective segments by the number of slices. From here onward the pores detectable in the X-ray CT scans are referred to as macropores and they constitute the soil macroporosity. We defined percolating pores as those connected from the top of a core to any of the boundaries of the core.
Transport experiments
After completion of the scanning, we conducted transport experiments with the same soil cores close to saturated conditions. We used KBr as the water tracer and CuN2O6 as the solute. The integrity of the soil structure was ensured by placing a grid at the bottom of the cores. A rainfall simulator was placed on top of the cores. It consisted of nine hypodermic needles fed from a reservoir. Two peristaltic pumps (Gilson Minipuls 3, Gilson, US) were used to create steady-state flow through the soil cores. One pump applied the rainfall to the top of the soil core, the second pump sucked the
leachate at the bottom of the core. The rainfall intensity, and thus also the flow, were regulated through setting the speed of the pump and the selection of identical 1.3-mm internal diameter tubing. The system was hermetically closed to maintain the suction. According to the calibrations before and after the experiments rainfall was applied at a rate of 5.3 ± 0.03 mm h−1. Furthermore, the flow was checked by regularly weighing the leachate samples collected automatically in 8-min time intervals.
Before the actual experiments two to three pore volumes of a 0.01 M CaCl2-solution were applied to the soils until steady-state flow conditions and a constant electrical conductivity (determined on-line) of the leachate samples were reached. We then applied ~10% to 20% of one pore volume (~84 mL) of an aqueous solution containing bromide and Cu at 460 g L−1 KBr and 192 mg L−1 CuN2O6. The Cu application rate represented twice the recommended maximum annual Cu application rate of 1.2 kg ha−1. The pulse was followed by two to three pore volumes of 0.01 M CaCl2-solution until the electrical conductivity reached its initial value. The conditions of the transport experiments are summarised in Table 2.
Every 10th leachate sample was divided into two sub-samples for analysing Cu and bromide. The leachate samples for Cu analysis were acidified with 0.1% HNO3 (Fisher ultrapure grade 67–69%). All leachate samples were stored in the dark at 4°C until analysis. Bromide concentrations were quantified by ion chromatography (Metrohm 732/733 separation centre, Metrosep A Supp 16–150 mm, and Metrosep C2–150 mm anion and cation columns) based on the USEPA Method 300.0 (Pfaff 1998). The limit of detection was 4 µg L−1 and the limit of quantification was 7 µg L−1 at a signal-to-noise ratio of 3. The other sub-sample of each leachate sample was analysed for Cu at ISTerre laboratory, Grenoble, France via inductively coupled plasma-atomic emission spectrometry (ICP-AES Varian 720-ES Optical Emission Spectrometer) with external calibration. Standards were prepared with a Multi-Element Standards for ICP (Roth) solution. The limit of detection was 0.5 µg L−1 and the limit of quantification was 1 µg L−1 at a signal-to-noise ratio of 3.
Directly after completion of the experiment, the soil cores were weighed to determine the soil’s saturated water content. The cores were sliced into 10 segments; from 0–3 cm depth the intervals were 0.6 cm, from 3–6 cm depth the slices were 1 cm, and the remaining soil was sliced into two 2.5-cm slices. The total Cu distribution in the soil with depth for these soil cores, as well as for three additional soil cores from each orchard, were analysed using a standard nitric hydrochloride acid digestion method (US EPA 3050B). In brief, each soil layer was dried at 105°C for 24 h. Then, the soil was manually ground in a ceramic mortar. The Cu determination was completed in triplicate for each soil layer. An aliquot of 1 g of soil was added to 5 mL of aqua regia (HNO3 : 2 HCl) in a 50-mL glass tube. The samples were incubated for 12 h on a temperature adjustable hot plate at 70°C. After diluting the samples with 50 mL of MilliQ water they were filtered with a 0.45 µm cellulose acetate syringe filter (Millipore). A droplet of 1 M HCl was added to preserve the samples until analysis. The analysis was carried out in triplicate for each soil layer by ICP-AES as described above.
In addition, total nitrogen (N) and C concentrations in subsamples of the soil layers were determined by the non-purgeable organic carbon method by 680°C combustion catalytic oxidation in a Shimadzu TOC-V CSN device coupled to a non-dispersive infrared NDIR detector. Standard solutions were prepared from potassium biphthalate and ultrapure water (MilliQ). The pH of the soil layers was also determined. About 10 g of sieved soil was mixed with 10 mL of Milli-Q water and the suspension was stirred for 5 min. The suspension was then left to settle for ~1 h and the pH was measured in the supernatant.
Modelling of transport processes
We used the software ‘OM-MADE’ to fit a numerical solution of the advection dispersion equation (ADE) coupled with the mobile-immobile model or a mobile-mobile model to the experimental data. The simulation model was developed for the flow through karst material (Collon et al. 2018). It is under publication in the Github repository (https://github.com/OM-MADE/OM-MADE). This is the first application of the software to soils.
The governing equations of the mobile-immobile transport model, which is the classical physical non-equilibrium model assuming two distinct liquid regions in the soil, a mobile region with flowing water and a region with immobile water (van Genuchten and Wagenet 1989), are as follows for non-adsorbing solutes:
2 * 2 m m m m im m m C Q C C D C C LC t A x x
(5)
im im m imC
C
C
t
(6)where θm is the mobile water content, Cm is the solute concentration in this mobile water (kg m−3), Q
is the flux (m3 s−1), A is the total area of the soil core (m2), D* is the dispersion coefficient (m2 s−1), denoting the effective dispersion in the soil, α is the exchange rate between the mobile and the immobile water phases (s−1), Cim is the solute concentration in the immobile water (kg m−3), and L is a
loss rate (s−1). The total water content of the soil, θ is the sum of the mobile water content, θm and the
immobile water content, θim. The outflow concentration Cout (kg m−3) equals the solute concentration
of the mobile water fraction, Cm.
The mobile-mobile transport model similarly assumes two distinct liquid regions in the soil but both have mobile water phases, which have different flow velocities. Accordingly, the governing equations of the model can be written as:
2 * 1 1 1 1 1 1 2 2 1 C Q C C D C C t A x x
(7)
2 * 2 2 2 2 2 2 2 1 2 C Q C C D C C t A x x
(8)where C1 and C2 are the solute concentrations (kg m−3) in the fast and slow mobile phases, Q1 and Q2
are the fluxes (m3 s−1) (with the total flux Q = Q1 + Q2) with the fast mobile water content θ1 and the
slow mobile water content θ2 respectively. D1* and D2* are the dispersion coefficients (m
2
s−1) for the fast and slow flow. Here, the total soil water content θ is the sum of the water contents, θ1 and θ2. The
outflow concentration Cout (kg m−3) can be calculated as:
1 2 1 2 out Q Q C C C Q Q (9)
To select the model that fit the experimental data best we calculated the normalised root mean square error (NRMSE), where lower values indicate less residual variance and thus a better fit:
2 11
n i i iNRMSE
s
y
ny
(10)
1 1 1 1 11
2
n i i i i i ny
y
y
x
x
x
x
(11)where x represents the experimental pore volume and y represents the normalised bromide concentrations measured in the leachate samples, s are the simulated values at the same pore volumes as the measured data, n is the number of experimental measurements, and
𝑦
̅ is the average experimental bromide concentration, calculated by integrating the experimental curve using the trapeze method.The 5% arrival time was calculated as an indicator of preferential flow (Koestel et al. 2012; Larsbo et al. 2016). It corresponds to the time between the pulse application and the arrival of the first 5% of the tracer at the bottom of the soil cores normalised to the first temporal moment of the breakthrough curves (BTCs). We also used the holdback factor, which is defined as ‘the amount of original fluid remaining in the column when one (water-filled) pore volume of displacing fluid has entered’ (Koestel et al. 2012). The holdback factor was calculated as the integral of the dimensionless cumulative BTC between zero and one. Absolute experimental data were used for these calculations because flow rate and core size were kept constant in all experiments.
Statistical analysis
The dimensions of the dataset were reduced by principal components analysis (PCA), as implemented in R (R Core Team 2017) using the function prcomp (Kassambara and Mundt 2017). In brief, the orthogonal transformation allowed the visualisation of the potential correlations between the hydrodynamic and soil parameters as well as the macropore characteristics derived by X-ray CT. It also permitted the identification of the minimal number of uncorrelated parameters, the principal components, and ranking them with regard to their contribution to the variance of the data. The principal components were used as new coordinate system, in which each individual core of the
dataset was represented using the score value obtained from the PCA. The individual cores in the new coordinate system were then grouped into clusters according to their distances.
In addition, Pearson’s correlation analysis and multiple stepwise regression analysis with backward selection were performed with Statistica (StatSoft Inc., Tulsa, USA) to evaluate linear relationships between soil properties, solute transport parameters and soil structural parameters derived from X-ray CT images.
Results and discussion
Effect of orchard management on basic soil properties
The silt loam topsoils in the vine rows under the different orchard management practices had significantly (P < 0.001) different SOC and N contents, which are shown with depth in Figs 1a and 1b. Regular compost applications to soils have been shown to result in higher SOC contents in soils (Deurer et al. 2009; Brown and Cotton 2011; Yu et al. 2012). In our study, the different management of the vine rows, grassed vine rows in the organic orchard versus vegetation-free herbicide-applied rows in the integrated orchard, might also have contributed to the difference observed. Further, regular Cu applications and associated higher Cu concentrations in the O topsoil compared with the I topsoil (Fig. 1d) might have inhibited microbial activity, and thereby reduced C mineralisation rates. The soil pH was similar in both topsoils (Fig. 1c). The total porosity of the O topsoil was 0.716 cm3 cm−3, significantly (P = 0.01) larger than that of the I topsoil (0.62 cm3 cm−3) (Table 2). The C content was strongly and positively correlated with total porosity (r = 0.95; P = 0.004).
Effect of orchard management on pore architecture
Macroporosity tended to be higher in I (an average of 0.064 cm3 cm−3) than O (0.043 cm3 cm−3) but this difference was not significant (P = 0.2). The macroporosity is within the range of macroporosities reported in the past for arable, horticultural and pastoral soils with similar X-ray CT resolutions (Peth et al. 2008; Deurer et al. 2009; Paradelo et al. 2016; Müller et al. 2018). The macropore networks are visualised in Fig. 2. We found a weak negative correlation between SOC and macroporosity (r = −0.39; P < 0.05). In contrast, Deurer et al. (2009) reported a significant positive correlation between SOC and macroporosity for topsoils of apple orchards under organic and integrated orchard management. It is worthwhile to mention that we found a strong positive correlation between SOC and sub-X-ray CT resolution porosity as mentioned above. Larsbo et al. (2016) and Paradelo et al. (2016) found no correlation between CT-derived macroporosity and SOC contents. These inconsistent findings might be explained by different soil types, clay contents and mineralogy, and the role of clay on soil structure (Naveed et al. 2013).
The I topsoil had with 43 407 (±6207) macropores per core nearly significant (P = 0.06) more macropores than the O topsoil with 26 988 (±6179) macropores per core. This resulted in macropore
densities ranging between 0.07 and 0.1 mm−3 for I and between 0.03 and 0.07 mm−3 for O. These are lower than the macropore density reported for a pastoral Andosol topsoil (Müller et al. 2018) but an order of magnitude higher than those reported by Zhang et al. (2017) for forest soils. The average macropore diameter was significantly (P < 0.05) larger for the O topsoil (0.64 ± 0.0032 mm) than for the I topsoil (0.59 ± 0.0018 mm). Assuming that a large proportion of macropores were formed through root activities (Hatano et al. 1988), our results of more and smaller macropores in I compared with O are consistent with previous research on the effect of orchard groundcover management on tree roots. The longevity of shallow tree roots in orchard rows kept weed-free through herbicide applications has been reported to be lower than in grassed orchard rows, leading to smaller root diameters (Yao et al. 2009). This might explain the smaller average macropore diameter found in I compared with O. In addition, topsoil temperatures are higher in tree rows that are kept weed-free than in grassed rows (Merwin et al. 1994), which might affect root growth. Kiwifruit vine root growth is limited above 25°C (Smith et al. 1989), which might also have contributed to the smaller average macropore diameter in I compared with O. In addition, consistent with our findings of more macropores in I than in O, Yao et al. (2009) observed more shallow roots in weed-free apple orchard tree rows than in grassed tree rows. This was explained by lower competition for water and nutrients in weed-free rows than in grassed rows (Parker et al. 1993). Moreover, wetting–drying cycles also contribute to macropore formation (Horn and Smucker 2005). Wetting–drying cycles would have occurred more often in the weed-free vine rows of I than O due to larger temperature and moisture gradients (Ananyeva et al. 2013). Furthermore, macro-fauna and earthworms in particular are important soil engineers. For example, in a catchment study earthworm numbers were found to be positively correlated with the number of macropores (van Schaik et al. 2014). Any of these reasons could explain our findings of more and on average smaller macropores in I than in O.
Average tortuosity was 2.37 ± 0.1 in O and compared with 2.47 ± 0.03 in I (P = 0.18; Fig. 3a). It was comparable to the tortuosity of an Andosol topsoil under pasture (Müller et al. 2018) with values higher than those reported for arable soils (Katuwal et al. 2015). The connectivity density was significantly (P < 0.05) lower in O (average of −0.23 ± 0.43) than in I (0.19 ± 0.06). The lower the connectivity density value, the higher the pore connectivity (Fig. 3b). Although the total number of pores was significantly (P < 0.05) higher in O than in I (Fig. 3c), the number of connected pores in the two orchard soils was about the same (P = 1). The pore shapes were similar in both soils, and were dominated by tubular pores, which are indicative of pores formed by roots, supporting the assumption that roots were important for macropore formation in these orchards. Macropores in I tended to be more elongated (Fig. 3d).
Effect of orchard management on hydrodynamic soil properties
The dimensionless measured and simulated BTCs for the inert tracer bromide through the two orchard topsoils are shown in Fig. 4. The pulse volume between the six cores varied between 83.2 and
87.4 mL with an average of 84.3 ± 0.64 mL, which can be explained by the difficulties of establishing the same fluxes in the soil cores. The experimental parameters are summarised in Table 2. Table 3 presents the corresponding modelling parameters. The Peclet number for all experiments was >5, which according to Kutílek and Nielsen (1994) indicates that molecular diffusion processes can be neglected and the hydrodynamic dispersion can be assumed to be equal to the advective dispersion. Dispersivity (λ; m) can then be estimated as D*/v with v being flow velocity (m s-1). Dispersivity varied between 3 × 10⁻³ and 8 × 10⁻³ m for the O topsoil and was in the same range as reported in the literature for intact Andosol soil samples (e.g. Magesan et al. 2003; Prado et al. 2014). Dispersivity displayed a much wider range for the I topsoils (Table 3).
All BTCs from the O topsoil cores were more or less symmetrical with the centre of gravity at or close to one pore volume (Figs 4a–c). Bromide sorption was excluded based on complementary batch experiments (data not shown). The ADE-model fit the measured data reasonably well for all three soil cores, with NRMSE of 5.6%, 4.6% and 5.3% for O1, O2 and O3 respectively. For O1, this NRMSE was achieved by adjusting the bromide input to address the poor mass balance, which might be related to an experimental problem with the bromide analysis. In spite of this issue, the results suggest that flow processes through the O topsoils were dominated by homogeneous flow through a well-connected pore network. In contrast, the BTCs from I were asymmetrical and showed a tailing characteristic of preferential flow (Brusseau and Rao 1990). The bromide peak occurred in all three cores well before one pore volume (Figs 4d-f). The experimental data fitted well with the mobile-immobile model for two of the soil cores collected from the integrated orchard (I1 and I3) with NRMSE-values of 2.7% and 5.2%. For I2, the mobile-immobile model resulted in an NRMSE of 8.2%. The BTC for I2 was characterised by a double peak with the first larger peak before one pore volume. This transport behaviour was best simulated with the mobile-mobile model (NRMSE, 3.8%). This model implies two mobile water phases, which in our case had similar velocity but differed in dispersivity (Table 3). This difference in dispersivity was the main cause for the double-peak behaviour. Applying the mobile-immobile or mobile-mobile models greatly improved the simulations of the BTCs for I1 and I3. The respective NRMSE-values using the ADE model were 18%, 25% and 6% respectively. The modelled hydrodynamic parameters for the different modelling approaches are summarised in Table 3. The mobile water contents for I1 and I3 were 0.01 and 0.05, and thus very low, indicating that most of the water was immobile. Usually, values >0.5 are reported. However, such low mobile water fractions are not unrealistic but highlight the importance of macropore flow (Griffioen et al. 1998). The first order mass transfer coefficient between mobile and immobile zone, α was 0.89 h−1 for I1 and 1.38 h−1 for I3, suggesting that the exchange in I3 was quicker than in I1.
The 5% arrival time of bromide was positively correlated with SOC content (r = 0.83; P < 0.05), while the holdback factor was negatively correlated with SOC (r = −0.95; P < 0.05). The 5% arrival times for the O topsoils were with 0.34, 0.37 and 0.39 for O1, O2 and O3 respectively, and thus close
to the suggested threshold for advective–dispersive transport of 0.4 (Larsbo et al. 2016) supporting the findings of our OM_MADE simulations using the ADE equation. Larsbo et al. (2016) reported similar relationships of less preferential flow in soils with higher C contents for soils from a single field with a SOC gradient from 40 to 160 g kg−1. The respective 5% arrival times for the I topsoils were 0.113, 0.153 and 0.283 for I1, I2 and I3 respectively and significantly shorter (P = 0.03) than those for O.
Relationships between X-ray CT parameters and flow
Nine of the generic soil parameters and 14 hydrodynamic parameters derived from the transport experiments with bromide were considered to be relevant for flow processes through soils (Table 4). To discern the relationships between structural and functional soil parameters and to reduce the number of multiple dependent variables addressing the problem of multicollinearity, we conducted a PCA analysis. For the PCA, we considered structural parameters for the percolating pores only because only pores well connected in the vertical direction are considered relevant for preferential flow (Jarvis et al. 2017). Four principal components had eigenvalues >1. The first two components with eigenvalues >1 were extracted, which explained ~75.4% of the total variance of the original data (Table 4, Fig. 5). The first component explained the highest variance in the results (54.5%), whereas the second principal component accounted for 20.9% of the variance. The relation with the parameters is visualised as vectors in Fig. 5a, and the position of each core is shown in the new 2D-coordinate system in Fig. 5b. The vector loading plot (Fig. 5a) shows the parameters with the greatest effect on discriminating the orchards. The PCA separated the two orchards along PC1 (Fig. 5b). The soils from O clustered at the left side of the biplot, and were clearly separated from the soils from I, which were further spread apart from each other on the right side of the biplot. The soils from O were separated from the I topsoils along PC1 due to larger total porosity, mobile water content, pore diameter, SOC content, and lower holdback factor and bulk density (Fig. 5a). For I, a spread along PC2 was observed, which was related to tortuosity, pore curvature, sphericity and the pore water velocity.
Koestel et al. (2011) conducted a meta-analysis with 733 BTCs in order to improve the understanding of relationships between soil properties and site factors and the occurrence of preferential flow. They identified the 5% arrival time and the holdback factor as useful indicators for the strength of preferential flow. We conducted multiple linear regression analyses to identify the models that explained 5% bromide arrival time and its holdback factor best including both CT-derived structural and general soil parameters. The best and most significant model (P = 0.001; Fig. 6a), which explained ~98% of the variability of the 5% bromide arrival time included SOC (P = 0.0005) and tortuosity (P = 0.002). The parameters C (P < 0.001), connectivity (P = 0.006) and tortuosity (P = 0.009) were selected in the best model for the holdback factor (P < 0.001; Fig. 6b). These results highlight the importance of SOC contents for the occurrence of preferential flow, as also recently highlighted by Larsbo et al. (2016). They also support previous findings that structural soil parameters
can considerably improve predictions of preferential flow (Luo et al. 2010; Katuwal et al. 2015; Paradelo et al. 2016).
Effects of orchard management on Cu leaching and accumulation
We did not detect Cu in the leachate samples of O. For I, we detected traces of Cu (concentrations close to the detection limit of 0.5 µg L−1) but only in a few leachate samples collected before one pore volume. Copper was probably preferentially transported in I, albeit at very low concentrations. Quantification was impossible with our analytical protocol.
We analysed the total Cu distribution with depth in the two orchard soils as well as in the cores after completion of the transport experiments. The dotted lines in Fig. 7a present the average total Cu concentration in the topsoils before the transport experiments. The concentrations were significantly (P > 0.05) higher in O than I. This was explained by the fact that orchardists following organic management principles traditionally rely on Cu as fungicide. The Cu enrichment factor for the transport experiment is presented in Fig. 7b; the applied Cu accumulated in the top 2.5 cm in O, whereas it was moved at least to 8 cm depth in I. This is supported by the finding of Cu traces in the leachate samples of I. About 85% of the variability of the total Cu concentrations in the segments of the two topsoils was explained by SOC, pH, pore circularity and equivalent pore diameter (Fig. 8; adjusted R2 = 0.85).
Conclusions
Our study highlights the significant effect of management on SOC content and network architecture of pores >92 µm in topsoils under integrated and organic kiwifruit production. As expected, SOC contents were significantly higher in O than in I topsoils. Macropores were larger with a higher connectivity in the O topsoil than in the I topsoil, but they were significantly fewer in number. Predominantly tube-shaped macropores identified root activities as important factor for macropore formation. In accordance with this, observed differences in the macropore network may be attributed to the effect of herbicides on shallow kiwifruit roots. Significant relationships between soil parameters and indicators of the strength of preferential flow of our water tracer (bromide) verified that structural parameters derived by X-ray CT might be useful for predicting the functional solute transport parameters 5% arrival time and the holdback factor. In addition, predicting the depth distribution of the strong-sorbing solute Cu was best when combining SOC contents and pH with the structural parameters macropore circularity and diameter. Organic orchard management improved the filtering function of the topsoil through increasing SOC content and changing pore architecture. It has to be noted that our results are based on a very limited number of soil cores from only two orchards and need to be confirmed by analysing a larger number of samples.
Conflicts of interest
The authors declare no conflicts of interest.
Acknowledgements
This work was started during a secondment of the first author at the Institut des Géosciences de l’Environnement (IGE) in Grenoble as invited scientist by Observatoire des Sciences de l’Univers de Grenoble (OSUG). The continuation of the work was supported by the New Zealand-European Union (EU) Marie Sklodowska-Curie Research and Innovation Staff Exchange (RISE) Counterpart Fund from Government funding (Contract 645717), administered by the Royal Society of New Zealand.
References
Alloway BJ (2013) ‘Heavy metals in soils – trace metals and metalloids in soils and their bioavailability.’ (Springer Science and Business Media: Dordrecht)
Ananyeva K, Wang W, Smucker AJM, Rivers ML, Kravchenko AN (2013) Can intra-aggregate pore structures affect the aggregate’s effectiveness in protecting carbon? Soil Biology & Biochemistry 57, 868–875. doi:10.1016/j.soilbio.2012.10.019
Ballard D, Brown C (1982) Representation of three-dimensional structures. In ‘Computer vision’. pp. 264–316. (Prentice-Hall: Englewood Cliffs, NJ)
Besnard E, Chenu C, Robert M (2001) Influence of organic amendments on copper distribution among particle-size and density fractions in Champagne vineyard soils. Environmental Pollution 112, 329–337. doi:10.1016/S0269-7491(00)00151-2
Brown CD, Cotton M (2011) Changes in soil properties and carbon content following compost application:
results of on-farm sampling. Compost Science & Utilization 19, 87–96.
doi:10.1080/1065657X.2011.10736983
Brusseau ML, Rao PSC (1990) Modeling solute transport in structured soils: a review. Geoderma 46, 169–192. doi:10.1016/0016-7061(90)90014-Z
Collon P, Tinet A-J, Dewaide L, Hallet V (2018) Simulation of multiple-peaked skewed breakthrough curves with the new open-source program OM-MADE. In ‘Eurokarst 2018, July 2018 Besançon, France.’
Dal Ferro N, Sartori L, Simonetti G, Berti A, Morari F (2014) Soil macro- and microstructure as affected by different tillage systems and their effects on maize root growth. Soil & Tillage Research 140, 55–65. doi:10.1016/j.still.2014.02.003
Dean FP (2016) Effects of copper sprays on microbial communities in kiwifruit orchard soils. MSc Thesis, University of Waikato, New Zealand.
Deurer M, Grinev D, Young I, Clothier BE, Müller K (2009) The impact of soil carbon management on soil macropore structure: a comparison of two apple orchard systems in New Zealand. European Journal of Soil Science 60, 945–955. doi:10.1111/j.1365-2389.2009.01164.x
Gastelum-Strozzi A (2018) SMAS: Soil morphological analysis software. http://www.biocomlab.com/apps/SMAS.
Griffioen JW, Barry DA, Parlange J-Y (1998) Interpretation of two-region model parameters. Water Resources Research 34, 373–384. doi:10.1029/97WR02027
Hatano R, Iwanaga K, Okajima H, Sakuma T (1988) Relationship between the distribution of soil macropores and root elongation. Soil Science and Plant Nutrition 34, 535–546. doi:10.1080/00380768.1988.10416469
Horn R, Smucker A (2005) Structure formation and its consequences for gas and water transport in unsaturated arable and forest soils. Soil & Tillage Research 82, 5–14. doi:10.1016/j.still.2005.01.002
IUSS Working Group WRB (2006) World Reference Base for Soil Resources 2006. A framework for international classification, correlation and communication. 2nd edition. World Soil Resources Reports 103 FAO, Rome.
Jarvis N, Larsbo M, Koestel J (2017) Connectivity and percolation of structural pore networks in a cultivated silt loam soil quantified by X-ray tomography. Geoderma 287, 71–79. doi:10.1016/j.geoderma.2016.06.026
Kassambara A, Mundt F (2017) ‘Factoextra: extract and visualize the results of multivariate data analyses. https://cran.r-project.org/package=factoextra.’
Katuwal S, Moldrup P, Lamandé M, Tuller M, de Jonge LW (2015) Effects of CT number derived matrix density on preferential flow and transport in a macroporous agricultural soil. Vadose Zone Journal doi:10.2136/vzj2015.01.0002.
Kay BD, Vanden Bygaart AJ (2002) Conservation tillage and depth stratification of porosity and soil organic matter. Soil & Tillage Research 66, 107–118. doi:10.1016/S0167-1987(02)00019-3
Koestel JK, Moeys J, Jarvis NJ (2011) Evaluation of nonparametric shape measures for solute breakthrough curves. Vadose Zone Journal 10, doi:10.2136/vzj2011.0010.
Koestel JK, Moeys J, Jarvis NJ (2012) Meta-analysis of the effects of soil properties, site factors and experimental conditions on solute transport. Hydrology and Earth System Sciences 16, 1647–1665 doi:10.5194/hess-16-1647-2012.
Kutílek M, Nielsen DR (1994) ‘Soil hydrology.’ (Catena Verlag: Cremlingen-Destedt, Germany)
Larsbo M, Koestel J, Kätterer T, Jarvis N (2016) Preferential transport in macropores is reduced by soil organic carbon. Vadose Zone Journal 15, doi:10.2136/vzj2016.03.0021.
Legland D, Argada-Carreras I, Andrey P (2016) MorphoLibJ: integrated library and plugins for mathematical morphology with ImageJ. Bioinformatics 32, 3532–3534.
Luo L, Lin H, Schmidt J (2010) Quantitative relationships between soil macropore characteristics and preferential flow and transport. Soil Science Society of America Journal 74, 1929–1937 doi:10.2136/sssaj2010.0062.
Magesan GN, Vogeler I, Clothier BE, Green SR, Lee R (2003) Solute movement through an allophanic soil. Journal of Environmental Quality 32, 2325–2333. doi:10.2134/jeq2003.2325
Merwin IA, Stiles WC, van Es HM (1994) Orchard groundcover management impacts on soil physical properties. Journal of the American Society for Horticultural Science 119, 216–222.
Mirlean N, Roisenberg A, Chies JO (2007) Metal contamination of vineyard soils in wet subtropics (southern Brazil). Environmental Pollution 149, 10–17. doi:10.1016/j.envpol.2006.12.024
Müller K, Katuwal S, Young I, McLeod M, Moldrup P, de Jonge LW, Clothier B (2018) Characterising and linking X-ray CT derived macroporosity parameters to infiltration in soils with contrasting structures. Geoderma 313, 82–91. doi:10.1016/j.geoderma.2017.10.020
Nagajyoti PC, Lee KD, Sreekanth TVM (2010) Heavy metals, occurrence and toxicity for plants: a review. Environmental Chemistry Letters 8, 199–216 doi:10.1007/s10311-010-0297-8.
Naveed M, Moldrup P, Arthur E, Wildenschild D, Eden M, Lamandé M, Vogel H-J, de Jonge LW (2013) Revealing soil structure and functional macroporosity along a clay gradient using X-ray computed tomography. Soil Science Society of America Journal 77, 403–411. doi:10.2136/sssaj2012.0134
Naveed M, Moldrup P, Vogel H-J, Lamandé M, Wildenschild D, Tuller M, de Jonge LW (2014) Impact of long-term fertilization practice on soil structure evolution. Geoderma 217–218, 181–189. doi:10.1016/j.geoderma.2013.12.001
Paradelo M, Moldrup P, Arthur E, Naveed M, Holmstrup M, López-Periago JE, de Jonge LW (2013) Effects of past copper contamination and soil structure on copper leaching from soil. Journal of Environmental Quality 42, 1852–1862. doi:10.2134/jeq2013.05.0209
Paradelo M, Katuwal S, Moldrup P, Norgaard T, Herath L, de Jonge LW (2016) X-ray CT-derived soil characteristics explain varying air, water, and solute transport properties across a loamy field. Vadose Zone Journal 15, doi:10.2136/vzj2015.07.0104.
Parker ML, Hull J, Perry RL (1993) Orchard floor management affects peach rooting. Journal of the American Society for Horticultural Science 118, 714–718.
Peth S, Horn R, Beckmann F, Donath T, Fischer J, Smucker AJM (2008) Three-dimensional quantification of intra-aggregate pore-space features using synchrotron-radiation-based microtomography. Soil Science Society of America Journal 72, 897–907. doi:10.2136/sssaj2007.0130
Pfaff JD (1998) Method 300.0 – determination of inorganic anions by ion chromatography. (U.S. Environmental Protection Agency: Cincinnati, OH).
Pietrzak U, McPhail DC (2004) Copper accumulation, distribution and fractionation in vineyard soils of Victoria, Australia. Geoderma 122, 151–166. doi:10.1016/j.geoderma.2004.01.005
Prado B, Duwig C, Hidalgo C, Müller K, Mora L, Raymundo E, Etchevers JD (2014) Transport, sorption and degradation of atrazine in two clay soils from Mexico: Andosol and Vertisol. Geoderma 232–234, 628–639. doi:10.1016/j.geoderma.2014.06.011
R Core Team (2017) ‘R: a language and environment for statistical computing.’ (R Foundation for Statistical Computing Vienna, Austria).
Six J, Bossuyt H, Degryze S, Denef K (2004) A history of research on the link between (micro)aggregates, soil biota, and soil organic matter dynamics. Soil & Tillage Research 79, 7–31. doi:10.1016/j.still.2004.03.008
Smith, GS, Buwalda, JG, Green, TGA, Clark, CJ (1989) Effect of oxygen supply and temperature at the root on the physiology of kiwifruit vine. New Phytologist 113, 431–437. doi:10.1111/j.1469-8137.1989.tb00354.x
Sun X, Ma T, Yu J, Huang W, Fang Y, Zhan J (2018) Investigation of the copper contents in vineyard soil, grape must and wine and the relationship among them in the Huaizhuo Basin Region, China: a preliminary study. Food Chemistry 241, 40–50. doi:10.1016/j.foodchem.2017.08.074
van Genuchten MT, Wagenet RJ (1989) Two-site/two-region models for pesticide transport and degradation: theoretical development and analytical solutions. Soil Science Society of America Journal 53, 1303–1310. doi:10.2136/sssaj1989.03615995005300050001x
van Schaik L, Palm J, Klaus J, Zehe E, Schröder B (2014) Linking spatial earthworm distribution to macropore numbers and hydrological effectiveness. Ecohydrology 7, 401–408 doi:10.1002/eco.1358.
Vanneste JL, Kay C, Onorato R, Yu J, Cornish DA, Spinelli F, Max S (2011) Recent advances in the characterisation and control of Pseudomonas syringae pv. actinidiae, the causal agent of bacterial canker on kiwifruit. Acta Horticulturae 913, 443–455. doi:10.17660/ActaHortic.2011.913.59
Vavoulidou E, Avramides EJ, Papadopoulos P, Dimirkou A, Charoulis A, Konstantinidou‐Doltsinis S (2005) Copper content in agricultural soils related to cropping systems in different regions of Greece. Communications in Soil Science and Plant Analysis 36, 759–773. doi:10.1081/CSS-200043367
Yao S, Merwin IA, Brown MG (2009) Apple root growth, turnover, and distribution under different orchard groundcover management systems. HortScience 44, 168–175.
Yu H, Ding W, Luo J, Geng R, Ghani A, Cai Z (2012) Effects of long-term compost and fertilizer application on stability of aggregate-associated organic carbon in an intensively cultivated sandy loam soil. Biology and Fertility of Soils 48, 325–336. doi:10.1007/s00374-011-0629-2
Zhang J, Xu Z, Li F, Hou R, Ren Z (2017) Quantification of 3D macropore networks in forest soils in Touzhai valley (Yunnan, China) using X-ray computed tomography and image analysis. Journal of Mountain Science 14, 474–491. doi:10.1007/s11629-016-4150-9
Fig. 1. (a) Total carbon concentration, (b) total nitrogen concentration, (c) pH and (d) total copper
concentration with depth determined for the soil cores from the organic and the integrated kiwifruit orchards. Presented are mean values and standard error of the means for depth intervals and three cores per orchard.
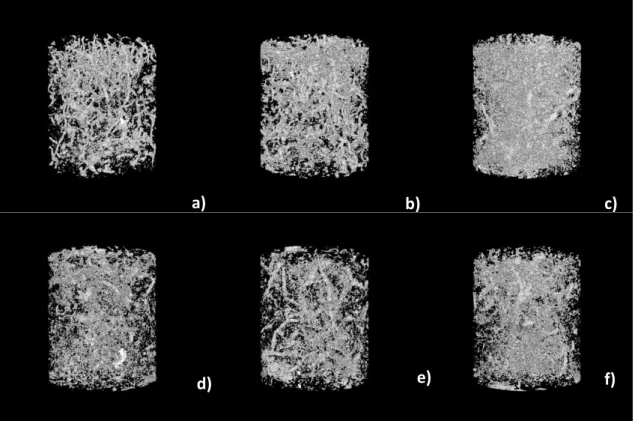
Fig. 2. 3D-macropore network determined via X-ray computed tomography in intact soil cores collected from
vine rows of the organic (a–c) and the integrated kiwifruit orchard (d–f). Pores >92 µm were considered as macropores in this study.
f)
c)
a)
e)
d)
b)
Fig. 3. (a) Macropore tortuosity, (b) connectivity, (c) number of pores and (d) circularity with depth
determined with X-ray CT for the soil cores from the organic and the integrated kiwifruit orchard. Presented are mean values and standard error of the means for depth intervals and three cores per orchard.
a)
b)
Fig. 4. Experimental data (EXP) and results of the OM-MADE modelling results for the three repetitions of
the transport experiments with bromide and the organic (a) O1 (b) O2 (c) O3 and the integrated (d) I1 (e) I2 (f) I3 kiwifruit orchard soil. The following model types were applied: (1) advection-dispersion equation (ADE), (2) mobile-immobile model (MIM), and (3) mobile-mobile model (MM). Results of the best fits for each soil core and the ADE model are shown.
a) b)
c) d)
Fig. 5. Principal component analysis. (a) The relation of the cores with the parameters visualised as vectors,
and (b) position of each core from the organic orchard (O1, O2 and O3) and the integrated orchard (I1, I2 and I3) in the new 2D-coordinate system. For an overview on the abbreviations of the parameters refer to Table 4.
a)
Fig. 6. Relationships between functional and structural soil parameters: (a) measured and predicted 5% arrival
time (AT), and (b) measured and predicted holdback factor (HB) considering the pore network parameters connectivity (EN) and tortuosity (T) and carbon (SOC) in a multiple regression analysis. The solid line represents the 1 : 1 line.
Measured 5% arrival time (-)
0.0 0.1 0.2 0.3 0.4 0.5 Pr ed ic te d 5% a rr ival ti me (-) 0.0 0.1 0.2 0.3 0.4 0.5 Organic Integrated a) 5% AT = -0.263 + 0.085 * SOC + 0.024 T R2 = 0.98 Measured holdback (-) 0.00 0.02 0.04 0.06 0.08 Pr ed ic te d h o ld b ac k (-) 0.00 0.02 0.04 0.06 0.08 Organic Integrated b) HB = 0.0925 - 0.0098 * SOC + 0.0011 T - 1.01 E-7 * EN R2 = 0.99
Fig. 7. (a) Total copper concentrations with depth before and after the transport experiments, and (b) copper
enrichment factor with depth in the soil cores from the organic and integrated kiwifruit orchards. Presented are mean values of three cores per orchard.
a)
Fig. 8. Measured and predicted copper (Cu) concentrations in topsoil of an organic and an integrated orchard
with depth (for details on depth intervals refer to text) using multiple linear regression modelling with pore network (equivalent pore diameter, d, and pore circularity, C) and basic soil parameters (pH and organic carbon content, SOC). The solid line represents the 1 : 1 line.
Measured copper concentrations (mg kg-1)
0 20 40 60 80 Pr ed icte d co p p er co n cen tr ati o n s (m g kg -1 ) 0 20 40 60 80 Cu = 180 + 6.1 * pH + 30.8 * C + 5.2 * SOC + 46.7 * d R2 = 0.85
Table 1. Generic soil profile description of the organic and integrated kiwifruit orchards located in the Bay of Plenty, New Zealand
Orchard Depth (m) Texture Sand (%) Silt (%) Clay (%) Carbon
(%) Bulk density (103 kg m−3) Organic orchard 0–0.3 Silt loam 41.34 35.64 23.02 5.94 0.865 0.3–0.5 42.84 41.64 15.52 2.87 0.936 0.5–1 54.32 33.98 11.70 1.83 0.943 Integrated orchard 0–0.3 Silt loam 46.40 31.64 21.96 2.46 0.987 0.3–0.5 43.40 40.14 16.46 1.41 0.961 0.5–1 55.90 29.14 14.96 0.51 1.014
Table 2. Parameters of the transport experiments with copper and the water tracer bromide through 111 mm-long intact soil cores with an ID of 104 mm collected from the organic (O) and the integrated (I) kiwifruit orchard in the Bay of Plenty, New Zealand
Core ID Bulk density (m3 m−3) Total porosity (m3 m−3) Pore volume (m3) Vol. water content (m3 m−3) Pore water velocity (m s−1)
Pulse duration in pore volume O1 0.81 0.696 5.77 × 10⁴ 0.624 3.04 × 10⁶ 0.144 O2 0.7 0.745 5.24 × 10⁴ 0.56 2.55 × 10⁶ 0.160 O3 0.78 0.706 5.45 × 10⁴ 0.586 2.94 × 10⁶ 0.154 I1 1.02 0.615 4.37 × 10⁴ 0.472 3.60 × 10⁶ 0.191 I2 0.99 0.626 4.85 × 10⁴ 0.509 3.42 × 10⁶ 0.180 I3 1.006 0.620 4.70 × 10⁴ 0.506 3.67 × 10⁶ 0.178
Table 3. OM-MADE modelled hydrodynamic parameters, variables for the transport experiments with bromide in the organic (O) and the integrated (I) kiwifruit orchard in the Bay of Plenty, New Zealand. The following model types were applied: (1) advection–dispersion equation (2), mobile-immobile model, and (3) mobile-mobile model. Results with the lowest normalised root mean square error (NRMSE) are shown
In the mobile-mobile model, θm is the fast mobile water content, θim is the slow mobile water content,
PWV is the flow rate in the fast mobile water phase, PWV2 in the slow mobile water phase, D* is the
dispersion coefficient in the fast mobile water phase, and D2* is the dispersion coefficient in the slow
mobile water phase
Core ID Mobile water content θm (m3 m−3) Immobile water content θim (m3 m−3) Pore velocity PWV (m s−1) Pore velocity PWV2 (m s−1) Dispersion coefficient , D* (m2 s−1) Dispersion coefficient , D2* (m2 s−1) Dispersivity , λ (103 m) Exchange rate, α (s−1) NMRSE (%) Model O1 0.624 0 3.1 × 10⁶ – 2.6 × 10⁸ – 8.38 – 5.6 1 O2 0.560 0 2.55 × 10⁶ – 7.47 × 10⁹ – 2.93 – 4.6 1 O3 0.586 0 2.94 × 10⁶ – 1.46 × 10⁸ – 4.99 – 5.3 1 I1 0.012 0.460 1.39 × 10⁴ – 1.83 × 10⁸ – 0.13 1.15 × 10² 2.7 2 I2 0.215 0.294 4.23 × 10⁶ 3.09 × 10⁶ 7.15 × 10 8 4.9 × 10⁹ 16.9 (1.58) 0 3.8 3 I3 0.052 0.454 3.54 × 10⁵ – 3.06 × 10⁸ – 0.86 1.75 × 10² 5.2 2
Table 4. Correlations between principal components PC1, PC2, PC3 and PC4 and the parameters included in the PCA. Boldfaced values are >0.7
Factor 1 Factor 2 Factor 3 Factor 4
Macroporosity, MP (%) −0.04 −0.95 −0.24 −0.10
Bounding box width – X, BBW-X (µm) 0.33 0.58 0.72 0.13
Bounding box width – Y, BBW-Y (µm) 0.40 0.75 0.48 −0.01
Bounding box width – Z, BBW-Z (µm) 0.22 0.18 0.96 −0.08
Equivalent pore diameter, d (µm) 0.17 0.07 0.97 0.06
Pore orientation x-axis, PO-X (°) 0.96 −0.11 −0.01 0.17
Pore orientation y-axis, PO-Y (°) 0.56 0.45 0.26 −0.49
Pore orientation Z-axis, PO-Z (°) 0.27 0.06 0.92 0.03
Surface area, SA (µm2) −0.06 −0.96 −0.24 −0.12 Euclidian distance, ED (µm) 0.29 0.45 0.84 0.00 Tortuosity, T −0.14 −0.95 −0.26 −0.05 Curvature, CV. (°) −0.12 −0.96 −0.23 −0.08 Sphericity, S 0.09 −0.92 0.17 0.23 Connectivity, EN 0.40 0.65 −0.46 0.08 Bulk density, BD (m3 m−3) −0.91 −0.28 −0.24 0.14
Volumetric water content, VWC (m3 m−3) 0.70 0.09 0.63 0.18
Total porosity, TP (m3 m−3) 0.90 0.28 0.24 −0.16
Mobile water content, MWV (m3 m−3) 0.85 0.30 0.39 0.13
Pore water velocity, PWV (m s−1) −0.77 0.19 −0.13 −0.58
Dispersivity, λ (103 m) −0.02 0.24 0.08 0.96
5% arrival time, AT 0.94 −0.20 0.18 −0.12
Holdback factor, HB −0.78 −0.58 −0.23 0.01