1996 Taurus/Sable and Mystique/Contour
Bumper Production Planning
by
Russell D. Crawford
B. S. Chemical Engineering, Stanford University, 1992
Submitted to the Sloan School of Management and the Department of Materials Science and Engineering in Partial Fulfillment of the Requirements for the Degrees of
Master of Science in Management and
Master of Science in Materials Science and Engineering at the
Massachusetts Institute of Technology
May 6, 1994
© 1994 Massachusetts Institute of Technology.
All rights reserved.
I Signature of Author
Certified b
IVV
-Department &f Materials Science and Engineering
/ Sloan School of Manageme t
,"J
I/
.May
,
19 94
y z ··-
*--Donald B. Rosenfield, Senior Lecturer Sloan School of Management Thesis Advisor
--- I4
Certified
by _
_ _
Thomas W. Eagar, POSCO ProPssor of Materials Engineering
Department of Materials Science and Engineering
Thesis Advisor
Accepted by
' ""-"Carl V. Thompson II Professor of Electronic Materials Chair, Departmental Committee on Graduate Students
Science MASSACHiS.T , !NST'.rL';F 'AUG 18 1994 LtBFR !Ei ( -.11· I
1996 Taurus/Sable and Mystique/Contour Bumper Production Planning by
Russell D. Crawford
Submitted to the Sloan School of Management and the Department of Materials Science and
Engineering in Partial Fulfillment of the Requirements for the Degrees of Master of Science
in Management and Master of Science in Materials Science and Engineering
May 6, 1994
Abstract
Numerous individuals have examined the problems of capacity allocation, scheduling, and inventory management in a manufacturing setting. In many cases, however, traditional manufacturing wisdom has failed companies of the United States in their efforts to maintain or regain their competitiveness vis a vis foreign competitors, particularly those located in Asia. This has led to new ideas regarding capacity allocation, scheduling, and inventory management.
In this thesis, a general paradigm for making capacity allocation decisions based on an examination of traditional line-balancing activities and an unbalanced, Theory of Constraints-based system is developed. Then, the resulting paradigm is applied to the capacity allocation decisions of the Milan Plastics Plant as it makes plans to introduce new products (the new Taurus/Sable and Mystique/Contour bumpers), and scheduling and inventory management procedures consistent with the capacity allocation decisions are developed. In the course of developing the general paradigm, several simple models are used to demonstrate the effects of different capacity allocations on line throughput in the presence of cycle time fluctuations. To assess the scheduling and inventory management
procedures developed for the real facility and to figure out how many wire frames the plant
should purchase for in-process inventories, a complex, detailed simulation effort was begun in conjunction with Rapistan Demag. Unfortunately, the simulation was not completed before the conclusion of the internship. The likely effects on the plant's
production system of the introduction of a new bumper raw material, thermoplastic olefin
(TPO), in the place of Xenoy, are also discussed.
Thesis Supervisors: Dr. Donald B. Rosenfield
Title: Senior Lecturer, Sloan School of Management Dr. Thomas W. Eagar
Acknowledgments:
The author wishes to acknowledge the Leaders for Manufacturing Program for its support of this work.
I owe a great deal of thanks to the people who follow, for I never could have survived the
internship, let alone write this thesis, without their assistance.
Ford Motor Company - Mark Blair, Roy Schlegel, Lori Friese-Baker, the Bumper
Scheduling Office (Dan Innes, Bob Barrett, Jim Dudley, Mike DeFran, Kim Behen, Amy Cline, and Genories Dunbar), Roy Davis, Alan Heneveld, Sheldon Kerper, Dan
Himebaugh, Rose Ryntz, Don Toeppe, Ron Clemons, Chad Jones, Mike "Robcad Master" Mott, Kevin Vliet, Scott McCormick, Dave Bucklin, Larry Clore, Joe Jelics, and everyone
else at Milan who helped out in one way or another. Special thanks also to Dave Esser, Fred Gamber, and Ron Horton from Saline and Pat Mulrooney and Pete Dragich from
PTPD Staff.
Technology Systems Corporation - Paul Henderson and Keith Krenz for making the "Jonah" Theory of Constraints class an amazing experience.
Finally, thanks to the Leland Stanford Junior University Marching Band for providing me with the most amazing four years anyone could ask for, Steven Williams, without whom I never would have survived Ch. E., Kathleen Findley, the high school chemistry teacher who started it all, the Lupines for Manufacturing of the Class of '94, and my parents, who didn't complain about the phone bills.
Table of Contents
Introduction ...
9
Where this document fits in ... 10
Chapter
1 ...
11
The Manufacturing Facility ... 11
The Current System of Production ... 11
The Future System . ... 13
Chapter
2 ...
15
To Balance or Unbalance ... 15
The Balanced Line ... 15
The Unbalanced Line ... . ... 16
Theoretical Simulations ... ... 17
Key Leamings from the Theoretical Simulations ... ... 22
Chapter
3 ...
26
Applying the Simulation Results to Solving Milan's Challenges ... 26
The Current System ... 26
Beneficial System Characteristics ... 27
Potential Opportunities for Improvement ... ... 27
Chapter
4 ...
34
The Future System ... 34
The TPO Production Process ... ...34
Why Use TPO ... 35
TPO's Effects on the Future System ... 37
Injection molding/tool room ... 39
Bonding/w elding ... 39
M onoplane ... 40
Packout .
...
42
Material Handling ... 43
Locating the Constraint ... ... 44
Chapter
5 ...
45
Production Management in 1995 . ... 45
General Operating Criteria for Each Area in 1996 ... 46
Monoplane
...
46
Selective I ... 47
Selective II ... ... 48
Injection
Molding
...
...
48
Bonding/Welding
...
..
...
... 49
Capacity Constrained Resources ... 49
Complete Production System Concepts ... 52
The Pull Concept (version 1) ... 52
The Pull Concept (version 2) Computer-assisted Mass Balancing ... 55
Aggressive ASRS Management ... 58
Chapter
6 ...
59
C onclusion ...
59
To Balance or Unbalance ... 59
Applying the Capacity Allocation Paradigm at the Corporate Level ... 59
Bibliography. ...
6 1
Appendix WitnessTM Results ... 62List of Figures Figure 1: Major process flows as of June 1993 .... .... ... ... 12
Figure 2: Futur e process flows ... 13
Figure 3: Experimental systems (balanced base cases) ... ... 18
Figure 4: Inventory growth as a function of time for the balanced system ... 20
Figure 5: Unbalanced system configuration ... 21
Figure 6: Typical TPO production process ... 35
Figure 7: TPO bumper fascia production flowchart...38
Figure 8: TPO surface morphology ... 41
List of Tables Table 1: Selected system characteristics ... 14
Table 2: Effects of cycle time fluctuations on a perfectly balanced, five machine line .... 18
Table 3: Effects of cycle time fluctuations on a pseudo-JIT perfectly balanced line ... 19
Table 4: Monoplane scheduling criteria ... 47
Introduction
Numerous individuals have examined the problems of capacity allocation, scheduling, and inventory management in a manufacturing setting. In many cases, however, traditional
manufacturing wisdom has failed companies of the United States in their efforts to maintain
or regain their competitiveness vis a vis foreign competitors, particularly those located in Asia. This has led to new ideas regarding capacity allocation, scheduling, and inventory management.
One of the most popular of these, which many companies use, or have tried to use, is
Just-In-Time (JIT), a system originally developed in Japan. This system maintains extremely low in-process inventories and a high degree of responsiveness, but also requires a degree of process control, if it is to be successful, that is extremely difficult to develop and practically unheard of in most U. S. companies. Unfortunately, most U. S. companies that have tried JIT simply pushed inventories onto their suppliers rather than truly eliminating them.
However, even if JIT implementation is successful, it often takes many years to develop the necessary understanding and control of the processes involved. With the recent rise in
the value of the yen, U. S. manufacturers have had more time than they appeared to have in
the mid-eighties to better understand their processes and improve them. But, many
companies either lack the time or the desire to spend the money and effort required since the
bottom line-driven need for improvement has diminished with the reappearance of
acceptable levels of profit.
Realization that U. S. manufacturers are unlikely to be willing to go through the rigors of getting control of every single process led Mr. Eliyahu Goldratt, an Israeli physicist turned management consultant, to develop Theory of Constraints (TOC). Notably different from JIT, it requires a high level of process control only over the constraint, or bottleneck process, and buffers other statistical fluctuations present in the system through inventory and excess capacity. The use of excess capacity as a type of buffer differs from traditional
line-balancing activities whose goal is to minimize the total line's idle time, preferably by
minimizing the idle time at each station. The goal in a Theory of Constraints system is to run the processes upstream and downstream of the constraint in such a way that it is never starved and never blocked. Thus, upstream processes produce only what the bottleneck
the bottleneck as quickly as possible. As long as the constraint is never starved or blocked,
the other resources should be idle or producing goods that will not interfere with the constraint's operations. As a result, the majority of in-process inventory resides in front of the constraint. Mr. Goldratt's plant unbalancing approach can be successful in reducing overall in-process inventory below the amount present in a traditional balanced-line, thereby improving the system's responsiveness, and can provide the plant's throughput
with greater protection against statistical fluctuations than JIT does.
Where this document fits in
Since there are a variety of different paradigms in existence that deal with capacity allocation, scheduling, and inventory management, a great deal of confusion exists as to which one is most appropriate for a given situation. The particular situation I considered was that of Ford Motor Company's Milan Plastics Plant, where it was clear from the outset that the degree of process control required for JIT was unlikely to be achieved because of a combination of limited engineering resources, large fluctuations in equipment operations, and equipment set-up requirements. Thus, I decided to investigate the appropriate usage of both balanced lines and unbalanced lines based on the Theory of Constraints since the
plant's management had recently developed an interest in the use of TOC.
In this thesis, I develop a general paradigm for making capacity allocation decisions based on an examination of traditional line-balancing activities and an unbalanced, Theory of Constraints-based system. Then, I apply the resulting paradigm to the capacity allocation decisions of the Milan Plastics Plant as it makes plans to introduce new products (the new Taurus/Sable and Mystique/Contour bumpers), and I develop scheduling and inventory management procedures consistent with the capacity allocation decisions. In the course of
developing the general paradigm, several simple models are used to demonstrate the effects
of different capacity allocations on line throughput in the presence of cycle time fluctuations. To assess the scheduling and inventory management procedures developed for the real facility and to figure out how many wire frames the plant should purchase for in-process inventories, a complex, detailed simulation effort was begun in conjunction with Rapistan Demag, a material-handling equipment vendor. Unfortunately, the simulation was not completed before the conclusion of the internship. I also discuss the likely effects on the plant's production system of the introduction of a new bumper raw material,
Chapter 1
The Manufacturing Facility
The Milan Plastics Plant makes a variety of injection molded and blow molded parts for Ford Motor Company, most notably fuel tanks and bumpers. Bumper production was selected for evaluation for several reasons: bumpers are the plant's most profitable product, the plant has had difficulty meeting customer demand with the current production system, and the new products and material coming in 1995 create the need for significant amounts of change.
The Current System of Production
The process flow for bumpers is fairly simple in that each part passes through at most four operations; however, there are many possible flows depending on part type (Figure 1). The bumpers begin as Xenoy plastic pellets which are injection molded into fascias and subassemblies. The subassemblies are joined to the fascia via an adhesive bonding or a linear welding operation. Then, the parts are painted the appropriate color on the monoplane paint system and prepared for shipment through either a packout cell, Selective II (a secondary paint and assembly station), or directly from the paint system depending on
the type of product Once the bumpers have been placed on an end-item rack, the racks are loaded into either a truck or rail car to make the trip to one of the assembly plants. Parts
whose paint job is unsatisfactory can usually be repaired through the Selective I operation
4Mlding ASRS WeUrg Bonding
IWldog
so/~g
L /" 4, \\nPairs Monoplane Selective I+
/repairs
ASRS/
N
Packout / Selective II I shtipping DockFigure 1: Major process flows as of June 1993
The bumpers travel through the system, with a few minor exceptions between molding and
bonding, on in-process racks. These racks have space for ten bumpers each and are carried
by Automated Guided Vehicles (AGVs) or an overhead Monorail system. All in-process inventory which is not being worked on or in-transit is contained in the Automated Storage and Retrieval System (ASRS). As a result, the total in-process inventory in the plant is controlled by the capacity of the ASRS, but the mix of products contained in the ASRS can
'N ke{
vary widely throughout the day. If for some reason the ASRS fills up, then some combination of molding and bonding/welding equipment that loads from the floor must be shut down until parts can be removed from the ASRS for shipment or are scrapped,
thereby freeing up in-process racks.
The Future System
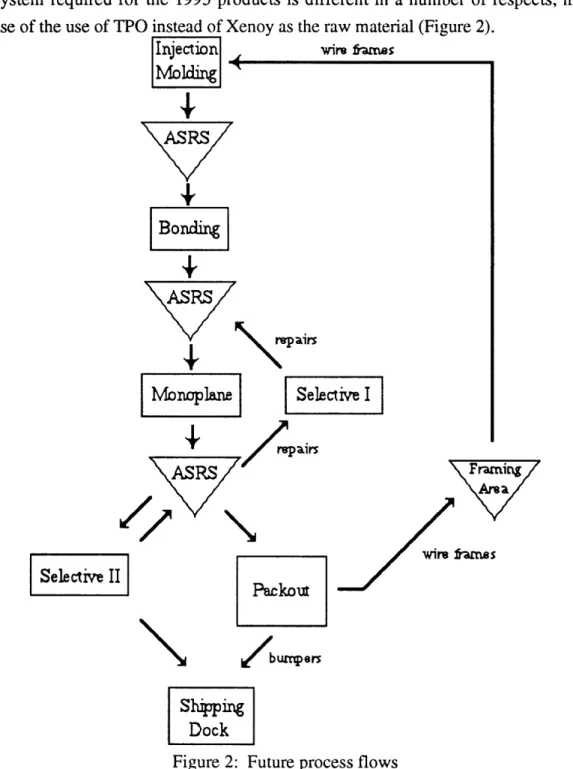
The system required for the 1995 products is different in a number of respects, mostly because of the use of TPO instead of Xenoy as the raw material (Figure 2).
IInjection , wire ames
IlJl
· ASRS\
repairs Selective I PI Selectie II 7. N , * \~~~~~~~I f I GruW sA-rrs I Shipping DockFigure 2 Future process flows
wire Afrn s
The most significant change is that neither bonding nor welding is required on the majority of the products the plant will be making (the ones made of TPO). However, a number of new difficulties exist. First, the racks for the new products can only hold six parts for the high volume TPO parts and eight for the lower volume Xenoy parts because of the parts' increased size. This decreases the capacity of the ASRS by about 20%, depending on the mix of parts in the ASRS at any given time, in spite of the addition of three crane bays which were built in 1993. Second, TPO parts are very soft and flexible compared to
current bumpers because of the material's properties and because the TPO parts do not have
subassemblies bonded or welded to them to provide them with rigidity. As a result, wire frames are required to support the parts while they are in-process. Thus, not only must an
in-process rack be available for a part to be transported by the Automated Material Handling
System, but the correct wire frame must be present as well. This requirement complicates
the scheduling problem, and creates the need for the framing area, where the frames a rack
is carrying can be exchanged for other kinds as needed. Third, all of the future parts
require substantially more assembly than they do today, so parts will no longer be shipped
directly from the paint system, and the Sable Rear Sedan bumper requires processing by both Selective II, for additional painting, and a Packout cell for assembly and preparation for shipment.
A more in-depth analysis of current and future system characteristics can be found in Chapters 3, 4, and 5. Table 1 provides a list of the types and quantities of equipment that
are used now and will be used in the future. The decreased in-process rack storage density
has a strong effect on the number of AGVs, ASRS Crane Bays, and ASRS In-process Racks.
Type of Equipment Current System Future System Injection Molding Presses:
Adhesive Bonders:
Linear and Sonic Welders:
Monoplane Paint Systems:
Packout Cells: Selective Decorating II:
Selective I (Repair): AGVs: ASRS Crane Bays:
ASRS In-process Racks:
19 17 7 5 8 2 1 1 4 5 1 1 1 1 23 29 10 13 2100 2800
Chapter 2
To Balance or Unbalance
A basic question that must be asked when setting up a production system is how capacity should be allocated. Since I hoped to apply the results of my analysis of this problem to Milan, I limited myself to those paradigms which I thought had the best chance of being successfully applied there. Those paradigms were the traditional balanced line and the
unbalanced line advocated by Theory of Constraints.
The Balanced Line
Nahmias1 provides a description of the assembly line balancing problem and procedures for solving it. The problem is a set of i distinct tasks that have to be completed on each
product. The required time for each task is a known constant ti. The objective is to group
the tasks at a series of workstations so that all workstations have the same cycle time. In most real-world applications, the goal is to arrive at a minimum total idle time for all workstations given a target cycle time based on the production rate. An iterative approach
based on varying the target cycle time and number of stations allows the total idle time to be
established at most any desired level. However, the cost of the stations and the indivisible
nature of some processes generally limits how close to zero the idle time can get. Nahmias
provides examples of numerous procedures that have been developed to solve the
line-balancing problem.
However, some question exists as to whether the goal of minimizing idle time really has the
equivalent effect of maximizing profit. Carlson and Rosenblatt2 suggest otherwise, as does
Goldratt3. An optimal balance for a fixed cycle time may not be optimal in a global sense,
especially when factors like cycle time fluctuations and downtime are considered. One also has to consider the cost of capital equipment per unit of capacity for the different processes involved.
1Nahmias, Steven. Production and Operations Analysis. Boston, MA: Irwin, 1989, pp. 322-28. 2Carlson, R., and M. Rosenblatt. "Designing a Production Line to Maximize Profit." IEE Transactions
17, 1985, pp. 117-22.
3Goldratt, Eliyahu M. and Robert E. Fox. The Race. Croton-on-Hudson, NY: North River Press, 1986,
The Unbalanced Line
Realizing that factors like cycle time fluctuations and downtime should be considered since they exist in real factories, Goldratt developed a philosophy based on the notion of bottlenecks. Nahmias4 provides a list of nine principles which make up the Theory of Constraints philosophy, which I quote:
1. Balance flow, not capacity. The idea behind this principle is to focus on maximizing the
total flow through the system rather than trying to balance work loads. Effective use of
imbalance minimizes the likelihood that time is lost at bottlenecks.
2. The level of utilization of a nonbottleneck is determined not by its own potential, but by some other constraint in the system.
3. Utilization and activation of a resource are not synonymous. Activating an unneeded
resource [unneeded by the bottleneck resource, that is] does not correspond to intelligent utilization of that resource. There is no benefit to running [a resource upstream of the
constraint] if [the constraint] cannot absorb its output.
4. An hour lost at a bottleneck is an hour lost for the total. If poor scheduling results in a bottleneck machine being left idle, or a breakdown occurs at a bottleneck, the lost time can
never be recovered and the production flow will decrease.
5. An hour saved at a nonbottleneck is a mirage. Saving time or increasing production at a
nonbottleneck location will have no effect on the system production rate.
6. Bottlenecks govern both throughput and inventory in the system. One purpose of inventory is to keep bottleneck machines busy. Improper planning of work-in-process
(WIP) inventories can adversely affect product flow.
7. The transfer batch might not, and many times should not, be equal to the process batch. The transfer batch is the number of units transported from one work center to another, and the process batch is the size of a production or process run. Because setup costs for processing and transporting are different, batch sizes should be different. The idea here is
4
to encourage lot splitting, which is especially difficult when scheduling by [Material Requirements Planning]. In some circumstances, lot splitting may increase throughput.
8. The process batch should be variable, not fixed. Lot sizing should depend upon the
schedule and the operation.
9. Schedules should be established by looking at all of the constraints simultaneously.
The basic idea of TOC is to identify the system's constraint(s), and then squeeze every bit of productive capacity out of them through scheduling, set-up time reduction, and process improvements. If the level of system throughput is still unsatisfactory once the constraint has been fully exploited, then the constraint should be broken by the addition of capacity,
and the new constraint should be located and managed in the same way as the first. There are certain characteristics which can guide an individual engaged in system management in
determining where to permanently locate their system's bottleneck. These characteristics
will be explored later in the chapter.
Theoretical Simulations
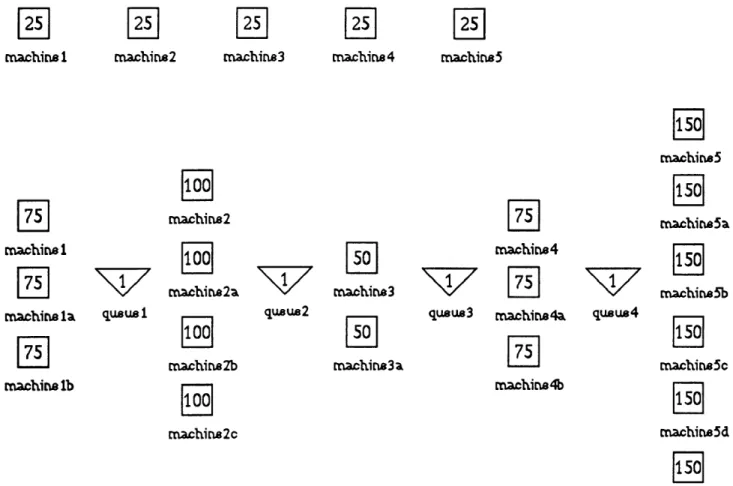
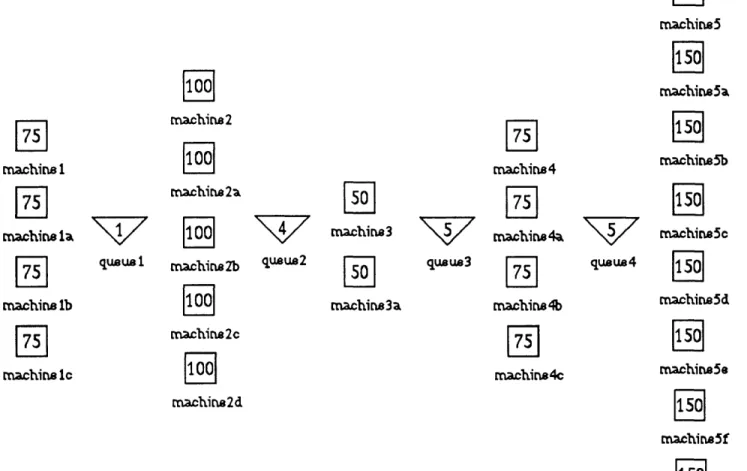
The best way to evaluate the claims of the two paradigms is through simulation. I used WitnessTMby AT&T ISTEL to investigate the effects of cycle time fluctuations on the
performance of two simple production systems. The first system is a line of five workstations that are perfectly balanced, and the second system is a somewhat more
complicated set-up involving multiple machines in parallel. The base case for each system,
with deterministic cycle times shown in each machine's box, is presented in Figure 3. Each run of the simulation consisted of a 10,000 time unit initialization period followed by a run of 100,000 units of time. Detailed data on each run of the simulation can be found in
machins2 quseue 1 machins3 machins2 machine 2a machins2b machins2c qu1u2quua2 machins4 machine3a machina93a [25 machine5 qusus3
Figure 3: Experimental systems (balanced base cases)
Cycle Time Buffers Throughput Avg. Time Avg. W.I.P.
Table 2: Effects of cycle time fluctuations on a perfectly balanced, five machine line
The first series of experiments, displayed in Table 2, examined the effects of cycle time fluctuations on a perfectly balanced line. The cycle time was first set at a deterministic length of 25 units. It was then varied between the figures shown using a uniform distribution. Without any buffers, throughput declined from 4,000 pieces in 100,000 units of time to 2,972 units when the cycle time could vary from 10 to 40 units of time in duration. With the addition of "infinite" buffers, throughput rose to 3,953 pieces in
machine 1 machine 1 machin la machine lb machine4 machinr4a machins4b qusus4 machine5 machins5a machine5b machine5 machinse5d machina5e 25 none 4000 124.84 5.00 20- 30 none 3,589 132.90 4.78 10 - 40 none 2,972 149.37 4.45 10- 40 infinite 3,953 1480.5 59.62
100,000 units of time, generating an average work-in-process inventory of 59.62 pieces. However, is this level of inventory stable? To investigate the stability of the inventory, I
ran this case for a longer period of time.
A fundamental principle of the balanced line is that every operation must be kept busy all the time in order to maintain throughput. A look at the machine statistics for this run indicate that the line's "efficiencies" were very high: the "least efficient" operation was busy 98.34% of the time. As the simulation ran for longer periods of time, the line's "efficiencies" continued to grow; however, so did the amount of inventory in the system. At the end of 500,000 units of time, the average work-in-process inventory had grown to
108.82 pieces, and the average time to complete an order had increased from 124.84 units
in the deterministic cycle time case to 2,721.3 units at the end of 500,000 units of time in
the largest cycle time variation case.
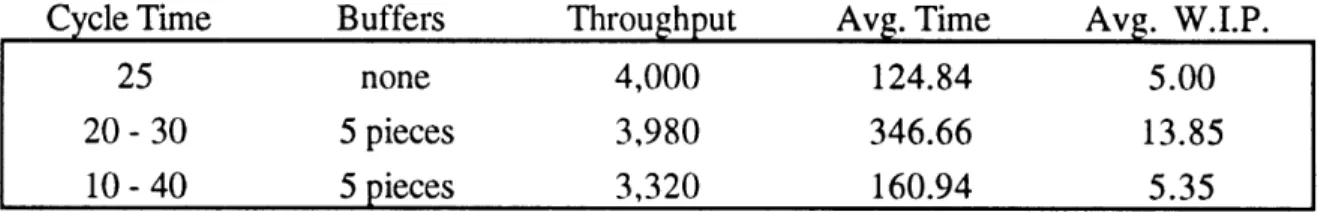
The other question that can be addressed with this experimental scenario is whether the explanation of JIT presented in the opening paragraph of this paper is correct. Namely, does reducing a system's fluctuations decrease the amount of inventory required? To investigate this idea, I pretended that I was an American who went to Japan in the early eighties, came back fixated with the idea that low inventories was the key to success, and immediately implemented a policy of at most 5 pieces of inventory between operations without otherwise changing the operations' characteristics. As is clearly shown in Table 3, as fluctuations increase, throughput falls.
Cycle Time Buffers Throughput Avg. Time Avg. W.I.P.
25 none 4,000 124.84 5.00
20 - 30 5 pieces 3,980 346.66 13.85
10 - 40 5 pieces 3,320 160.94 5.35
Table 3: Effects of cycle time fluctuations on a pseudo-JIT balanced five machine line
The balanced, deterministic line requires no inventory at all; the line with 10 to 40 second fluctuations requires a lot more inventory than 5 pieces between operations to maintain throughput (as was demonstrated above). The pseudo-JIT lines take less time to complete an order because they have less in-process inventory, with average times of 346.66 time units and 160.94 time units respectively compared with the deterministic case of 124.84 time units.
Having uncovered increases in inventory and decreases in responsiveness in the balanced line if it were allowed sufficient inventory to maintain throughput, I developed a similar production system which would allow me to determine the effects of unbalancing the system. Again, the base case of the system is perfectly balanced (bottom portion of Figure 3), and with deterministic cycle times has identical throughput to the previous system's base case. With the introduction of a plus or minus 50% variation in cycle time of each
machine, and maintaining a buffer with a capacity of 1 piece between each set of machines,
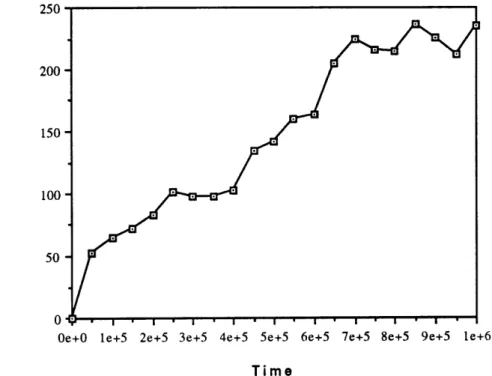
throughput dropped to 3,600 pieces in 100,000 units. With the adoption of "infinite" buffers between each set of machines, throughput rose to 3,936 pieces in 100,000 units. However, the amount of inventory required to maintain this level of throughput grows with
time, as is shown in the graph in Figure 4. Average time to complete an order grew over
the same period from 464.58 units for the deterministic case to 2370.1 units at 500,000 units. 250 200 150 L o 0 Ca r 0I 100 50 0
Oe+O le+5 2e+5 3e+5 4e+5 5e+5 6e+5 7e+5 8e+5 9e+5 le+6
Time
Figure 4: Inventory growth as a function of time for the balanced system
To combat the growth in inventory and corresponding decrease in responsiveness, Goldratt
recommends an unbalanced line: such a line allows achievement of JIT's low inventories and high responsiveness without variability reduction of all processes. To examine the
validity of Goldratt's view of the world, I tried unbalancing the second system by adding capacity in the form of additional machines. In doing this, I followed the methodology advocated by Technology Systems Corporation (a Goldratt Institute affiliate) which is to
have increasing capacity up to the bottleneck operation and increasing capacity downstream
of the bottleneck. In this way, the operation directly preceding the bottleneck and the last operation in the production system have the greatest capacities. The resulting system is displayed in Figure 5. machine 1 machin la machi n lb machine lc queue 1 machins2 mrachins2a machineZb machine2c machine2d quue2 machine3 machins3a
7U7
queu3 machins4 machins4a machine4b machine4c77q4
queue4 machine5 1150 machine5a machine5b machin5c 11501 machine5d machine5e machine5f machinegFigure 5: Unbalanced system configuration
This configuration achieved not only throughput similar to the deterministic case (4020 pieces), but did it with an average inventory of 25.01 pieces and an average time to complete an order of 618.22. These figures compare favorably with the deterministic case of average inventory of 18.67 pieces and average time to complete an order of 464.58. Best of all, the inventory does not grow as long as the upstream operations are gated in
some fashion based on what the bottleneck operation can produce. In this example, the
upstream inventory is capped.
One could complain about only 75% utilization of some machines. The response is not that
these machines should not be allowed to sit idle if there is something useful for them to make, but rather that they should not be activated to make more things than the constraint operation can use. If, however, an opportunity exists for these machines to make a product which does not require the constraint process, then they should do so.
One could argue that better results in terms of efficiency and responsiveness could be obtained by capping the inventory in the balanced system case. I tried capping the buffers
at 5 pieces between each set of machines. Average inventory was 27.45 pieces and average
time to complete an order was 700.89 units. However, throughput was only 3,887 pieces even with 98% efficiencies. This is another excellent example of how one cannot hope to reduce inventory without considering the fluctuations present in the system unless one is
indifferent to the resulting throughput.
Key Learnings from the Theoretical Simulations
While we recognize that the unbalanced line has more total processing capacity, these
simulations give us a lot to think about. First of all, it should be clear by now that JIT
works, but successful implementation requires reduction in the variation of each of the processes so that the system of production can be responsive. Understanding the reason
JIT works is important: hopefully no one is going to run out into their plant and order a
reduction in work-in-process inventories without dramatically altering the operating
characteristics of their equipment.
Then there is the traditional perfectly balanced line concept. We have seen that such a system can produce reasonably high levels of throughput, but at the cost of a slow growth of in-process inventory and a corresponding decline in responsiveness. In some industries, this may not be that big of a problem; however, in many industries, inventory and the corresponding lack of responsiveness result in disaster when competitors live in low-inventory/rapid response environments.
The unbalanced line can enable high levels of throughput in spite of variation and achieve a
between JIT, a traditional balanced line, and an unbalanced line that must be considered are:
1) is the inventory reduction and increased responsiveness is worth the additional
expenditure required to either unbalance the line or dramatically reduce variation, and 2) is a balanced line is achievable. In the case of 1), a major obstacle to JIT is where the lifetime
of the product and/or processes is less than the amount of time required to gain control of the processes (microprocessor fabrication, for example). In the case of 2), the nature of the processing equipment may force an unbalanced line either by having very different costs per unit of capacity or simply by not coming in divisible blocks of capacity enabling balance. Clearly, all three options should receive careful consideration before one is
selected, and all of the relevant benefits and costs need to be factored in.
My statement that the growth of inventory for a balanced line will be slow depends on the line being perfectly balanced. However, is it possible to achieve a perfectly balanced line in
reality where fluctuations of all kinds abound in the forms of quality, absenteeism, and
breakdowns and the cost of a unit of capacity varies widely from one machine to another? I personally doubt if more than a handful of perfectly balanced systems of production exist in the world. And yet our measurement systems encourage every machine to run all the time.
But, I have just said that most systems of production are somewhat unbalanced. The result will be that inventory will grow very rapidly in front of the bottleneck operation while the
downstream operations are starved. This is the case in Alex Rogo's plant in The Goal, and I am confident that most facilities operating on the basis of Labor and Overhead accounting
or piece-rate incentive systems whose foremen or operators can pull raw material into the first operation regardless of inventory levels downstream are experiencing this very phenomenon. Unfortunately, a plant run in this manner can potentially tie up too much cash in inventory, potentially resulting in bankruptcy. Thus, traditional manufacturing
measurement systems need to be altered to reflect the at least somewhat unbalanced reality
of most plants.
Exactly how capacity should be allocated is determined by price and operating costs of the equipment or logical functional assemblages (the most expensive per unit of capacity makes an attractive constraint), the statistical fluctuations present (pieces of equipment that experience a lot of fluctuations or have the processes upstream of them experiencing a lot of fluctuations need excess capacity, and a reliable constraint is key), and the yields of the proposed constraint and the equipment downstream (poor quality parts means wasted constraint time). The end goal is to minimize the amount of constraint time lost in non-productive applications (set-ups, downtime, starvation, blockage, and scrap generation).
Preventive maintenance, while adding to constraint downtime, will actually increase the time available for production if it is successful in preventing a larger amount of breakdown time than was required for the preventive maintenance. Only breaking even in terms of time spent maintaining vs. time saved from breakdowns is helpful in that the ability to control the scheduling of preventive maintenance is vastly preferable to the disruptive randomness of breakdowns.
Other potential benefits of unbalanced lines exist as well. One is in the area of inventory
management: in general, unbalanced lines with substantial statistical fluctuations are able to
operate without continuously growing inventory found in balanced lines while maintaining a similar level of throughput because of the presence of excess capacity which serves effectively as a buffer. Minimizing inventory is important when short lead times are important, carrying costs are high, no space is available for inventory storage, risk of obsolescence of inventories is high, and/or quality concerns are frequent.
Another potential benefit exists when a plant is being laid out. When designing an unbalanced line, a larger margin for error exists for all operations other than the bottleneck resource without effecting the plant's ability to produce at close to its designed volume. For a balanced line, all of the operations need to be predicted correctly. Therefore, it should be no surprise that in most industries, balanced lines are designed for substantially
higher capacities than are really desired in hopes that the real line put in place will have the
desired capacity. Of course, if the designer gets the constraint wrong, then the plant will have problems. However, it's easier to focus one's attention and resources on one element
rather than trying to get every element perfect.
A third potential benefit exists in increasing plant capacity. It is substantially easier to increase the capacity of an unbalanced line since the constraint and items that adversely
affect the constraint are the items upon which improvement efforts are focused. Being able
to focus the often limited resources of a plant is much more likely to result in a large improvement than scattering the available resources over numerous improvement efforts. Once the constraint is maximized, the purchase of an additional constraint machine can result in a large increase in capacity. To reach a similar improvement in throughput in a balanced line, every operation's capacity must be improved, and each individual improvement will probably be viewed as disappointing, causing the discontinuation of the improvement efforts.
The bottom line is that from a throughput standpoint, a variety of feasible operating patterns
exist. There are many factors that need to be considered when deciding between them, such as the relative costs of capacity and inventory, and the individual plant's manufacturing strategy should be one of them. In a variety of industries, responsiveness to the customer is everything; in others, inventories may not be much of a liability. Clearly, the best way to make the correct decision is to accurately model the proposed facility and consider what its competitive environment will be.
Chapter 3
Applying the Simulation Results to Solving Milan's Challenges
The general paradigm developed in Chapter 2 is that if fluctuations are present and low inventories/high responsiveness are required, the more likely it is that an unbalanced line makes sense. It is important to realize that, in the majority of real-world cases, building a
new plant is not an option. Instead, like at Milan, the goal is to improve the operations of
an existing facility. In the case of the real plant, the differences between the pieces of equipment are dramatic: the cost of incremental capacity varies from over $90 million for
the monoplane paint system to $1 million for a packout cell, and statistical fluctuations vary
tremendously in terms of yield, downtime, and operating rate of each piece of equipment.
Furthermore, the plant does not have room for another paint system even if the money were
available. Therefore, an unbalanced line seems to make a lot of sense since it would assist in squeezing every last bit of productivity out of the most expensive resource (the
monoplane). Milan also has an Automatic Storage and Retrieval System which contains all of the plant's inventory and is of finite capacity; therefore, inventory must be maintained at a level less than the capacity of the ASRS.
An examination of both the current and future operating environments will prove that an unbalanced system is an important part of solving the problems the plant experiences and
that the monoplane is where the constraint should be located. The other factor that will then have to be considered is how the plant should be scheduled and the inventory managed with the monoplane as the constraint. This will be covered in Chapters 4 and 5.
The Current System
As discussed in Chapter 1 (Figure 1), the bumper process flow is not particularly complex.
The major problems the plant experiences take the form of premium transportation: use of trucks and airplanes instead of railroad cars, and heavy use of weekend overtime. The following is a list of what I feel were the strong points and weak points of the plant's
operations during May through July of 1993 which affected the plant's ability to satisfy
customer demand in a cost-effective manner. As will be further explained at the conclusion
of this section, such a list is inherently time-dependent and portions of this listing
Beneficial System Characteristics:
* Packing out parts to the floor at the monoplane. This action decreases the amount of time
parts spend occupying in-process racks and decreases the load on the final assembly cells, thereby making more ASRS capacity available and protecting the constraint from being shut down because the ASRS is full.
* Packing out parts at Selective II. This action also decreases the amount of time parts
spend occupying in-process racks and decreases the load on the final assembly cells. It is
less effective in decreasing time spent in in-process racks than packing out parts to the
floor because parts have to travel to Selective II from the monoplane, however.
* Pushing parts across the floor from molding to bonding. This action decreases in-process rack usage and makes molding more responsive to its customer because of space
limitations on floor inventory storage and ease of communication between the operations.
* Total Cost Accounting. Most of the causes of undesirable effects can be traced to Labor
and Overhead/Local Optimization-style thinking (the need to run all of the equipment all of the time).
* The ASRS. It caps total inventory and by doing so helps identify problem areas (the
rocks are exposed since the pond can't fill up beyond a certain point).
Potential Opportunities for Improvement:
Note: by listing an item below I am not indicating that it was financially or even physically possible to correct it.
Molding:
* Molding must become more responsive to bonding/welding requirements than it is currently. The responsiveness must include a willingness to start, stop, or change tools as required. As the first operation, molding must react to all downstream fluctuations in yields and downtime. Lack of responsiveness can fill up the ASRS with parts unneeded by the constraint, adversely affecting the monoplane and the bonders/welders which require empty in-process racks in order to operate.
* Mold change times are far from world class, resulting in less available press capacity and
flexibility and larger than desirable batch sizes. If mold change times dropped dramatically, presses could be sold to other plants or could be used to make additional mold and ship parts which do not require painting. If presses could be kept busy doing something else, there also wouldn't be any pressure to make bumpers when they're not wanted.
BondingAV/Welding:
* Bonding/welding machines are the plant's constraint (during May - July). Therefore, Overall Equipment Effectiveness ratios (percent of good parts made X percent of theoretical speed equipment is run X percent of machine availability) of 60-65% are not
good, especially since many cells are dedicated to one or two products. Since most of the problem is machine availability, steps should be taken to increase it.
* Shutting down of bonders because the ASRS is full is extremely detrimental to plant throughput when they are the plant's constraint. Rigid enforcement of the number of parts allowed in front of Selective I, Packout, and Selective II, even if it means overtime in those areas on the weekends, is critical to ensuring the supply of empty in-process
racks that the monoplane and the bonders require.
Monoplane:
* When the monoplane is a non-constraint machine, it should not be running all the time. If it were not for the lower than desirable first-run and the ability to repair and repaint most poor quality parts, the monoplane would be starved in spite of the heroic efforts of scheduling to find something for it to paint. Running it six and one-third days a week under these circumstances generally doesn't make sense. If customer-required bonded stock is not available, and there are no repairs waiting to be painted, the monoplane should be shut down.
* When the monoplane is not the constraint, appropriate preventive maintenance should be performed without hesitation under most operating circumstances. Since color change times would be reduced to be equivalent to a style change if the preventive maintenance were performed, there's no reason not to do it. Maintenance does not cost any
throughput most of the time, and if not doing it is adversely affecting yields, it is
extremely important that it be done.
* First-run yield is less than 100%. Therefore, parts with constraint time invested in them
are potentially wasted. Repairs can fill up the ASRS and force the plant to shut down its
constraint, with dire consequences for future throughput.
* Repaired parts can't be painted most colors. Therefore, parts with constraint time invested in them are potentially wasted if the customer doesn't want them in that color. Monoplane also lets repairs build up in the ASRS sometimes, again affecting the
constraint. Selective I can be guilty of this as well in its attempts to locally optimize labor
usage.
* Batches much larger than customer demand are routinely painted. Parts painted in excess of customer demand are wasted if there is demand with equivalent priority (due date) for the part in a different color and sufficient bonded stock is unavailable (which is almost always the case since bonding is the constraint and the monoplane runs most of the time). Batches in excess of customer demand also require the customer to carry additional inventory. Therefore, emphasis on reducing the number of color changes and running large batches does not make sense in today's (May - July) environment. Unfortunately, yield is especially poor for batches of fewer than 120 parts, and 120 parts can represent a week or more of demand for certain low volume colors.
* Monoplane yield is unpredictable. Therefore, "extra" parts have to be sent to be painted to have any hope of getting the right number out.
* Attempts to satisfy all service parts from repair parts is not always productive. If
insufficient demand for service exists, it would be better to take the parts out of the ASRS
and scrap them (if necessary) than to allow them to sit in the ASRS, occupying valuable in-process racks, for long periods of time.
Packout:
* The cells are treated as if they are largely dedicated, meaning that if one breaks down, one or more products is not being shipped and the ASRS is at risk of filling up. The area is also unwilling/unable to adapt to large batches of one particular type of product if the
monoplane paints it because the customer needs it, forcing product to sit in the ASRS longer.
* Packout supervisors take parts that could be packed out at Selective II simply to keep busy. This can create problems in that, sooner or later, a big batch of packout-only parts will come along and have to wait for the "stolen" parts to be packed out. This state
decreases in-process rack availability, thereby threatening the constraint.
* Packout supervisors do not like to deal with small batches of parts and certain types of parts. These parts sit in the ASRS, occupying in-process racks. Since packout can take
parts from Selective II, there is even less incentive to get small batches out of the ASRS.
Systemic Issues:
* The assumption when the plant was laid out that there would be no breakdowns, no scrap, no repairs, and extremely flexible equipment is a major obstacle to successfully operating the plant in a world where breakdowns, scrap, repairs, and rigid equipment exist. Since the reality is substantially different, the plant is having difficulties at times. For example, the ASRS was never intended to house repairs; however, it often fills up with repairs.
* Body & Assembly, not the ultimate customer, determines what a quality bumper is.
Using the requirements of the person who goes to the dealership and buys the car could
dramatically impact the amount of repairs and scrap Milan generates, particularly in the area of paint defects since many of the current defects occur in areas not visible to the consumer. Not using the voice of the customer when the plant's capacity hinges on its
paint system could be creating substantial inefficiencies.
* Emphasis on quantities produced rather than the mix of products produced does not meet the needs of the assembly plants. To maximize plant output, there should be only one product to which all pieces of equipment are dedicated, and it should only come in one color (early 1900's Ford). The plant would not be in business for long today. While this situation is extreme, too much emphasis on quantities produced can drive behaviors that resemble this scenario, though. Many of the phenomena detailed above are driven by a lack of emphasis on producing the correct mix. Color and style changes on the monoplane are not the plant's biggest downtime cost like the Quality Office Pareto chart
shows they are. They are a necessary cost of doing business, and the monoplane is usually not the constraint operation. Making the right mix requires set-ups and color changes, but the right mix is what the customer wants. Ignoring that fact leads to much
of the expediting and premium freight that occurs, as well as excess inventory.
· Labor and Overhead thinking results in local optimization of each resource rather than simply being concerned about the entire plant. With Total Cost accounting, equipment does not need to run all the time to meet financial objectives. Therefore, do not run injection molding presses all the time (at least on things that need to be welded or bonded). Make only what is needed by the constraint; work-in-process inventories
beyond constraint requirements use capital and ASRS space unnecessarily.
* Everyone in the plant thinks they are a scheduler. Scheduling, not production, is the only
function that has the customer requirements information necessary to make optimal decisions from the entire plant's perspective. Persons not working in the scheduling area should not be engaged in second-guessing. If scheduling is in control and customer needs are not met, at least then it would be easier to identify what procedure or policy needs to be altered.
* Mistagged/misidentified items are a major obstacle to meeting customer requirements. It is impossible to schedule the plant correctly when data about work-process and in-transit inventories are wrong, and it is very difficult to correct for last minute discovery of
mistakes when the plant is three days by rail away from the customer. Operators should
be given the authority and responsibility for making certain that the parts they work on are correctly identified. Far too much management time is spent meeting about the issue of negative work-in-process inventories, and having to keep much of the shop-floor inventory management system turned off because of problems with data integrity deprives schedulers of a useful source of information.
* The premium transportation budget should be eliminated. Every case should be scrutinized for opportunity to improve operations so that the problem won't happen again. Better investigation of the cause would provide the opportunity to justly charge the responsible operation for the premium transportation as an unbudgeted cost. Hopefully, this would provide an incentive for premium transport reduction, thereby freeing up money for process improvements and people to increase throughput and increasing customer satisfaction and the plant's profitability.
* A combination of downtime and poor first-run yield can make molding,
bonding/welding, the monoplane, or packout the "real" constraint which should be managed at any given time. Unfortunately, bonding/welding and packout do not have sufficient excess capacity to recover from statistical fluctuations, and molding (particularly tool availability) and monoplane problems can last long enough that the customer is affected. The "moving bottleneck" phenomena also makes it difficult for
scheduling to schedule the plant correctly to maximize throughput since the situation is so
dynamic. The constantly changing system makes it difficult for individuals unfamiliar with the performance of the entire system at a given time to understand why certain
actions are being taken, and can result in indecision even among individuals familiar with the whole situation when a rapid response is of great importance (a rapidly filling ASRS,
for example).
*The current solution to the previous problem is running weekends and using premium transportation. Both are expensive, and both may not be enough to recover if one or more pieces of equipment run extremely poorly. Also, the mix of processes run over the weekend can leave the plant in a poor situation for meeting the next week's production
needs (not enough bonded stock and/or too much inventory piled up in the ASRS in front of Selective I, Selective II, and/or packout).
Clearly, as is common in most manufacturing facilities, there are a wide variety of causes of undesirable effects. The four biggest issues during the May through July 1993 period were 1) poor bonder Overall Equipment Effectiveness, resulting in the plant not making enough (often) and not making the correct mix (usually), 2) monoplane yield variability, resulting in a very dynamic environment in which to schedule and a lot of less useful parts
with constraint time invested in them, 3) an increase in demand combined with the sourcing
of all Aerostar products to Milan, and 4) the fact that the monoplane follows the bonding operation. These major problems made other problem areas more serious than would have otherwise been the case. If the reverse of point 4 were true, monoplane yield variability would be much less of a problem as long as it didn't result in bonder starvation (which in most cases it wouldn't since the monoplane has much more throughput capability). The
monoplane yield variability is the major factor that will carry-over to the 1995 system.
Unfortunately, the plant's operating environment is extremely dynamic: demand changes radically from month to month, as does equipment performance; therefore, any list of
strong and weak points is substantially time-dependent since the location of the bottleneck and the severity of its effects change with time. I have identified four separate steady-state conditions that lasted for 2-4 months each during 1993 alone. During the first quarter of 1993, bonding and welding were the constraint, but since demand was low, the bottleneck's capacity did not adversely affect premium transportation. In the second quarter, demand jumped dramatically, and bonding and welding performance was worse than it had been in the previous quarter, resulting in a rise in premium freight. In the third
quarter, the monoplane became the constraint since it had difficulty painting the 1994 model
year colors, and demand rose again, resulting in record high premium transportation. And finally, now that demand has fallen with preparation of the assembly plants for the launch of the Mystique and the Contour automobiles, and improvement in the monoplane's performance has occurred, bonding and welding can be viewed as the bottleneck again; however, their effect on the customer is not large since demand is low, and premium freight has dropped to first quarter levels. Beginning with the launch of the Mystique and the Contour bumpers, the monoplane should become the constraint again since new colors will be an issue again and bonding and welding volumes will have dropped somewhat since the Contour Front is a TPO part which does not require bonding. Lots of manual transport of parts is going to have to be done between 1994 and 1995 since all the new ASRS in-process racks will not be in place, however, and that may have all kinds of strange effects. The loss of Selective II's packout ability while it is modified to handle the
1996 products also affects the system by increasing the load on the packout cells.
Rather than try to figure out the effects of the numerous transitional stages between 1994 and 1995, I jumped to the next steady-state of operations which will occur in 1995 with the launch of the new Taurus/Sable. This new operating environment is examined in Chapters 4 and 5.
Chapter 4
The Future System5
Any look at the future system must begin with TPO (thermoplastic olefin), the material that
will be used to make almost all of the new products in 1996, and perhaps by 1998, all of the bumper products made by Milan. The properties of TPO are much different from the properties of Xenoy, the polycarbonate-based material currently used to make all of the
bumpers at the plant. The differences in the materials' properties will have a dramatic effect on the processes used in the plant.
The TPO Production Process
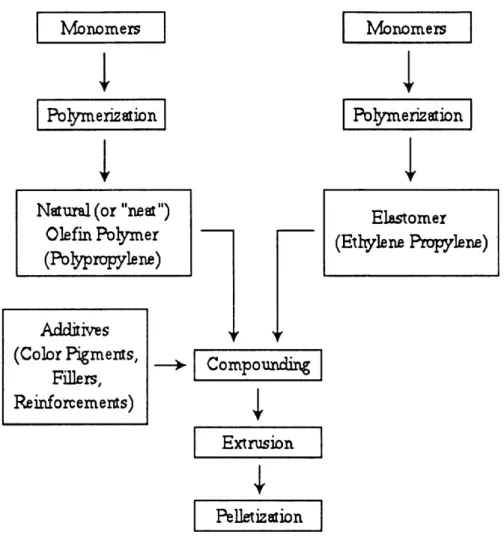
TPO is an intensively mixed compound of polyolefins, elastomers, fillers, additives, and
colorants (Figure 6 shows a typical process flow diagram). A typical formulation (there are
many varieties of TPOs) includes ethylene propylene rubber, polypropylene, heat and ultraviolet light stabilizers, and fillers such as talc, calcium carbonate, or glass which influence the thermal expansion properties and the modulus. These ingredients are compounded together using high-intensity Banbury mixers. The molten product is then extruded into pellets. Final product lots are typically composed of dry-blended pellets from numerous compounded batches. Material properties are affected not only by the ratios of
the raw materials used, but also by the mixing efficiency of the processing equipment, the
amount of shear during processing, and the homogeneity of the raw materials.
5
The author wishes to thank Mr. Dan Himebaugh and Dr. Rose Ryntz of Ford Motor Co.'s Plastic and Trim Products Division for providing information about their TPO research efforts.
I Monomers I1
Polymerizion
INatural (or "nea") Olefin Polymer (Poyprpylene) I Polymerizion I
1
ICompouding
| ExtrusionI
4. I PelletizionFigure 6: Typical TPO production process6
Why Use TPO
Compounded TPO is viewed favorably as a bumper material, from a styling standpoint, because it is soft and flexible. This property allows for a tighter fit between the bumper and the sheet metal of the car body, thereby improving the fit-and-finish of the fascia, hood, fenders, and lamps. Fitting tightly to the sheet metal is important because of the design trend towards flush, integrated front ends where the bumper does not protrude. Integrated front end structures combine the functions of radiator support, headlight assembly, grille opening reinforcement, hood latch mounting, and bumper support in one subassembly. In these designs, the collision energy management structure is built into the
vehicle at the assembly plant and is independent of the fascia. Therefore, a soft and flexible
6
Based on Figure 1 of Logan, W. N. "Reactor Thermoplastic Olefins - A New Class of High Performance Materials for Bumper Systems." Society of Autonmotive Engineers 920526, 1992, pp. 133-51
Monomers
Addiives
(Color Pigments, Fillers, Reinforcements)
material is suitable for use because it is there purely for appearance and aerodynamics. In contrast, the Xenoy bumpers the plant currently produces are intended to be a complete
bumper system, and they leave a gap between themselves and the front of the vehicle.
The bumpers produced at the plant today have a Xenoy box-beam bonded or welded inside
the fascia which reinforces the fascia and absorbs energy. Xenoy is a much stiffer material
than the grade of TPO planned for use at Milan, so it works well in this capacity. The new Taurus/Sable and Contour automobiles will require an energy absorbing structure made of stronger materials than TPO. A variety of reinforcing beam materials can be used, including steel, aluminum, or glass fiber - plastic matrix composites. The new
Taurus/Sable will use a Xenoy box beam attached to steel reinforcements.
Several other materials were considered for use as a soft fascia. One which has seen use on several Ford products with integrated front-ends is Reaction Injection Molded Urethane (RIM). The material is soft, has a tough surface, and is easily painted since a urethane-based paint is used which wets the surface nicely. However, a number of drawbacks exist.
The primary disadvantage is that regrind cannot be used in the manufacture of RIM fascias since it is a thermoset. Milan's operations create a substantial amount of rejects which would be extremely expensive to dispose of it they could not be recycled as regrind. Also, Ford's efforts to improve the recyclability of its vehicles makes RIM objectionable. TPO and Xenoy, being thermoplastics, can be successfully reused inside the plant in the bumper injection molding machines if they have not been painted, and painted regrind may find applications in injection molded products other than bumpers. The major issue with painted regrind is that the paint substantially alters material properties, particularly the strength of the molded part, and paint flakes show through unpainted products. To address this issue, a supplier is attempting to develop a process which removes the majority of the paint flakes and restores the material's properties to an acceptable level for use in non-structural applications. Identifying uses for post-consumer Xenoy and TPO bumpers poses a major challenge for automobile manufacturers.
Additional objections to RIM involve cost. First, since the RIM molding process involves a reaction, an additional source of scrap compared with other materials is introduced because reaction variability can result in dimensionally correct but functionally imperfect parts. Quite a lot of scrap is generated because of air entrapment during the reaction
Other candidates (Texan and a low modulus grade of Xenoy called Lo-mod) were viewed unfavorably because of cost and the fact that they have not been used in the field by the auto industry. Bumpers experience a wide range of operating conditions, and environmental degradation is a big concern and a potentially large source of warranty claims and customer dissatisfaction.
TPO has the advantage of having been used for several years by many companies (Honda, Lexus, and Mazda) without difficulty. It is relatively inexpensive since it is based on polypropylene. Its specific gravity is also lower than the other materials considered (0.9 vs. 1.2 specific gravity). Therefore, less material is required to fill a mold, and the final product weighs less, an important benefit since fuel economy is greatly influenced by vehicle weight. Approximately 10 to 15 pounds of TPO will be used in each fascia,
depending on the vehicle type.
TPO's Effects on the Future System
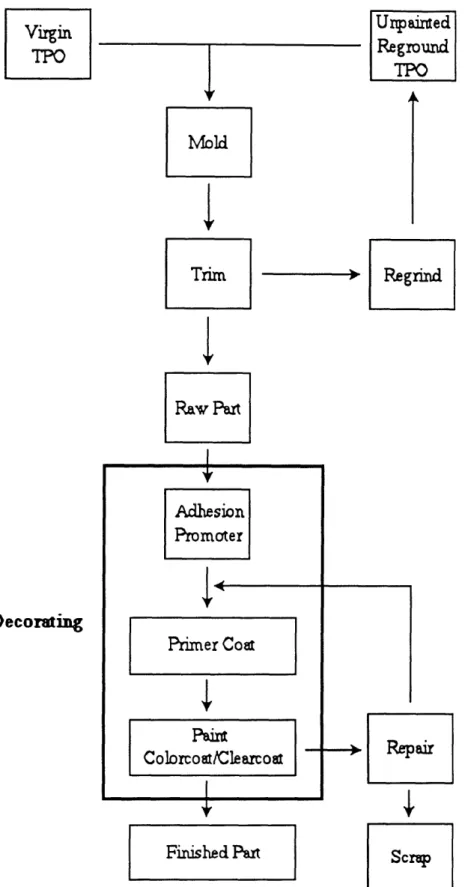
The properties of the material and the design of the parts are driving numerous changes to the current system of production, both positive and negative. The following is a look at how the parts' design and the choice of materials will affect each of the major areas of the plant. Figure 7 shows a typical TPO bumper production process.
Unpairaed Reground TPO r A Mold Regrird Raw Pu I Decorating
Figure 7: TPO bumper fascia production flowchart7
7Based on Figure 2 of Golder, Michael D. "Plastic Materials for Soft Bumper Facia." Society of
Automotive Engineers 910689, 1991, pp. 107-22. Adhesion Promoter
P <Im
Ca
Primer Coœt $ Pain Colorcoatlearcol I Finished Pat I )p ScrT~Injection molding/tool room
Primarily, TPO should have positive effects on the injection molding presses themselves through ease of startup and reduced cycle times, but could pose some problems for the tool
room because of the complexity of the tools. Since the material is less viscous than Xenoy,
it requires lower temperatures to mold successfully, reducing cycle times from the current 135 seconds for Xenoy to as low as 100 seconds for TPO since the cooling time is shorter. In fact, the current obstacle to faster cycles is the robot unloader, so faster cycle times may be achievable. The decrease in cycle times will increase the capacity of the injection molding area substantially.
Second, presses running TPO should be easier to start up since TPO does not degrade in a heated press as rapidly as Xenoy does. Therefore, preheating the press greatly reduces the amount of time to steady-state since the press is warmed up and a lot of degraded material does not have to be pushed out before good parts can be made. As a result, it should be possible to make good parts in substantially fewer cycles than occurs today with Xenoy. The press can reach the lower required temperature for TPO faster, too.
The tools, on the other hand, may be more difficult to maintain in a usable condition. The TPO parts are quite complex, containing numerous openings for radiator grills, headlamps, etc. The parting lines have also been moved to areas of the part concealed from customer view. However, accomplishing this feat has required molds with collapsing cores, thereby causing the tools to have a much larger number of moving parts than the plant is accustomed to. As a result, it is quite possible that the tools will require more maintenance
than the tools currently used to produce Xenoy parts and will break down more frequently.
Bonding/welding
The TPO fascia is attached directly to the sheet metal of the automobile and is not actually attached to the Xenoy box beam reinforcement which manages the energy of a collision. Therefore, the bonding and welding area will experience a dramatic drop in volume since only the Contour Rear, Mystique Front and Rear, and past model service bumpers will require bonding and welding. The TPO Taurus/Sable and Contour Front bumpers will pass directly from injection molding to painting. Therefore, bonding and welding will no
longer be a potential bottleneck since plenty of capacity will exist, even after the removal of