HAL Id: inserm-01585114
https://www.hal.inserm.fr/inserm-01585114
Submitted on 11 Sep 2017
HAL is a multi-disciplinary open access archive for the deposit and dissemination of sci-entific research documents, whether they are pub-lished or not. The documents may come from teaching and research institutions in France or
L’archive ouverte pluridisciplinaire HAL, est destinée au dépôt et à la diffusion de documents scientifiques de niveau recherche, publiés ou non, émanant des établissements d’enseignement et de recherche français ou étrangers, des laboratoires
Dynamics and deformability of α-, 310- and π-helices
Tarun Narwani, Pierrick Craveur, Nicolas Shinada, Hubert Santuz, Joseph
Rebehmed, Catherine Etchebest, Alexandre de Brevern
To cite this version:
Tarun Narwani, Pierrick Craveur, Nicolas Shinada, Hubert Santuz, Joseph Rebehmed, et al.. Dy-namics and deformability of α-, 310- and π-helices. Archives of Biological Science, Srpsko Biolo�ko Dru�tvo, 2018, 70 (1), pp.21-31. �10.2298/ABS170215022N�. �inserm-01585114�
Dynamics and deformability of α-, 3
10- and π-helices
Tarun Jairaj Narwani
1,2,3,4,+, Pierrick Craveur
1,2,3,4,5,+, Nicolas K.
Shinada
1,2,3,4,6,+,
Hubert
Santuz
1,2,3,4,
Joseph
Rebehmed
1,2,3,4,7,
Catherine Etchebest
1,2,3,4and Alexandre G. de Brevern
1,2,3,4,*
1INSERM, U 1134, DSIMB, F-75739 Paris, France
2Univ Paris Diderot, Univ. Sorbonne Paris Cité, UMR_S 1134, F-75739 Paris, France 3Institut National de la Transfusion Sanguine (INTS), F-75739 Paris, France
4Laboratoire d'Excellence GR-Ex, F-75739 Paris, France
5Department of Integrative Structural and Computational Biology, The Scripps Research Institute, La
Jolla, California, USA
6Discngine, SAS, 75012, Paris France.
7Department of Computer Science and Mathematics, Lebanese American University, 1h401 2010
Byblos, Lebanon
+These authors should be considered as first authors.
*Corresponding author: [email protected]
This article was presented on the Belgrade Bioinformatics Conference 2016 (BelBI2016) [http://belbi2016.matf.bg.ac.rs/]
Received: February 15, 2017; Revised: May 2, 2017; Accepted: May 30, 2017
Abstract: Protein structures are often represented as seen in crystals as (i) rigid macromolecules (ii) with helices, sheets and coils. However, both definitions are partial because (i) proteins are highly dynamic macromolecules and (ii) the description of protein structures could be more precise. With regard to these two points, we analyzed and quantified the stability of helices by considering α-helices as well as 310- and π-helices. Molecular dynamic (MD) simulations were performed on a large set of
169 representative protein domains. The local protein conformations were followed during each simulation and analyzed. The classical flexibility index (B-factor) was confronted with the MD root mean square flexibility (RMSF) index. Helical regions were classified according to their level of helicity from high to none. For the first time, a precise quantification showed the percentage of rigid and flexible helices that underlie unexpected behaviors. Only 76.4% of the residues associated with α-helices retain the conformation, while this tendency drops to 40.5% for 310-helices and is never
observed for π-helices. α-helix residues that do not remain as an α-helix have a higher tendency to assume β-turn conformations than 310- or π-helices. The 310-helices that switch to the α-helix
conformation have a higher B-factor and RMSF values than the average 310-helix but are associated
with a lower accessibility. Rare π-helices assume a β-turn, bend and coil conformations, but not α- or 310-helices. The view on π-helices drastically changes with the new DSSP (Dictionary of Secondary
Structure of Proteins) assignment approach, leading to behavior similar to 310-helices, thus underlining
the importance of secondary structure assignment methods.
Key words: helical local conformations; structural alphabet; molecular dynamics; disorder; flexibility
INTRODUCTION
2
provided evidence that polypeptide chains can adopt a limited number of repetitive local protein structures stabilized by intramolecular hydrogen bonds (HB) [2-4]. The two major local folds are: (i) the α-helix (or 3.613 helix) with HB between amino acid residues i and i +4,
and (ii) the β-sheet composed of extended strands with HB between adjacent strands. They roughly represent 1/3rd and 1/5th of the residues found in proteins, respectively. Since their discovery, extensive explorations have been conducted to better understand their formation and their role in the kinetics of protein folding. Although a general view of the folding kinetics is too complex to define, theoretical models as well as recent cutting-edge experiments have underlined their significant contribution through different examples [5]. Furthermore, with high-resolution experimental 3D structure accumulating, many studies have been carried out to decipher the sequence features that preferentially drive towards a given local fold than to another one.
In this context, α-helices have been intensely analyzed [6-8]. It has been emphasized that the length of an α-helix depends on its amino acid composition [9,10] and that its extremities (or caps) have specific signatures [11-15]. These caps can be stabilized by hydrophobic interactions between helical residues and residues outside the repetitive structures [16-18]. The importance of such interactions was highlighted for instance in the case of class α-glutathione transferases where, using computational approaches [19,20], it was shown that the highly conserved helix 9 modulates their catalytic and binding function and that a mutation of N-cap residue Asp-209 destabilizes the enzyme’s function.
Aside from the α-helix, other helical motifs have been identified, i.e. 310 and π-helices,
which are less frequent and represent about 4% and 0.02% of the residues in proteins, respectively. The 310-helix is characterized by intramolecular hydrogen bonds between
residues i and i+3 [21-23], and is usually short, containing three (representing one turn) or four residues. Nonetheless, two-turn and longer 310-helices have also been reported (22). In
terms of location, they are preferentially observed at the termini of α-helices [24,25] and are considered as connectors between two α-helices [23,25]. However, the 310-helix is often
found in the region connecting strands within β-hairpin or β-β-corner motifs [26]. In terms of sequence, their amino acid content is different from the α-helix [27]. A specific analysis of a 310-helix adjoining the α-helix and β-strand has shown that the composition of 310-helices and
β-strands is much more conserved among family members of homologous structures than those adjacent to two helices [26]. The preferred length of the 310-helix occurring between an
α-helix and β-strand is equal to 3 residues, but extends to 4 residues when located between two α-helices (α-310-α) [28].
In the π-helix (i.e. 4.416-helices), hydrogen bonds are formed between amino acid
residues i and i+5. This helix conformation is less stable due to steric constraints [29-32], which could explain why π-helices are rare. In 2000, Weaver [33] found only 14 well-defined π-helices in the available PDB files (i.e. about 13500 structures). However, the π-helix should occur more frequently in protein structures than has been previously described [34], and should be conserved within functionally related proteins [35]. π-helices show distinct residue preferences that differ from those of α-helices [34]. Interestingly, it was shown that on a limited number of π-helices they were directly linked to the formation or stabilization of a specific binding site [33].
Overall, these analyses point out significant differences in the amino acid composition of various helical motifs, which can be exploited for their prediction. For instance, the secondary structure prediction method SSPRO8 performs reasonably well for 8 different states (~62-63%) [36]. However, although it aims at separate predictions of α-, 310- and
π-helices, the 310-helix prediction rate is very low and the π-helix state is rarely predicted [36].
The latest approach with RaptorX Property performs slightly better for 310-helix [37], but
remains unsuccessful for the π-helix. The rare occurrences of these motifs largely explain the low rates. It may also arise from the difficulty to assign 310- and π- helices, which might be
due to the enhanced flexibility profile of these structures [38].
Indeed, a dynamic relationship would exist between the different kinds of helices, for instance between α- and π-helices as shown in [39]. Importantly, 310-helices and to a lesser
extent π-helices, have been proposed to be intermediates in the folding/unfoldingof α-helices [40-42]. However, these studies are often based on model systems such as polyalanine peptides and use molecular dynamics (MD) simulations to inspect the effect of chain-lengths and N-terminus residues in α-helix folding [43]. Unfortunately, flexibility profiles and putative interconversion between helical states have never been conducted for a large set of real sequences.
In this paper, we present the first large scale MD simulation study from a large number of folds to depict how helical regions evolve. Our study provides new insights into the flexibility and deformability of the different helical states, which are an essential component of the structure and function of biological macromolecules.
MATERIALS AND METHODS
DatasetsA databank of 169 X-ray structures taken from Protein DataBank (PDB) [44] was extracted using ASTRAL 2.03 [45,46] (PDB ids and corresponding chain are provided in the Supplementary data S1). The dataset is filtered out based on structure resolution better than 1.5 Å, and in the absence of heteroatoms (other than water), alternate or modified residues in the chain. Moreover, the chain length should range between 50 and 250 residues. Only globular proteins were used. An in-house parser was used to filter out and fetch the information [47].
MD simulations
Three MD simulations were performed for all protein structures with GROMACS 4.5.7 software [48], using AMBER99sb force field [49]. Each protein structure was immersed in a periodic dodecahedron box using TIP3P water molecules [50] and neutralized with Na+ or Cl -counterions. The system was then energetically minimized with a steepest-descent algorithm for 2000 steps. The MD simulations were performed in isothermal-isobar thermodynamics ensemble (NPT) with temperature fixed at 300 K and pressure at 1 bar. A short run of 1 ns was performed to equilibrate the system using the Berendsen algorithm for temperature and pressure control [51]. The coupling time constants were equal to 0.1 ps for each physical parameter. A production step of 50 ns was done using the Parrinello-Rahman algorithm [52] for temperature and pressure control, with coupling constants of T=0.1 ps and P=4 ps. All bond lengths were constrained with the LINCS algorithm [53], which allowed an integration step of 2 fs. The PME algorithm [54] was applied for long-range electrostatic interactions using a cut-off of 1 nm for nonbonded interactions.
This protocol was applied on each of the 169 protein chains. From each MD simulation, the conservation of the secondary structures was observed and the structural deviation of each snapshot from the initial structure was measured. Conformations were saved every ps. For each MD simulation, the secondary structures were analyzed and the structural deviation of each snapshot from the initial structure was measured. Trajectory analyses were performed with the GROMACS software, in-house Python and R scripts. Root mean square deviations
4
(RMSD) and root mean square fluctuations (RMSF) were computed on Cα atoms. Normalized RMSFs and normalized B-factors were computed as in [55].
Local protein conformation analyses
Secondary structure assignment was performed using DSSP [56] (CMBI version 2000) with default parameters. A second assignment was performed later with a recent DSSP (2015) version 2.2.1 since the protocol of assignment had slightly changed. Protein Blocks (PBs), which are a structural alphabet composed of 16 local prototypes [57], was also employed to analyze local conformations. Each specific PB is characterized by the φ, ψ dihedral angles of five consecutive residues. PBs give a reasonable approximation of all local protein 3D structures [58] and are very efficient in tasks such as protein superimpositions [59] and MD analyses [60]. PB assignment was carried out for every residue obtained from every snapshot extracted from MD simulations using our PBxplore tool at GitHub [61]. From this description we developed a useful measure that helps in quantifying the flexibility of each amino acid, the so-called Neq (for an equivalent number of PBs) [57]. Neq is a statistical measurement similar
to entropy and represents the average number of PBs that a residue may adopt at a given position. Neq is calculated as follows [57]:
) f f ( Neq x x xln exp
16 1 (1)where fx is the frequency of PB x in the position of interest. An Neq value of 1 indicates that
only one type of PB is observed while a value of 16 is equivalent to an equal probability for each of the 16 states, i.e. random distribution.
Clustering approach
A residue is initially associated to one of the 8 defined secondary states assigned by DSSP [56], namely, α-, 310- and π-helices, β-strand, turns, bends, β-bridges and coil. During MDs,
DSSP is used again to assign the protein chain secondary structures. Hence, each residue is associated to a vector of size S=8 representing the 8 defined secondary states and, more specifically, the occurrence of each observed state. To define common behaviors between residues, a k-means clustering approach was used [62]. Thus, at first a subset is created. It represents all the residues that were associated to this state before MD, e.g. 310-helices. Then
a fixed number of clusters k is determined, with k=5 (selected after few tests). The k clusters are of size S=8. All the data of the subset is compared to each k cluster and the one with the minimal Euclidean distance is considered the winner. After one cycle (and after all subsets had been used), the values of the k clusters are modified to correspond to the associated observations, i.e. each cluster is the barycenter of the associated observations. After a few cycles, the k clusters are stable and can be analyzed, e.g. how the residues associated to 310
-helix assignment have evolved.
RESULTS AND DISCUSSION
Analyses of protein structuresFrom the ASTRAL 2.03 compendium [45,46] we selected a nonredundant dataset at 40% sequence identity. It consists of 5580 protein chains resulting from 4432 PDB files. By restricting chain lengths to between 50-250 residues, the resolution is better than 1.5 Å and excluding those with discontinuity in position numbering, missing residues, modified and/or incomplete residues, only 169 domains were selectively used. The 169 domains represent an equilibrated repartition among the different SCOP classes: all-α represent 18.9% of the chains, all-β 29.6%, α/β 24.8% and α+β 26.7%.
α-helix, 3.99% for the 310-helix and 0.28% for the π-helix, which is similar to the distribution
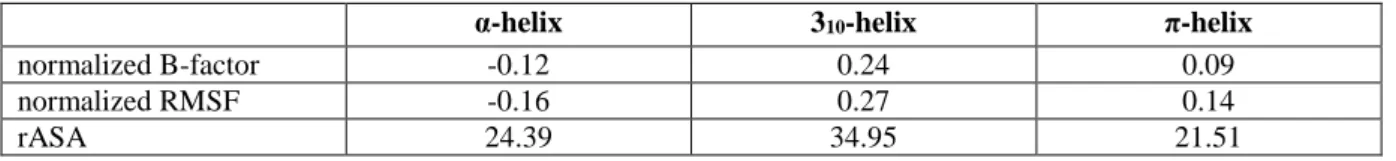
observed by Tyagi et al. in 2009 [63]. As shown in Table 1 (and Supplementary data S2), the lowest B-factors are associated to α-helices, an expected feature since α-helices are found most prominently in the ordered state [64]. Interestingly, π-helices are observed in the dataset to be less flexible than 310-helices with average normalized B-factor values of 0.09 and 0.24,
respectively. Both correspond to the flexible region as defined in [64-67]. This tendency is correlated with the relative accessibility of the residues computed by DSSP [56], a higher accessibility being observed for 310-helices than for π-helices (Table 1 and Supplementary
data S3).
Analyses of molecular dynamics
The distribution of normalized B-factors (Fig. 2A) and normalized RMSF (Fig. 2B) was highly similar to the distribution observed in a smaller dataset previously used [55,68]. Fig. 2C shows the correlation between normalized B-factor values and normalized RMSF (Pearson’s coefficient r = 0.43). This correct correlation is very close to the one previously observed [55], which was computed from fewer observations. Interestingly, 60.2% of the positions do not change at all (i.e. no local deformability was observed as computed with Neq,
as it equals 1.0). Furthermore, the behavior observed with B-factors is confirmed with normalized RMSF analysis. The most rigid helical structure are α-helices; π-helices are more flexible but less than 310-helices, which are always the most flexible ones (see Table 1).
In the following sections, we detail the dynamic behavior of each type of helical structure and discuss the results in the light of previous studies [34,39-43].
α-helices
α-helices represent nearly 30% of the residues of the complete dataset. Of those residues (Fig. 3A), 31.5% always remain α-helical residues during the entire simulation; 91.4% of such residues remain as an α-helix for more than 50% of the simulation time, while only 3.9% remain as an α-helix for less than 25% of time (Supplementary data S5). These statistics illustrate the very stable behavior of the α-helix.
310-helices
In comparison, despite its relative importance, the 310-helix was observed to be a less stable
local structure during simulations. As can be seen in Fig. 3B, the tendency of 310-helix
residues to remain in the 310-configuration is very limited. Indeed, no residue was found to
retain completely the 310-helix conformation during the 50 ns of simulation (Supplementary
data S5). Among the residues initially observed in the 310-helix state (3.9% of all the
residues), only 15.7% of the residues were seen to have more than 90% representation as a 310-helix, but 54.1% of the residues were observed more than half of the time in this state.
π-helices
π-helices are extremely rare, observed 14-times less than the 310-helices in the initial dataset.
They are slightly less accessible and with regard to the average B-factor and RMSF values, they are supposedly more stable. However, Fig. 3C shows that this is not the case. Indeed, only 2.4% of the residues remain more than half of the time as a π-helix and the rest is not stable, i.e. 97.6% are observed less than 1/4th of the times as a π-helix. This result has already been presented [69].
Behavior of helical structures
As seen in the previous section, helical structures display different behaviors. The next question to be addressed relates to the nature of the conformational change, i.e. when residues are changing conformations during MD, what new conformations do they adopt? Do they preferentially explore the conformational space of the other helical conformations or the
6
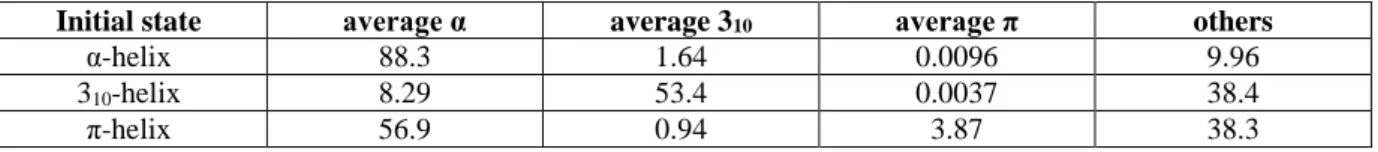
nonhelical ones? Table 2 depicts the helical exchange rates and also the change rate towards nonhelical states. For example, positions that start as an α-helix adopt non-α-helical states in 11.6% of the cases. Among them, changes towards the 310-helix represent only 14.1% of
cases, the remaining (85.6%) not being helical. For positions starting as 310-helix, 46.6% of
changes occur. Most of them transit to nonhelical states (82.2% of the cases) while transitions to the α-helix represent 17.7%. Hence, transitions to the π-helix are extremely rare (0.0096 and 0.0037% only for the α- and 310-helix, respectively). Lastly, the π-helix residues only
remain as a π-helix in 3.97% of cases; they are mainly associated with the α-helix (59.2%) and only 0.97% with the 310-helix. The change to nonhelical states represents only 39.8% of
the simulation times, which is surprisingly smaller than observed either for the -helix or the 310-helix. Thus, the π-helix is associated more with helical conformations during dynamics
than expected.
Helical structure behavior during dynamics
To go further into the analysis of transitions, we performed a clustering of the ensemble of conformations considering the 8 possible states of DSSP (using the k-means approach [62] with k=5 clusters for comparative purpose). The clusters are named according to their major DSSP state, with subscript indicating a minor DSSP state (T for turn or C for coil). The detailed composition of each cluster starting from the α-helix, 310-helix and π-helix initial
state is given in Figs. 4, 5 and 6, respectively.
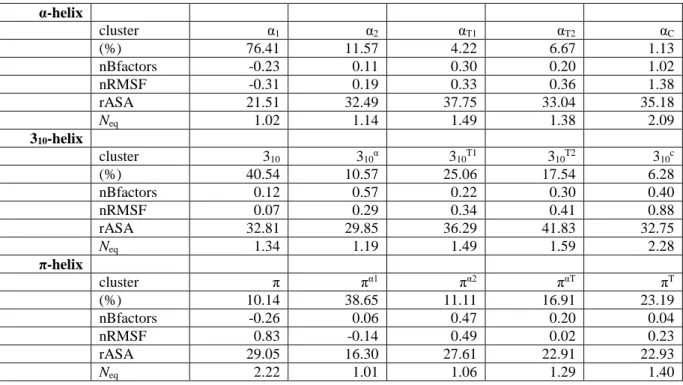
The classification highlights that a residue departing from the α-helix state (Fig. 4 and Table 3) tends to transit preferentially towards a β-turn state. Indeed, apart from the most populated cluster α1 (76.4% of the residues) that is composed of residues remaining as an
α-helix, the second cluster α2 (11.5% of the residues) reveals a decreased content of α-helices in
favor of β-turn states. In clusters αT1 and αT2 (4.2% and 6.6% of the residues, respectively),
apart from a small subcluster depicting conformations that switch to the 310-helix
conformation, β-turn conformations are even increased. The least populated cluster αC is
associated with nonrepetitive structures (1.1% of the residues). Table 3 also underlines the correlation between flexibility and the presence of b-turns: the higher the b-turn or coil content, the larger the normalized RMSF (nRMSF). A similar correlation is observed with accessibility and Neq values. Clearly, the cluster α1 represents more buried and stable
α-helices.
For residues initially assigned as 310-helices (Fig. 5), the most populated cluster 310
(40.5% of the residues) represents residues that remain in the 310-helix conformation. It is also
the most rigid (both low B-factor and RMSF). From cluster 310T1 to cluster 310T2 (25.0 and
17.5% of the residues respectively), the 310-helix content decreases and the content of β-turns
increases. The flexibility increases concomitantly. It also perfectly correlates with the relative accessibility (going from 32.8 to 36.3 and 41.8) and Neq values (1.34, 1.49 and 1.59,
respectively). The preferred transition to the β-turn was expected as the 310-helix was shown
to overlap by nearly 90% [70]. This is one of the reasons for the disappearance of β-turn type III [71]. The cluster 310C has the highest content of nonrepetitive structures and is, as
expected, associated with high flexibility. Surprisingly, residues in this cluster are less accessible than those in clusters 310T1 and 310T2. Cluster 310α (10.5% residues) that represents
the transition to α-helical conformation exhibits low accessibility values, the lowest RMSF values compared to clusters 310C, 310T1 and 310T2, and the lowest Neq values, which shows the
slightest local conformation change of all the 310 clusters. However, it is associated to high
B-factor values.
π-helices. As seen previously, they are not stable, hence the cluster named π (10.1% of the residues), which has the highest frequency of π-helices, is also associated with the β-turn, bends and some coil conformations, but not α- or 310-helices. This, however, is the tip of the
iceberg of contradictions in this cluster. Cluster π is associated with the lowest crystallographic B-factors, with the highest accessibility observed. During the MD, it had a very flexible behavior, with the highest RMSF values and also the highest Neq values
observed. The contradictions could be explained with the following three clusters, πα1, πα2 and παT that have a higher α-helical content with no π-helix residues and few β-turns. They have a
slight increase in their Neq values. Cluster πα1 represents π-helix residues (38.7%) that had
medium B-factor values associated with a higher stability as an α-helix because they are buried compared to other clusters. Clusters πT and παT have intermediate flexibility behaviors,
while the most flexible cluster is cluster πα2.
An interesting question was raised in this work regarding the potential bias in the assignment of the π-helix in the different version of DSSP. We owe it to an interesting comment by a reviewer and other studies of this bias. Fodje and Al-Karadaghi [35] nearly 15 years ago re-implemented a DSSP-like algorithm named SECSTR, which is nowadays not available. They changed the parameters to increase the visibility of the non-α helices. Recently, the DSSP order to assign helical state has been updated to prevent the underestimation of the number of π-helices [78]. We decided to perform the analyses using the new DSSP (version 2.2.1) [72]. Although no change was observed for 310-helices (still
3.5%), this was not the case for π-helices, which increase 15-fold going from 0.02 to 0.32%. This change comes from 2/3 of the previously assigned α-helices and 1/3 of turns. This new repartition provides a different view of π-helices. The πnewDSSP-helices are more stable than
expected. Their exchange rate (Table 2) is 28.5% to α-helices, 1.43% to 310-helices, 27.7 to
others and remains as πnewDSSP-helices 42.2% of the times. Moreover, 15% of these helices stay as πnewDSSP-helices more than 90% of the times; 39.6% more than 50% of the time and
38.6% are seen at less than 25% of the time.
Fig. 7 shows the new clustering for these πnewDSSP-helices. This time a pure π-helix
cluster was found (named nπ) that represents 20% of the residues. It is totally different from
the previous cluster π, which was a mix of β-turn, bends and some coil conformations. Two other clusters (nπα1 and nπα2) are associated with the transition to α-helices; they represent
23.4% and 16.5%, while cluster nπT is mainly associated with turns (25.5%). These three
share common features with previous clusters πα1, πα2 and πT, but the proportion of π-helix
residues in these is drastically higher. The only fuzzy cluster is cluster nπV, which is a mix of
α-helix, π-helix, β-turn, and β-bridge (14.7%). These results show that the previous assignment of the π-helix strongly impacted our views of this local protein conformation.
CONCLUSION
As we have seen in a previous work on the β-bulge, sometimes nonclassical conformations associated with a classical repetitive structure can show some unexpected behavior, as for instance a protein with 15 β-bulges in which one β-bulge disappears after 2/5 of the MD
simulation and never returns [73]. Similarly, we have shown that some α-helices were highly dynamic, with 5% of them being often highly accessible and shorter [55].
Herein we focused specifically on the helical structures. The first pertinent result is the quantification of the persistence of helical residues in their original local conformation. More than ¾ of α-helix residues remain in this helical conformation while it drops to 40.5% for 310
8
less than 20% of the simulation times.
The second interesting result on the flexibility and deformability of helical structures is the huge difference between the three types of helix. The α-helix shows good correlation between stability of the α-helical content and (i) the flexibility as seen through B-factors and RMSf, (ii) accessibility of the residues, and (iii) Neq. α-helix residues with a higher tendency
to assume β-turn conformations than either the 310- or π-helices.
The 310-helix shows a similar general behavior in 90% of cases. Indeed, correlation is
good in terms of flexibility (both crystallographic and in silico), accessibility (with the exception of cluster 310C) and Neq values. Nonetheless, the 310-helix that switches to the
α-helix conformation shows drastically different characteristics. It retains higher B-factor and RMSF values than the average of cluster 310 but is associated with lower accessibility and
lower Neq. This cluster seems to have the dynamic characteristics of a local protein
conformation that can adopt an α-helix configuration [32].
Using classical DSSP, the π-helices cannot be described as stable. The residues that stayed mostly associated with the π-helix conformation are also associated with β-turn, bend and coil conformations, but never α- or 310-helices. A counterintuitive finding is that they are
also associated with low B-factors, but, due to the high accessibility, they are very flexible/deformable, having the highest RMSF and Neq values. The other residues lose their
initial π-helix conformation and mainly assume an α-helical conformation or to a lesser extent a β-turn conformation. Using a recent DSSP, these results are completely mixed, with the π-helices exhibiting 310-helix behaviors.
These results are important to define more properly the properties of these helical conformations. As was done for PolyProline II [74-77] or β-turns [70, 78], these less frequent states are also of interest. Numerous questions remain. It was recently shown that π-helices help the protein chain to fold properly and also in helix packing. They facilitate favorable nonbonded interactions by positioning the functionally important helical residues in the correct orientation [34].
In this work we showed and quantified for the first time precisely the exchange between different helical states that underlie unexpected behaviors.
Protein chains were selected with a limited redundancy from SCOP. They were of high quality. However, we must not downplay the fact that crystallization also produces some crystal contact packing effects, but these were found in a limited number of cases [79, 80] and they did not have a significant effect on the results. It is important to properly define the properties of these helical conformations that have implications in both experimental and computational studies, i.e. analyses of flexibility of protein local conformations [58,64,81], force field parameters [69,82], disorder [83], etc.
Acknowledgments: We wish to thank Jean-Christophe Gelly for the fruitful discussions. This work was
supported by grants from the Ministry of Research (France), University Paris Diderot, Sorbonne, Paris Cité (France), the National Institute for Blood Transfusion (INTS, France), the National Institute for Health and Medical Research (INSERM, France) and Labex GR-Ex. The Labex GR-Ex reference ANR-11-LABX-0051 is funded by the program “Investissements d’avenir” of the French National Research Agency, reference ANR-11-IDEX-0005-02. TN and AdB acknowledge the Indo-French Center for the Promotion of Advanced Research/CEFIPRA for the Collaborative Grant No. 5302-2. This work was supported by a grant from the French National Research Agency (ANR): NaturaDyRe (ANR-2010-CD2I-014-04) to JR and AdB. NSh acknowledges the support from ANRT. The authors were granted access to high performance computing (HPC) resources at the French National Computing Centre CINES under Grant No. c2013037147 funded by the GENCI (Grand Equipement National de Calcul Intensif). Calculations were also performed on an SGI cluster granted by Conseil Régional Ile de France and INTS (SESAME Grant).
Authors’ contribution: AdB designed the study. PC did all the molecular dynamics simulations under the
guidance of JR and AdB, with the technical help of HS. TJN and NKS performed all analyses of the results under the guidance of AdB and CE. AdB and CE prepared the manuscript. All authors discussed the results and their implications and commented on the manuscript at all stages.
Conflict of interest disclosure: The authors have no conflict of interest to declare.
REFERENCES
1. Kendrew JC, Bodo G, Dintzis HM, Parrish RG, Wyckoff H, Phillips DC. A three-dimensional model of the myoglobin molecule obtained by x-ray analysis. Nature. 1958;181(4610):662-6.
2. Eisenberg D. The discovery of the alpha-helix and beta-sheet, the principal structural features of proteins. Proc Natl Acad Sci U S A. 2003;100(20):11207-10.
3. Pauling L, Corey RB, Branson HR. The structure of proteins; two hydrogen-bonded helical configurations of the polypeptide chain. Proc Natl Acad Sci U S A. 1951;37(4):205-11.
4. Pauling L, Corey RB. The pleated sheet, a new layer configuration of polypeptide chains. Proc Natl Acad Sci U S A. 1951;37(5):251-6.
5. Miller SE, Watkins AM, Kallenbach NR, Arora PS. Effects of side chains in helix nucleation differ from helix propagation. Proc Natl Acad Sci U S A. 2014;111(18):6636-41.
6. Chakrabartty A, Kortemme T, Baldwin RL. Helix propensities of the amino acids measured in alanine-based peptides without helix-stabilizing side-chain interactions. Protein Sci. 1994;3(5):843-52.
7. Kumar S, Bansal M. Geometrical and sequence characteristics of alpha-helices in globular proteins. Biophys J. 1998;75(4):1935-44.
8. Malkov SN, Zivkovic MV, Beljanski MV, Stojanovic SD, Zaric SD. A reexamination of correlations of amino acids with particular secondary structures. Protein J. 2009;28(2):74-86.
9. Richardson JS, Richardson DC. Amino acid preferences for specific locations at the ends of alpha helices. Science. 1988;240(4859):1648-52.
10. Pal L, Chakrabarti P, Basu G. Sequence and structure patterns in proteins from an analysis of the shortest helices: implications for helix nucleation. J Mol Biol. 2003;326(1):273-91.
11. Presta LG, Rose GD. Helix signals in proteins. Science. 1988;240(4859):1632-41.
12. Aurora R, Srinivasan R, Rose GD. Rules for alpha-helix termination by glycine. Science. 1994;264(5162):1126-30.
13. Aurora R, Rose GD. Helix capping. Protein Sci. 1998;7(1):21-38.
14. Levitt M. Conformational preferences of amino acids in globular proteins. Biochemistry. 1978;17(20):4277-85.
15. Imai K, Mitaku S. Mechanisms of secondary structure breakers in soluble proteins. Biophysics. 2005;1:55-65.
16. Ho BK, Thomas A, Brasseur R. Revisiting the Ramachandran plot: hard-sphere repulsion, electrostatics, and H-bonding in the alpha-helix. Protein Sci. 2003;12(11):2508-22.
17. Ermolenko DN, Thomas ST, Aurora R, Gronenborn AM, Makhatadze GI. Hydrophobic interactions at the Ccap position of the C-capping motif of alpha-helices. J Mol Biol. 2002;322(1):123-35.
18. Prieto J, Serrano L. C-capping and helix stability: the Pro C-capping motif. J Mol Biol. 1997;274(2):276-88. 19. Dirr HW, Little T, Kuhnert DC, Sayed Y. A conserved N-capping motif contributes significantly to the
stabilization and dynamics of the C-terminal region of class Alpha glutathione S-transferases. J Biol Chem. 2005;280(20):19480-7.
20. Kuhnert DC, Sayed Y, Mosebi S, Sayed M, Sewell T, Dirr HW. Tertiary interactions stabilise the C-terminal region of human glutathione transferase A1-1: a crystallographic and calorimetric study. J Mol Biol. 2005;349(4):825-38.
21. Donohue J. Hydrogen bonded helical configurations of the polypeptide chain. Proc Natl Acad Sci USA 1953;39:470-8.
22. Pal L, Basu G. Novel protein structural motifs containing two-turn and longer 3(10)-helices. Protein Eng. 1999;12(10):811-4.
23. Pal L, Basu G, Chakrabarti P. Variants of 3(10)-helices in proteins. Proteins. 2002;48(3):571-9.
24. Baker EN, Hubbard RE. Hydrogen bonding in globular proteins. Prog Biophys Mol Biol. 1984;44(2):97-179. 25. Barlow DJ, Thornton JM. Helix geometry in proteins. J Mol Biol. 1988;201(3):601-19.
10 26. Pal L, Dasgupta B, Chakrabarti P. 3(10)-Helix adjoining alpha-helix and beta-strand: sequence and structural
features and their conservation. Biopolymers. 2005;78(3):147-62.
27. Karpen ME, de Haseth PL, Neet KE. Differences in the amino acid distributions of 3(10)-helices and alpha-helices. Protein Sci. 1992;1(10):1333-42.
28. Khrustalev VV, Barkovsky EV, Khrustaleva TA. The influence of flanking secondary structures on amino Acid content and typical lengths of 3/10 helices. Int J Proteomics. 2014;2014:360230.
29. Low BW, Baybutt RB. The p-helix -A hydrogen bonded configuration of the polypeptide chain. J Am Chem Soc 1952;74:5806.
30. Low BW, Greenville-Wells HJ. Generalized mathematical relationships for polypeptide chain helices. The coordinates of the p-helix. Proc Natl Acad Sci USA. 1953;39:785-801.
31. Ramachandran GN, Sasisekharan V. Conformation of polypeptides and proteins. Advan Protein Chem. 1968;23:283-438.
32. Rohl CA, Doig AJ. Models for the 3(10)-helix/coil, pi-helix/coil, and alpha-helix/3(10)-helix/coil transitions in isolated peptides. Protein Sci. 1996;5(8):1687-96.
33. Weaver TM. The pi-helix translates structure into function. Protein Sci. 2000;9(1):201-6.
34. Kumar P, Bansal M. Dissecting pi-helices: sequence, structure and function. FEBS J. 2015;282(22):4415-32. 35. Fodje MN, Al-Karadaghi S. Occurrence, conformational features and amino acid propensities for the
pi-helix. Protein Eng. 2002;15(5):353-8.
36. Pollastri G, Przybylski D, Rost B, Baldi P. Improving the prediction of protein secondary structure in three and eight classes using recurrent neural networks and profiles. Proteins. 2002;47(2):228-35.
37. Wang S, Li W, Liu S, Xu J. RaptorX-Property: a web server for protein structure property prediction. Nucleic Acids Res. 2016;44(W1):W430-5.
38. Pancsa R, Raimondi D, Cilia E, Vranken WF. Early Folding Events, Local Interactions, and Conservation of Protein Backbone Rigidity. Biophys J. 2016;110(3):572-83.
39. Lee KH, Benson DR, Kuczera K. Transitions from alpha to pi helix observed in molecular dynamics simulations of synthetic peptides. Biochemistry. 2000;39(45):13737-47.
40. Millhauser GL. Views of helical peptides: a proposal for the position of 3(10)-helix along the thermodynamic folding pathway. Biochemistry. 1995;34(12):3873-7.
41. Millhauser GL, Stenland CJ, Bolin KA, van de Ven FJ. Local helix content in an alanine-rich peptide as determined by the complete set of 3JHN alpha coupling constants. J Biomol NMR. 1996;7(4):331-4. 42. Armen R, Alonso DO, Daggett V. The role of alpha-, 3(10)-, and pi-helix in helix-->coil transitions. Protein
Sci. 2003;12(6):1145-57.
43. Goyal B, Kumar A, Srivastava KR, Durani S. Scrutiny of chain-length and N-terminal effects in α-helix folding: a molecular dynamics study on polyalanine peptides. J Biomol Struct Dyn. 2016;35(9):1923-35. 44. Berman HM, Westbrook J, Feng Z, Gilliland G, Bhat TN, Weissig H, Shindyalov IN, Bourne PE. The
Protein Data Bank. Nucleic Acids Res. 2000;28(1):235-42.
45. Fox NK, Brenner SE, Chandonia JM. SCOPe: Structural Classification of Proteins--extended, integrating SCOP and ASTRAL data and classification of new structures. Nucleic Acids Res. 2014;42(Database issue):D304-D309.
46. Chandonia JM, Hon G, Walker NS, Lo Conte L, Koehl P, Levitt M, Brenner SE. The ASTRAL Compendium in 2004. Nucleic Acids Res. 2004;32(Database issue):D189-D192.
47. Craveur P, Rebehmed J, de Brevern AG. PTM-SD: a database of structurally resolved and annotated posttranslational modifications in proteins. Database (Oxford). 2014;2014:bau041.
48. Pronk S, Pall S, Schulz R, Larsson P, Bjelkmar P, Apostolov R, Shirts MR, Smith JC, Kasson PM, van der Spoel D, Hess B, Lindahl E. GROMACS 4.5: a high-throughput and highly parallel open source molecular simulation toolkit. Bioinformatics. 2013;29(7):845-54.
49. van Gunsteren WF, Billeter SR, Eising AA, Hünenberger PH, Krüger P, Mark AE, Scott WRP, Tironi IG. Biomolecular Simulation: The GROMOS96 Manual and User Guide. Zürich, Switzerland: Vdf Hochschulverlag AG an der ETH Zürich; 1996. p. 1042.
50. Jorgensen WL, Madura JD. Quantum and statistical mechanical studies of liquids. 25. Solvation and conformation of methanol in water. J Am Chem Soc. 1983;105(6):1407-13.
51. Berendsen HJC, Postma JPM, van Gunsteren WF, DiNola A, Haak JR. Molecular dynamics with coupling to an external bath. J Chem Phys. 1984;81:3684-90.
52. Parrinello M, Rahman A. Polymorphic transitions in single crystals: A new molecular dynamics method. J Appl Phys. 1981;52(12):7182-90.
53. Hess B, Bekker H, Berendsen HJC, Fraaije JGEM. LINCS: a linear constraint solver for molecular simulations. J Comp Chem. 1997;18:1463-72.
54. Darden T, Perera L, Li L, Pedersen L. New tricks for modelers from the crystallography toolkit: the particle mesh Ewald algorithm and its use in nucleic acid simulations. Structure. 1999;7(3):R55-R60.
55. Bornot A, Etchebest C, de Brevern AG. Predicting protein flexibility through the prediction of local structures. Proteins. 2011;79(3):839-52.
56. Kabsch W, Sander C. Dictionary of protein secondary structure: pattern recognition of hydrogen-bonded and geometrical features. Biopolymers. 1983;22(12):2577-637.
57. de Brevern AG, Etchebest C, Hazout S. Bayesian probabilistic approach for predicting backbone structures in terms of protein blocks. Proteins. 2000;41(3):271-87.
58. Joseph AP, Agarwal G, Mahajan S, Gelly JC, Swapna LS, Offmann B, Cadet F, Bornot A, Tyagi M, Valadie H, Schneider B, Etchebest C, Srinivasan N, De Brevern AG. A short survey on protein blocks. Biophys Rev. 2010;2(3):137-47.
59. Leonard S, Joseph AP, Srinivasan N, Gelly JC, de Brevern AG. mulPBA: an efficient multiple protein structure alignment method based on a structural alphabet. J Biomol Struct Dyn. 2014;32(4):661-8.
60. Jallu V, Poulain P, Fuchs PF, Kaplan C, de Brevern AG. Modeling and molecular dynamics simulations of the V33 variant of the integrin subunit beta3: Structural comparison with the L33 1a) and P33 (HPA-1b) variants. Biochimie. 2014;105:84-90.
61. Barnoud J, Santuz H, Craveur P, Joseph AP, Jallu V, de Brevern AG, Poulain P. PBxplore: A Tool To Analyze Local Protein Structure And Deformability With Protein Blocks [Internet]. 2017 May 10. [cited 2017 Jun 23]. Available from: http://biorxiv.org/content/early/2017/05/10/136408.full.pdf+html
62. Hartigan JA, Wong MA. A K-Means Clustering Algorithm. Journal of the Royal Statistical Society Series C (Applied Statistics). 1979;28(1):100-8.
63. Tyagi M, Bornot A, Offmann B, de Brevern AG. Analysis of loop boundaries using different local structure assignment methods. Protein Sci. 2009;18(9):1869-81.
64. Craveur P, Joseph AP, Esque J, Narwani TJ, Noel F, Shinada N, Goguet M, Leonard S, Poulain P, Bertrand O, Faure G, Rebehmed J, Ghozlane A, Swapna LS, Bhaskara RM, Barnoud J, Teletchea S, Jallu V, Cerny J, Schneider B, Etchebest C, Srinivasan N, Gelly JC, de Brevern AG. Protein flexibility in the light of structural alphabets. Front Mol Biosci. 2015;2:20.
65. Schlessinger A, Rost B. Protein flexibility and rigidity predicted from sequence. Proteins. 2005;61(1):115-26.
66. Schlessinger A, Yachdav G, Rost B. PROFbval: predict flexible and rigid residues in proteins. Bioinformatics. 2006;22(7):891-3.
67. Carugo O, Argos P. Correlation between side chain mobility and conformation in protein structures. Protein Eng. 1997;10(7):777-87.
68. de Brevern AG, Bornot A, Craveur P, Etchebest C, Gelly JC. PredyFlexy: flexibility and local structure prediction from sequence. Nucleic Acids Res. 2012;40(Web Server issue):W317-W322.
69. Patapati KK, Glykos NM. Three force fields' views of the 3(10) helix. Biophys J. 2011;101(7):1766-71. 70. de Brevern AG. Extension of the classical classification of beta-turns. Sci Rep. 2016;6:33191.
71. Richardson JS. The anatomy and taxonomy of protein structure. Adv Protein Chem. 1981;34:167-339. 72. Touw WG, Baakman C, Black J, te Beek TA, Krieger E, Joosten RP, Vriend G. A series of PDB-related
databanks for everyday needs. Nucleic Acids Res. 2015;43(Database issue):D364-D368.
73. Craveur P, Joseph AP, Rebehmed J, de Brevern AG. beta-Bulges: extensive structural analyses of beta-sheets irregularities. Protein Sci. 2013;22(10):1366-78.
74. Mansiaux Y, Joseph AP, Gelly JC, de Brevern AG. Assignment of PolyProline II conformation and analysis of sequence--structure relationship. PLoS One. 2011;6(3):e18401.
75. Chebrek R, Leonard S, de Brevern AG, Gelly JC. PolyprOnline: polyproline helix II and secondary structure assignment database. Database (Oxford). 2014;2014:bau102.
76. Narwani TJ, Santuz H, Shinada N, Vattekatte AM, Ghouzam Y, Srinivasan N, Gelly JC, de Brevern AG. Recent advances on PolyProline II. Amino Acids. 2017;49(4):705-13.
77. Kumar P, Bansal M. Structural and functional analyses of PolyProline-II helices in globular proteins. J Struct Biol. 2016;196(3):414-25.
78. Bornot A, de Brevern AG. Protein beta-turn assignments. Bioinformation. 2006;1(5):153-5.
79. Luo J, Liu Z, Guo Y, Li M. A structural dissection of large protein-protein crystal packing contacts. Sci Rep. 2015;5:14214.
80. Carugo O, Argos P. Protein-protein crystal-packing contacts. Protein Sci. 1997;6(10):2261-3.
81. Offmann B, Tyagi M, de Brevern AG. Local Protein Structures. Current Bioinformatics. 2007;3:165-202. 82. Hornak V, Abel R, Okur A, Strockbine B, Roitberg A, Simmerling C. Comparison of multiple Amber force
12 83. Pavlovic-Lazetic GM, Mitic NS, Kovacevic JJ, Obradovic Z, Malkov SN, Beljanski MV. Bioinformatics
Table 1. Behaviors of helices. Average normalized B-factors (from X-ray structures), average
normalized RMSF (from the MDs) and the average relative accessibility surface area (for X-ray structures) of α- 310- and π-helices are presented.
α-helix 310-helix π-helix
normalized B-factor -0.12 0.24 0.09
normalized RMSF -0.16 0.27 0.14
14
Table 2. Exchange rates of helices expressed as percentages.
Initial state average α average 310 average π others
α-helix 88.3 1.64 0.0096 9.96
310-helix 8.29 53.4 0.0037 38.4
Table 3. Analysis of different clusters. Shown are each cluster, its occurrence, the average
normalized B-factors (nBfactors), the average normalized RMSF (nRMSF), the average relative accessibility solvent area (rASA) and the average number of equivalent (Neq)
expressed as percentages. α-helix cluster α1 α2 αT1 αT2 αC (%) 76.41 11.57 4.22 6.67 1.13 nBfactors -0.23 0.11 0.30 0.20 1.02 nRMSF -0.31 0.19 0.33 0.36 1.38 rASA 21.51 32.49 37.75 33.04 35.18 Neq 1.02 1.14 1.49 1.38 2.09 310-helix cluster 310 310α 310T1 310T2 310c (%) 40.54 10.57 25.06 17.54 6.28 nBfactors 0.12 0.57 0.22 0.30 0.40 nRMSF 0.07 0.29 0.34 0.41 0.88 rASA 32.81 29.85 36.29 41.83 32.75 Neq 1.34 1.19 1.49 1.59 2.28 π-helix cluster π πα1 πα2 παT πT (%) 10.14 38.65 11.11 16.91 23.19 nBfactors -0.26 0.06 0.47 0.20 0.04 nRMSF 0.83 -0.14 0.49 0.02 0.23 rASA 29.05 16.30 27.61 22.91 22.93 Neq 2.22 1.01 1.06 1.29 1.40
16
Figure Legends
Fig. 1. Different types of helices. Two views are provided from the side and from the bottom. Fig. 2. Normalized B-factors and normalized RMSf behaviors on the whole dataset. A –
Normalized B-factor distribution; B – Normalized RMSf distribution; C – Correlation between normalized B-factor distribution and normalized RMSf.
Fig. 3. Persistence of the initial helical state. The frequency of residues remaining in the
original assigned state for the three types of helices during simulations with A – α-, B – 310-,
and C – π-helices.
Fig. 4. Different clusters obtained for the α-helix. Five clusters with a gradient of color (see
on the right, ranging from red 100% to blue 0%) are shown. The displayed secondary structures are: α-, 310- and π-helices, β-strand, turn (T), bend (S), β-bridge (b) and coil (C).
Fig. 5. Different clusters obtained for the 310-helix. See the legend to Fig. 4.
Fig. 6. Different clusters obtained for the π-helix. See the legend to Fig. 4.
Fig. 7. Different clusters obtained for the π-helix using the new DSSP assignment protocol.
Supplementary Data S1-S8. The data is available on:
18
Fig. 2
20
Fig. 4
22
Fig. 5
Fig. 6
24