HAL Id: hal-01497688
https://hal.sorbonne-universite.fr/hal-01497688
Submitted on 29 Mar 2017
HAL is a multi-disciplinary open access
archive for the deposit and dissemination of sci-entific research documents, whether they are pub-lished or not. The documents may come from teaching and research institutions in France or abroad, or from public or private research centers.
L’archive ouverte pluridisciplinaire HAL, est destinée au dépôt et à la diffusion de documents scientifiques de niveau recherche, publiés ou non, émanant des établissements d’enseignement et de recherche français ou étrangers, des laboratoires publics ou privés.
Serum lipidomics reveals early differential effects of
gastric bypass compared to banding on phospholipids
and sphingolipids independent of differences in weight
loss
Brandon D. Kayser, Marie Lhomme, Maria Carlota Dao, Farid Ichou,
Jean-Luc Bouillot, Edi Prifti, Anatol Kontush, Jean-Marc Chevallier, Judith
Aron-Wisnewsky, Isabelle Dugail, et al.
To cite this version:
Brandon D. Kayser, Marie Lhomme, Maria Carlota Dao, Farid Ichou, Jean-Luc Bouillot, et al.. Serum lipidomics reveals early differential effects of gastric bypass compared to banding on phospholipids and sphingolipids independent of differences in weight loss. International Journal of Obesity, Nature Publishing Group, 2017, �10.1038/ijo.2017.63�. �hal-01497688�
Serum lipidomics reveals early differential effects of gastric bypass compared to banding on
1
phospholipids and sphingolipids independent of differences in weight loss
2
3
Running title: Serum lipidomics in gastric bypass versus banding
4
5
Brandon D Kayser1,2,3, Marie Lhomme1, Maria Carlota Dao1,2,3 , Farid Ichou1, Jean-Luc Bouillot4, Edi
6
Prifti1, Anatol Kontush1,5,6, Jean-Marc Chevallier7,Judith Aron-Wisnewsky1,2,3, Isabelle Dugail1,2,3, Karine
7
Clément1,2,3
8
9
1Institute of Cardiometabolism and Nutrition, ICAN, Assistance Publique Hôpitaux de Paris,
Pitié-10
Salpêtrière hospital, Paris, France. 2INSERM, UMR S U1166, Nutriomics Team, Paris, France.
11
3Sorbonne Universités, UPMC University Paris 06, UMR_S 1166, Nutriomics Team, Paris, France.
12
4Assistance Publique-Hôpitaux de Paris, Visceral Surgery Department, Ambroise Paré, Paris, France.
13
5INSERM, UMR_S U1166, Dyslipidemia, Inflammation, and Atherosclerosis Team, Paris, France.
14
6Sorbonne Universités, UPMC Université Paris 06, UMR_S 1166, ICAN, Dyslipidemia, Inflammation, and
15
Atherosclerosis Team, Paris, France. 7Assistance Publique-Hôpitaux de Paris, Visceral surgery
16
Department, Hôpital Européen Georges-Pompidou, Paris, France.
17
18
Key words: Bariatric surgery, ceramides, sphingomyelins, weight loss, obesity
19
Abstract word count: 300
20
Manuscript word count: 4,726
21
Figure: 3
22
Tables: 1
23
Correspondence: Prof. Karine Clément.
24
Institute of Cardiometabolism and Nutrition (ICAN)
25
43-83 boulevard de l’Hôpital, E3M bureau 637
26
75013 Paris, France.
27
Phone: +33 01 40 77 97 28. Email: karine.clement@inserm.fr
28
This paper describes original research that has not been submitted to other publications, nor is it
29
currently under review elsewhere. We declare no conflicts of interest.
30
31
32
Abstract
33
Background/Objectives: Circulating phospholipids and sphingolipids are implicated in obesity related-
34
comorbidities such as insulin resistance and cardiovascular disease. How bariatric surgery affects these
35
important lipid markers is poorly understood. We sought to determine whether Roux-en-Y gastric bypass
36
(RYGB), which is associated with greater metabolic improvement, differentially affects the
37
phosphosphingolipidome compared to adjustable gastric banding (AGB).
38
Subjects/Methods: Fasting sera were available from 59 obese women (BMI range 37-51 kg/m2; n=37
39
RYGB and 22 AGB) before surgery, then at 1 (21 RYGB, 12 AGB) and 3 months follow-up (19 RYGB,
40
12 AGB). HPLC-MS/MS was used to quantify 131 lipids from 9 structural classes. DXA measurements
41
and laboratory parameters were also obtained. The associations between lipids and clinical
42
measurements were studied with P-values adjusted for the false discovery rate (fdr).
43
Results: Both surgical procedures rapidly induced weight loss and improved clinical profiles, with RYGB
44
producing better improvements in fat mass, and serum TC, LDL-C, and orosomucoid (fdr<10%).
Ninety-45
three (of 131) lipids were altered by surgery—the majority decreasing—with 29 lipids differentially
46
affected by RYGB during the study period. The differential effect of the surgeries remained statistically
47
significant for 20 of these lipids after adjusting for differences in weight loss between surgery types. The
48
RYGB signature consisted of phosphatidylcholine species not exceeding 36 carbons, and ceramides
49
and sphingomyelins containing C22 to C25 fatty acids. RYGB also led to a sustained increase in
50
unsaturated ceramide and sphingomyelin species. The RYGB-specific lipid changes were associated
51
with decreases in body weight, total and LDL-C, orosomucoid and increased HOMA-S (fdr<10%).
52
Conclusions: Concomitant with greater metabolic improvement, RYGB induced early and sustained
53
changes in phosphatidylcholines, sphingomyelins, and ceramides that were independent of greater
54
weight loss. These data suggest that RYGB may specifically alter sphingolipid metabolism, which, in
55
part, could explain the better metabolic outcomes of this surgical procedure.
56
57
58
59
60
61
Introduction
62
Morbid obesity is associated with numerous comorbidities including diabetes, nonalcoholic fatty
63
liver disease (NAFLD), and atherosclerosis. Bariatric surgery is an effective treatment for obesity that
64
results in sustained weight loss and improvements in several cardiovascular risk factors (ref. 1). As
65
bariatric surgery is able to resolve T2D in a large number of patients, and even alter the hormonal
66
response to meal ingestion prior to weight loss, many studies have focused on the beneficial effects of
67
gastric bypass on glucose homeostasis (ref. 2). However, the benefits of bariatric surgery also extend to
68
improvements in NAFLD and cardiovascular disease (ref. 3, ref. 4). Systematically evaluating the
69
evolution of biomarkers between different surgeries thus provides a useful model for identifying
70
mechanisms, and eventually novel therapies, for the treatment of a number of obesity comorbidities.
71
The success of bariatric surgery depends on the procedure used. Roux-en-Y gastric bypass
72
(RYGB) involves the creation of a small gastric pouch and diversion of most of the stomach, the
73
duodenum, and part of the proximal jejunum, which are further anastomosed to the distal jejunum.
74
Adjustable gastric banding (AGB) involves restriction of the proximal stomach. Compared to AGB, RYGB
75
results in greater weight loss and better improvements in numerous risk factors, including clinical lipid
76
measurements (ref. 1, ref. 5, ref. 6). While both AGB and RYGB restrict the stomach, the latter is also
77
malabsorptive and alters the physiology of the retained and bypassed parts of the small intestine, and it
78
is these alterations that are hypothesized to explain the greater weight loss following RYGB (ref. 7).
79
There remains continued debate regarding how much RYGB contributes to long-term improvements in
80
glucose control over and above weight loss per se, thus there is need to further define surgery-specific
81
effects on metabolism (ref. 8–10). Lipidomic analysis may provide deeper insight into these effects.
82
With the advent of modern lipidomic technologies, over 500 molecular lipid species have been
83
quantified in human plasma (ref. 11). Phospholipids and sphingolipids, collectively called the
84
phosphosphingolipidome, and which contain the bioactive ceramides, are among the most diverse lipid
85
categories and may act as important biomarkers (ref. 12). For example, plasma levels of sphingolipids
86
and phospholipids are increased in obesity-associated nonalcoholic steatohepatitis (NASH) (ref. 13) and
87
outperform neutral lipids and eicosanoids for predicting liver injury (ref. 14). Serum phospholipids and
88
sphingolipids may reflect synthesis and efflux from metabolically relevant tissues, but can also directly
89
90
cholesterol efflux from macrophages, which is suspected to be an important mechanism in the
91
development of atherosclerosis (ref. 16). Ceramides (Cer) are especially implicated in the pathogenesis
92
of insulin resistance (ref. 17), and it was recently shown that infusion of Cer(d18:1/24:0) into mice can
93
induce peripheral insulin resistance (ref. 18). Little is known about how bariatric surgery affects these
94
important lipids.
95
Separating the effects of RYGB and AGB on serum lipids, particularly after adjusting for
96
differences in weight loss, provides an informative model for deciphering the specific effects of RYGB on
97
metabolism. As the weight loss differences between procedures are less drastic early after surgery, and
98
given the metabolic effects occur almost immediately, the evolution of serum lipids was determined after
99
1 and 3 months of follow-up. Compared to AGB, we hypothesized that RYGB would have a
surgery-100
specific effect on circulating phospholipids and sphingolipids concomitant with the greater metabolic
101
response following this procedure.
Methods
103
Clinical cohort
104
Starting from July 2011 until July 2014, female bariatric surgery candidates with a BMI greater
105
than 40kg/m2 or greater than 35kg/m2 with at least one severe obesity-related comorbidity were recruited
106
into this prospective observational study. Patients were treated in the Obesity Unit of Pitié-Salpetrière
107
Hospital, Institute of Cardiometabolism and Nutrition (ICAN), Paris, France. Patients underwent either
108
adjustable gastric banding (AGB) or Roux-en-Y Gastric Bypass (RYGB) based upon their choice and the
109
agreement of a multidisciplinary clinical panel. After excluding patients who were converted from AGB to
110
RYGB (5 subjects), 59 subjects had sufficient clinical data and serum available for lipidomic analysis to
111
be included in the current study. Ethical approval was obtained from the Research Ethics Committee of
112
Pitié-Salpêtrière Hospital (CPP Ile-de-France). Informed written consent was obtained from all subjects.
113
The Microbaria protocol is registered as clinical trial NCT01454232.
114
Clinical and anthropometric measurements were taken before (M0), one (M1), and three months
115
(M3) after surgery. Anthropometric parameters were estimated by a whole-body fan-beam DXA scanner
116
(Hologic Discovery W, software v12.6, 2; Hologic, Bedford, MA), as previously described (ref. 19).
117
Variables included in this study were total fat-free mass (FFM, in kg) and total fat mass (FM, in kg and
118
percent).
119
Biological analysis
120
Blood samples were collected after an overnight fast to measure routine biochemical parameters, as
121
described previously (ref. 13). Serum glucose, total cholesterol (TC), high-density lipoprotein-cholesterol
122
(HDL-C), alanine aminotransferase (ALT), aspartate aminotransferase (AST), and gamma-glutamyl
123
transpeptidase (γGT) were measured enzymatically. Low-density lipoprotein-cholesterol (LDL-C) was
124
estimated by the Friedewald formula. ApoA1 and ApoB were measured by immunonephelometry. Serum
125
insulin was assayed by Bi-INSULIN IRMA (CisBio International, Gif-sur-Yvette, France); leptin and
126
adiponectin by radioimmunoassay (Linco Research, Saint Louis, MI, USA); interleukin-6 (IL-6) by ELISA
127
(QuantikineUS, R&D System Europe Ltd, Abingdon, UK); and high-sensitivity C-reactive protein (CRP)
128
and orosomucoid by an IMMAGE automatic immunoassay system (Beckman-Coulter, Fullerton, CA,
129
USA). Insulin sensitivity was measured by the McAuley index (ref. 20) and HOMA-%S (HOMA2-S) (ref.
21). The latter was calculated using HOMA-CIGMA software, and the McAuley index was calculated as
131
= exp[2.63 – 0.28ln(insulin) – 0.31ln(triglycerides)].
132
Lipidomics
133
Targeted lipidomics analysis of phospholipids and sphingolipids was conducted by
HPLC-134
MS/MS, as described previously (ref. 13, ref. 16). Serum was prepared from whole blood after an
135
overnight fast. Whole blood was rested for 30 minutes at 4°C and then centrifuged for 10 minutes at
136
3000 rpm at 4°C. Serum was aliquoted into dry tubes and immediately stored at -80°C. Lipids were
137
extracted by acidified methanol:chloroform with internal standards for each lipid class and fatty acid
138
saturation level (Avanti Polar Lipids, Alabaster, AL, USA). Serum had not undergone any freeze-thaw
139
cycles prior to extraction. Samples were extracted in 4 batches, with repeated measures of any one
140
subject included in the same batch. One hundred and fifty-four lipids were quantified, using 19 external
141
standards (Avanti Polar Lipids, Alabaster, AL, USA) as previously described (ref. 13, ref. 16), and
142
include Phosphatidylcholines (PC), Phosphatidylethanolamines (PE), lyso-phosphatidylcholines (LPC)
143
and –ethanolamines (LPE), phosphatidylinositols (PI), phosphatidylserines (PS), phosphatidylglycerols
144
(PG), phosphatidic acids (PA), sphingomyelins (SM). Ceramides (Cer) could be further classified as
145
dihydroceramides (DHCer), labeled as Cer(d18:0) in standard nomenclature, and sphingosine- or
146
sphingadienine-containing ceramides, that is Cer(d18:1) and Cer(d18:2), respectively. Unfortunately, this
147
methodology could not identify the sphingosine and fatty acid component of each SM. A previous
148
publication from the Lipid MAPS consortium, however, provides the proportion of different
sphingosine-149
fatty acid combinations for each measured SM in their large representative sample (ref. 11). Using these
150
estimates, presumed fatty acid content was assigned for each SM species if greater than 60% of that
151
SM species could be attributed to one sphingosine-fatty acid pair and if it did not contain a mixture of
152
saturated and unsaturated fatty acids. For example, SM(42:1) was hypothesized to be SM(d18:1/24:0)
153
as this specific sphingosine-fatty acid combination comprised 100% of the reported SM(42:1). Finally,
154
measurements below the level of quantitation cannot be treated as missing, and as simple 0-imputation
155
underestimates the true value, multiplicative log-normal-randomized imputation was computed with the
156
zCompositions package in R(ref. 22). Only lipids with at least 80% quantitated values and detected at all
157
3 time points were included, leaving 131 lipids in the analysis.
Analyses of serum free fatty acids (FFA) were performed on a UPLC Waters Acquity (Waters Corp,
159
Saint-Quentin-en-Yvelines, France) coupled to an Orbitrap-based instrument: a Q-Exactive (Thermo
160
Fisher Scientific, Illkirch, France). Briefly, 50 µl of serum was extracted with 400µl of frozen acetonitrile
161
containing 0.1% of formic acid and a mix of labelled internal standards (16 amino acids). Mass spec data
162
were processed using XCMS and CAMERA packages in R software. The resulting dataset was filtered,
163
normalized and annotated based on standard guidelines (ref. 23, ref. 24). FFA were annotated using an
164
in-house database built using commercially available standards.
165
166
Statistical analysis
167
All analyses were conducted in R version 3.2.3 with the indicated (packages). Lipidomics data
168
were log-transformed. Distributions for clinical variables and model residuals were examined and, when
169
necessary, variables were log or square-root transformed. Tables report untransformed means and
170
standard errors for easier interpretation. Means at baseline were compared using Welch’s t-test.
171
Permutational MANOVA of the Euclidean distance matrix was used to test for multivariate differences
172
between groups (vegan). The longitudinal effects of surgery were analyzed using 2 factor mixed effects
173
ANOVA including a random intercept for subject (lme4, car). Due to their estimation by maximum
174
likelihood, mixed effects models are robust to non-informative dropout of patients, which was present in
175
this study, and thus efficiently use all available data (ref. 25). With the exception of the post-hoc tests
176
described below, all p-values were adjusted for multiple comparisons using the Benjamini-Hochberg
177
false discovery rate. Padj, or the false discovery rate, has a different interpretation than the p-value—the
178
proportion of expected false positive results at a given threshold—and is often set to different thresholds
179
than the strict convention of 0.05 used for the type 1 error rate. With this in mind, Padj <0.1 was used for
180
interaction effects, which are often tested at less conservative thresholds than main effects, and for
181
correlation matrices, which tend to have a high number of redundant comparisons and thus may suffer
182
from adjustment-induced loss of power. Following a significant interaction, data were stratified by
183
surgery type and all pair-wise comparisons between means at M0, M1, and M3 were tested with the
184
family-wise error rate maintained at alpha=0.05 using one-step generalized linear hypothesis tests
185
(multcomp). Linear regressions controlling for baseline lipid concentration were used to test for the
difference between RYGB and AGB on the change in each lipid to M3 while controlling for the change in
187
body weight. That is, a regression model of the form:
188
189
𝐿𝑖𝑝𝑖𝑑𝑀3= 𝛽 0+ 𝛽 1(𝐿𝑖𝑝𝑖𝑑𝑀0) + 𝛽 2(𝑊𝑒𝑖𝑔ℎ𝑡𝑀0) + 𝛽 3(∆𝑊𝑒𝑖𝑔ℎ𝑡𝑀3−𝑀0) + 𝛽 4(𝑆𝑢𝑟𝑔𝑒𝑟𝑦𝑅𝑌𝐺𝐵=1,𝐴𝐺𝐵=0)
190
191
For non-significant interactions, a main effect of time was considered significant at Padj <0.05,
192
and post-hoc tests were applied across time. All fold-changes were based on differences in means.
193
Between-lipid correlations and lipid-clinical correlations were calculated using biweight mid-correlation,
194
an outlier-robust analog of the Pearson correlation (WGCNA).
195
196
197
Results
198
Baseline and longitudinal clinical variables between surgery types
199
Thirty-seven and 22 patients underwent RYGB and AGB, respectively, with approximately 45%
200
lost to follow-up at M1 and M3 for each group (see Table 1 for clinical characteristics). Baseline
201
characteristics did not differ between patients with complete or incomplete data during follow-up (data
202
not shown), indicating that the imbalance across time would not bias the results. The mean age was
203
34.5 (±1.6) and 37.3 (±1.9) years for AGB and RYGB, respectively, and was not significantly different
204
between groups. At baseline, and compared to AGB, RYGB patients had 2.9 kg/m2 higher BMI, 11.1
205
IU/L higher γGT, 0.6mM higher fasting glucose (with 24% T2D in RYGB and 5% in AGB), 0.22mM higher
206
fasting triglycerides, and 0.4% higher HbA1c, all P<0.05. However, no variables were significantly
207
different after adjusting for the false discovery rate (all Padj>0.1). 22% of RYGB patients were treated
208
with metformin or statins at baseline, while no AGB patients were on these medications (P=0.051).
209
There were no statistically significant differences in the prevalence of T2D. Thus, RYGB tended towards
210
higher obesity and worse diabetes risk factors.
211
Regarding the effect of bariatric surgery, RYGB generally resulted in better weight and body
212
composition improvement than AGB, as expected (Table 1). RYGB patients decreased from a mean BMI
213
of 46.5 at baseline to 37.9 at M3. Following AGB, mean BMI decreased from 43.6 to 38.3. Total FM and
214
FFM decreased to a greater extent in RYGB than AGB, and percent FM decreased by 3.4% and 2.4% at
215
M3, respectively. Leptin also fell more rapidly in RYGB. Clinical biochemistries improved to a greater
216
extent after RYGB than AGB. Specifically, Apo-A1, LDL-C, and TC decreased by both M1 and M3 in
217
RYGB, but returned to baseline in AGB at M3. Fasting insulin decreased by 40% then 51% in RYGB,
218
and 43% in AGB at M3 only. HOMA2-S decreased more rapidly and to a greater extent in RYGB than
219
AGB, but the McAuley index improved equivalently in both groups.
220
γGT was the only liver enzyme to decrease significantly in AGB by M3. With RYGB, γGT was
221
significantly decreased, while both ALT and AST were significantly increased from baseline at both M1
222
and M3. Orosomucoid, or alpha-1-acid glycoprotein, an acute phase protein, decreased by 20% in
223
RYGB, but was unchanged by AGB. Other parameters, such as CRP, HbA1c, triglycerides, and
224
adiponectin, were altered to the same extent in each surgical procedure. In summary, both surgeries
resulted in improvements in the majority of measured parameters, but RYGB resulted in greater weight
226
loss, including both lean and fat masses, and persistent improvements in TC, LDL-C, and orosomucoid.
227
228
Limited associations between baseline clinical variables and the phosphosphingolipidome
229
Given the slight clinical differences between patients undergoing the two surgeries, the
230
relationships between clinical parameters and the phosphosphingolipidome were examined at baseline
231
to identify potential confounding factors. There were no significant differences in the serum
232
concentrations of any of the lipids between surgical groups (Pmultivariate=0.33; Fig 1A; supplementary table
233
1). Baseline metformin or statin treatment could potentially confound the longitudinal effect on circulating
234
lipids, but neither metformin (Pmultivariate=0.45; data not shown; supplementary table 1) nor statins
235
(Pmultivariate=0.24; Fig 1B; supplementary table 1) were associated with lipidomic measurements.
236
Exploratory analysis revealed that lipids were primarily organized by their structural classes and thus
237
were analyzed in this manner. Shown in Figure 1C, total Cer, SM, and PC were strongly positively
238
associated with Apo-B, LDL-C, and TC (all r>0.49), whereas total PE (r=0.52), PG (r=0.59), LPE
239
(r=0.38), and PI (r=0.49) were positively associated with fasting triglycerides. Total PC was associated
240
with Apo-A1 and triglycerides (r=0.46 and 0.51), and total PG was inversely correlated with the McAuley
241
insulin sensitivity index (r=-0.45). Given the absence of an association with surgery status and baseline
242
lipidomics, and the somewhat sparse associations with other clinical variables, the longitudinal effect of
243
each surgery is unlikely confounded by baseline differences between the two groups.
244
245
Procedure-independent and -dependent changes in phospholipids and sphingolipids
246
For the longitudinal analysis, the main effects of surgery and the interaction between the two
247
surgeries and time were evaluated. A main effect of time (and no interaction) was detected for 64 lipids
248
(Padj<0.05), whereby 54 of these lipids decreased from baseline and included all classes except PA (Fig
249
1D-1F, Supplementary Table 2). The vast majority of these lipids were decreased at both M1 and M3,
250
which created a markedly similar pattern of change at each time point (Fig 1E). Eight of the ten most
251
statistically significantly decreased lipids were PE species. Only Cer and SM species, and one PC
252
species, were significantly increased following surgery, and included Cer(d18:1/16:0), Cer(d18:1/18:0),
253
and Cer(d18:1/24:1) (Fig 2E and 2F, Supplementary Table 2).
A significant interaction (Padj<0.1) was detected for 29 lipids (Fig 1D), indicating that they
255
changed differentially between the two surgery types. The majority of lipids were decreased following
256
each surgery and consisted of a number of PC, SM, and Cer, and also PE(38:3) (Fig 2A, Supplementary
257
Table 2). PC species, which did not exceed 36 carbons, decreased by M1 and remained suppressed at
258
M3 by 20 to 64% in RYGB, whereas they either returned or tended to return to baseline values in AGB.
259
Ceramides, which included DHCer, Cer(d18:1), and Cer(d18:2) containing 22 to 24 carbon fatty acids,
260
were also decreased by M1 and remained decreased by 35-60% at M3 in RYGB, but returned to
261
baseline in AGB. All SM with 1 double-bond decreased and remained decreased with RYGB, but they
262
returned to baseline values in AGB (with the exception of SM-32:1). Thus, RYGB selectively induces a
263
sustained decrease in these lipids. Interestingly, 4 surgery-dependent lipids were increased during
264
follow-up. SM(42:3), SM(42:4), and SM(36:2), all polyunsaturated, increased at M1 and remained
265
elevated by 24-33% in RYGB, but were only elevated by 17-23% in AGB at M1. Cer(d18:1/26:1) was
266
increased by over 75% in RYGB, but did not differ at any time in AGB.
267
Body weight decreased to a greater extent in RYGB than AGB, therefore the kinetic differences
268
between RYGB and AGB at M3 were also tested after adjusting for weight loss. We observed two-thirds
269
of the RYGB-specific lipids were differentially altered by RYGB independent of differences in weight loss
270
(Fig 2B, Supplementary Table 3). These data reveal a PC and sphingolipid “signature” of RYGB that is
271
independent from the greater weight loss induced by this procedure.
272
273
The RYGB lipid signature is related to differences in metabolic outcomes
274
Having identified a group of surgery-dependent lipid species, characterizing the lipid-lipid and
275
clinical-lipid associations could elucidate potential mechanisms for the RYGB-specific lipid
276
improvements. After assigning putative fatty acid content to each SM, marked agreement between the
277
changes from baseline to M3 in SM, Cer(d18:1) and Cer(d18:2) were observed based on the carbon
278
length and saturation in RYGB patients (Fig 3A). Particularly strong agreement is observed for
279
sphingolipid species with C22 to C24 fatty acids attached to the sphingoid backbone, which all
280
decreased following RYGB throughout the 3 months follow up, suggesting a coordinated decrease in
281
Cer and the corresponding SM.
Finally, we sought to determine whether the RYGB dependent lipid modifications were related to
283
the clinical parameters that changed to a greater extent in RYGB by M3 (Fig 3B). With the exception of
284
an inverse association with Cer(d18:1/26:1), there were no statistically significant associations with
285
changes in FM or %FM, which corroborates a body fat-independent effect of RYGB on the identified
286
lipids. The RYGB-specific decreases in SM, some PC, and Cer species were most strongly associated
287
with the decrease in TC, LDL-C, orosomucoid, leptin, body weight, FFM, and to a lesser extent,
HOMA2-288
S. A number of these lipids were also associated with the decline in γGT. On the other hand, the
289
increase in the three unsaturated SM and Cer(d18:1/26:1) were associated with amelioration of the
290
aforementioned clinical parameters, demonstrating heterogeneity in the clinical relevance of individual
291
sphingolipid species. The potential effect of differences in lipolysis were tested by measuring fasting
292
serum saturated free fatty acids (FFA). Both surgeries increased C16, C18, and C20 FFA after one
293
month, but there was no statistically significant interactions between surgery type and time (Fig 3C).
294
FFA(16:0) (palmitate) was higher in RYGB than AGB throughout the study period (surgery main-effect
295
P<0.01).
296
297
298
Discussion
299
The objective of this study was to identify the differential effects of bariatric surgeries on the
300
serum phosphosphingolipidome. The most significant finding is that RYGB patients had decreases in a
301
number of PC, SM, and longer chain Cer species by both 1 and 3 months post-op, whereas nearly all of
302
these same lipids returned to baseline within 3 months following AGB. Importantly, the majority of
303
RYGB-specific changes remained independent of the greater weight loss following RYGB. A number of
304
unsaturated SM and Cer were actually increased following bariatric surgery. The RYGB lipidomic
305
signature was associated with improvements in cholesterol, body weight, orosomucoid, γGT, and to
306
some extent insulin sensitivity. These findings may reveal a specific effect of RYGB on a number of
307
biologically relevant lipids.
308
At baseline, PC, SM, and Cer were positively associated with total cholesterol, LDL-C, and ApoB,
309
which are biomarkers of atherosclerosis, while PG, PE, and PI were associated with triglycerides. These
310
findings may be attributed to the distribution of lipids in lipoprotein fractions: 50% and 60% of SM and
311
Cer, respectively, are found in LDL (ref. 26). The lack of associations with other clinical phenotypes is
312
striking given previous reports (ref. 13, ref. 14, ref. 27). It is possible that at the extreme end of obesity,
313
the phosphosphingolipidome poorly differentiates clinical phenotypes based on simple clinical
314
chemistries.
315
The majority of lipids, representing nearly all classes measured, decreased equivalently between
316
both surgical groups. The broad effect of surgically-induced weight loss has been described by others. A
317
previous, though much smaller study of only 5 subjects, also reported decreases in LPC, PC, PE, PI, SM
318
and Cer at 3 months following RYGB (ref. 28). RYGB has also been shown to induce a sustained
319
decrease in a number of Cer species for up to 6 months (ref. 29). In addition, a number of SM, PC, and
320
LPC species were among the most altered lipids following RYGB as soon as 4 days after surgery, and
321
this occurred to a greater extent in patients with diabetes remission compared to non-remitters 2 years
322
after surgery (ref. 30). However, the current study extends these previous reports in an important way:
323
RYGB could be shown to have substantial weight loss-independent effects on specific lipid classes.
324
Given the greater metabolic improvement induced by RYGB compared to AGB, we reasoned that
325
RYGB-specific lipid alterations would identify clinically relevant biomarkers. To this end, the current study
326
327
both decreases and increases in a number of SM and longer chain Cer and DH-Cer. The majority of
328
these changes remained significant after adjust for the greater weight loss in RYGB. It is noteworthy that
329
these 3 classes were identified given their shared biochemical synthesis: DH-Cer are desaturated to
330
Cer, and SM are formed by Cer and PC as source of phosphocholine (Figure 3C). While the
331
sphingosine-fatty acid content of our detected SM could only be presumed, we observed a remarkable
332
consistency across the fatty acid lengths decreased in RYGB between SM and Cer. The similarity was
333
most striking for C22 - C24 fatty acids. Interestingly, a previous metabolomics study by our group
334
identified Cer(d18:1/24:0) as one of the metabolites decreased at 3 and 6 months following RYGB,
335
further supporting the particular effect on longer Cer species (ref. 31). Phospholipids and sphingolipids
336
are related to a number of cardiometabolic diseases. For example, PC synthesis is a regulator of VLDL
337
secretion and hepatic steatosis, and further, circulating PC is an important source of triglycerides in
338
steatosis (ref. 15, ref. 32). The SM and PC species differentially affected by RYGB are increased in
339
coronary artery disease and associated with increased mortality (ref. 33, ref. 34). Bariatric surgery has
340
been shown to improve NAFLD (ref. 3) and reduce cardiovascular mortality (ref. 4), therefore the
341
changes in PC and SM could be involved. The role of Cer may be more difficult to interpret.
342
The specificity for very long chain Cer in the RYGB signature highlights the complicated role of
343
Cer acylation in metabolism (ref. 35). A family of ceramide synthase genes—CerS1 to CerS6—that have
344
different fatty acid affinities and different tissue expression levels determine de novo Cer fatty acid
345
content (ref. 36). Recent experiments in mice that have genetically manipulated CerS2, CerS5, and
346
CerS6—where the first produces longer chain Cer and the latter two produce C16 ceramides—showed
347
that elevation in C16:0, but not C24:0 or C24:1, induce insulin resistance (ref. 37–39). Furthermore,
348
Cer(d18:1/18:0) appears to be the most detrimental in skeletal muscle (ref. 40). A large epidemiology
349
study recently showed that Cer(18:1/16:0) was associated with increased risk of cardiovascular mortality,
350
whereas elevated Cer(d18:1/24:0) showed a protective relationship (ref. 41). Thus our results present a
351
paradox: serum C16 and C18 Cer were transiently increased following surgery-induced weight loss
352
despite rapid improvements in HOMA-S. The observed post-surgery rise in fasting serum FFA could
353
potentially explain this transient rise in long-chain Cer. On the other hand, CerS2 is the major liver
354
isoform and produces C20 to C26 Cer (ref. 36). The liver is likely a major contributor to serum Cer (and
355
SM) levels due to secretion into lipoproteins, which is increased by de novo sphingolipid synthesis (ref.
42, ref. 43). The distinct decrease in circulating C22 to C24 ceramides may therefore reflect a specific
357
effect of RYGB on hepatic Cer synthesis, secretion, or both. Indeed, a number of, though not all, studies
358
in humans have shown similar relationships between ceramides and impaired glucose homeostasis
359
ranging from C16 to C24 Cer (ref. 27, ref. 44). Importantly, enrichment of LDL with either Cer(d18:1/16:0)
360
or Cer(d18:1/24:0) in mice produced equivalent degrees of insulin resistance and inflammation, both in
361
vitro and in vivo (ref. 18). Thus, while there is little doubt that Cer(d18:1/16:0) and Cer(d18:1/18:0) are
362
likely the most deleterious species, the findings in the current study emphasize the importance of better
363
understanding the role of serum or lipoprotein ceramide acyl chain length, which could help better
364
understand the effects of RYGB, diabetes and cardiovascular risk in general.
365
While the effect of RYGB remained independent of changes in weight, nevertheless, weight loss
366
was associated with decreases in PC, SM, and Cer, consistent with an important role of obesity and
367
increased sphingolipid levels. It is unclear why decreases in FFM would be better correlated to the
368
changes in measured lipids compared to FM. This relationship may simply reflect a proportionally greater
369
loss of FFM in RYGB and thus simply a coincident association rather than an effect of changes in FFM
370
per se (ref. 45). TC, LDL-C, and orosomucoid remained decreased by month 3 in RYGB, but were
371
unchanged by AGB. This same temporal pattern was observed in the RYGB-specific Cer and SM
372
species. Inflammation is a potent inducer of sphingolipid accumulation (ref. 46), and given the reduced
373
levels of orosomucoid in the RYGB group, a greater reduction in hepatic inflammation could contribute to
374
these specific lipid improvements. LDL-ceramides are increased in T2D and were selectively decreased
375
following diet-induced weight loss (ref. 18), thus the temporal association between LDL-C and ceramides
376
could also reflect this partitioning. The direct associations between reductions in Cer(d18:1/23:0) and
377
Cer(d18:1/24:0) and improvements in HOMA2S are difficult to interpret, as described above, but again,
378
warrant further investigation. Greater reductions in saturated FFA exposure could alter ceramide
379
synthesis (ref. 47), however changes in fasting FFA were not different between the surgeries, suggesting
380
that differential effects on lipolysis do not explain the altered sphingolipid responses. Finally, the
381
changes in Cer-26:1, SM-36:2, SM-42:3, and SM-42:4 were entirely dependent upon changes in body
382
weight, unlike the saturated ones, indicating that circulating levels of saturated and unsaturated
383
sphingolipids may be influenced by different mechanisms.
Several limitations must be discussed. While the short-term follow-up of this study was specific to
385
our research hypothesis, our results cannot immediately be generalized to longer follow-up. Analyses
386
beyond 1, 2, or even 5 years will be necessary to determine if these lipid changes are sustained and
387
how they are related to other clinical improvements. As the patients in the short 3 month follow-up are
388
still losing weight, an important question is the role of ongoing weight loss vs. a sustained lower body
389
weight. This again emphasizes the need for longer term studies. Our sample only included women;
390
similar studies in men are warranted to exclude sex-specific differences. Furthermore, as this study was
391
not randomized, we cannot exclude the possibility that the apparent effects of surgery are confounded
392
by baseline differences in the surgery groups, whether measured or unmeasured. Finally, changes in
393
calorie or nutrient consumption and absorption or communication between the intestine and liver, e.g.
394
bile acids and FXR signaling (ref. 48), could also be important contributors to sphingolipid metabolism
395
and secretion. Indeed, a recent report on a smaller subset of the current cohort indicates greater
396
decreases in total energy and meat and fish intake in the RYGB group compared to AGB (ref. 49). The
397
very limited number of subjects with both dietary intake and lipidomics data unfortunately prevented
398
more in-depth analysis. Follow-up studies controlling for energy and nutrient intake, as well as the rate of
399
weight loss, will be necessary to attribute a unique effect of RYGB on sphingolipid metabolism.
400
In summary, RYGB patients demonstrated greater and sustained decreases in a number of PC,
401
SM, and longer chain Cer compared to AGB, the majority of which occurred independent of differences
402
in weight loss. A previously unidentified increase in unsaturated SM and Cer following weight loss was
403
also observed. While surgically induced weight loss, regardless of surgery type, has an important effect
404
on circulating phospholipids and sphingolipids, the RYGB-specific lipid signature is associated with
405
concomitant decreases in body weight, circulating cholesterol, insulin sensitivity and orosomucoid.
406
Longer follow-up is warranted to determine the long-term effects of RYGB on these lipids, but the current
407
findings suggest an improved sphingolipid profile in the reduction of cardiometabolic risk following
408
RYGB.
Supplementary information
410
Supplementary information is available at the International Journal of Obesity’s website.
411
412
Acknowledgements
413
Thank you to Valentine Lemoine for patient recruitment, Florence Marchelli for data collection, and
414
Sophie Festis for DEXA analyses as well as to Agathe Arlotti for research program coordination. We
415
would also like to thank the nurses and technicians, and of course, the patients themselves for their
416
invaluable contribution. This work was supported by Programme Hospitalier de Reserche Clinique
417
(PHRC Microbaria AOM10285/P100111), Horizon 2020 Framework Program (EPoS, grant #634413),
418
and the European Foundation for the Study of Diabetes Albert Renold travel fellowship (BDK).
References
420
1. Sjöström L, Lindroos A-K, Peltonen M, Torgerson J, Bouchard C, Carlsson B et al. Lifestyle,
421
diabetes, and cardiovascular risk factors 10 years after bariatric surgery. New England Journal of
422
Medicine 2004;351:2683-2693.
423
2. Bradley D, Magkos F, Klein S. Effects of bariatric surgery on glucose homeostasis and type 2
424
diabetes. Gastroenterology 2012;143:897-912.
425
3. Caiazzo R, Lassailly G, Leteurtre E, Baud G, Verkindt H, Raverdy V et al. Roux-en-Y gastric
426
bypass versus adjustable gastric banding to reduce nonalcoholic fatty liver disease: a 5-year
427
controlled longitudinal study. Ann Surg 2014;260:893-8; discussion 898.
428
4. Sjöström L, Peltonen M, Jacobson P, Sjöström CD, Karason K, Wedel H et al. Bariatric surgery
429
and long-term cardiovascular events. JAMA 2012;307:56-65.
430
5. Buchwald H, Estok R, Fahrbach K, Banel D, Jensen MD, Pories WJ et al. Weight and type 2
431
diabetes after bariatric surgery: systematic review and meta-analysis. Am J Med
2009;122:248-432
256.e5.
433
6. Heffron SP, Parikh A, Volodarskiy A, Ren-Fielding C, Schwartzbard A, Nicholson J et al. Changes
434
in Lipid Profile of Obese Patients following Contemporary Bariatric Surgery: A Meta-Analysis. Am J
435
Med 2016
436
7. Seeley RJ, Chambers AP, Sandoval DA. The Role of Gut Adaptation in the Potent Effects of
437
Multiple Bariatric Surgeries on Obesity and Diabetes. Cell Metabolism 2015;21:369-378.
438
8. Bradley D, Conte C, Mittendorfer B, Eagon JC, Varela JE, Fabbrini E et al. Gastric bypass and
439
banding equally improve insulin sensitivity and β cell function. J Clin Invest 2012;122:4667-4674.
440
9. Jackness C, Karmally W, Febres G, Conwell IM, Ahmed L, Bessler M et al. Very low-calorie diet
441
mimics the early beneficial effect of Roux-en-Y gastric bypass on insulin sensitivity and β-cell
442
Function in type 2 diabetic patients. Diabetes 2013;62:3027-3032.
443
10. Sjöholm K, Sjöström E, Carlsson LMS, Peltonen M. Weight Change–Adjusted Effects of Gastric
444
Bypass Surgery on Glucose Metabolism: Two- and 10-Year Results From the Swedish Obese
445
Subjects (SOS) Study. Dia Care 2015dc151407.
446
11. Quehenberger O, Armando AM, Brown AH, Milne SB, Myers DS, Merrill AH et al. Lipidomics
reveals a remarkable diversity of lipids in human plasma. J Lipid Res 2010;51:3299-3305.
448
12. Quehenberger O, Dennis EA. The human plasma lipidome. New England Journal of Medicine
449
2011;365:1812-1823.
450
13. Anjani K, Lhomme M, Sokolovska N, Poitu C, Aron-Winewsky J, Bouillot B et al. Circulating
451
phospholipid profiling identifies portal contribution to NASH signature in obesity. J Hepatology
452
2015;62:905-912.
453
14. Gorden DL, Myers DS, Ivanova PT, Fahy E, Maurya MR, Gupta S et al. Biomarkers of NAFLD
454
progression: a lipidomics approach to an epidemic. J Lipid Res 2015;56:722-736.
455
15. van der Veen JN, Lingrell S, Vance DE. The membrane lipid phosphatidylcholine is an unexpected
456
source of triacylglycerol in the liver. J Biol Chem 2012;287:23418-23426.
457
16. Camont L, Lhomme M, Rached F, Le Goff W, Nègre-Salvayre A, Salvayre R et al. Small, Dense
458
High-Density Lipoprotein-3 Particles Are Enriched in Negatively Charged Phospholipids Relevance
459
to Cellular Cholesterol Efflux, Antioxidative, Antithrombotic, Anti-Inflammatory, and Antiapoptotic
460
Functionalities. Arteriosclerosis, thrombosis, and vascular biology 2013;33:2715-2723.
461
17. Bikman BT, Summers SA. Ceramides as modulators of cellular and whole-body metabolism. J Clin
462
Invest 2011;121:4222-4230.
463
18. Boon J, Hoy AJ, Stark R, Brown RD, Meex RC, Henstridge DC et al. Ceramides contained in LDL
464
are elevated in type 2 diabetes and promote inflammation and skeletal muscle insulin resistance.
465
Diabetes 2013;62:401-410.
466
19. Ciangura C, Bouillot JL, Lloret-Linares C, Poitou C, Veyrie N, Basdevant A et al. Dynamics of
467
change in total and regional body composition after gastric bypass in obese patients. Obesity
468
(Silver Spring) 2010;18:760-765.
469
20. McAuley KA, Williams SM, Mann JI, Walker RJ, Lewis-Barned NJ, Temple LA et al. Diagnosing
470
insulin resistance in the general population. Diabetes Care 2001;24:460-464.
471
21. Wallace TM, Levy JC, Matthews DR. Use and abuse of HOMA modeling. Diabetes Care
472
2004;27:1487-1495.
473
22. Palarea-Albaladejo J, Martin-Fernandez JA. Values below detection limit in compositional chemical
474
data. Anal Chim Acta 2013;764:32-43.
475
476
for large-scale metabolic profiling of serum and plasma using gas chromatography and liquid
477
chromatography coupled to mass spectrometry. Nat Protoc 2011;6:1060-1083.
478
24. Sumner LW, Amberg A, Barrett D, Beale MH, Beger R, Daykin CA et al. Proposed minimum
479
reporting standards for chemical analysis Chemical Analysis Working Group (CAWG)
480
Metabolomics Standards Initiative (MSI). Metabolomics 2007;3:211-221.
481
25. Little RA, Rubin DB. Statistical analysis with missing data. John Wiley & Sons: Hoboken, New
482
Jersey, 2002,
483
26. Wiesner P, Leidl K, Boettcher A, Schmitz G, Liebisch G. Lipid profiling of FPLC-separated
484
lipoprotein fractions by electrospray ionization tandem mass spectrometry. J Lipid Res
485
2009;50:574-585.
486
27. Meikle PJ, Wong G, Barlow CK, Weir JM, Greeve MA, MacIntosh GL et al. Plasma lipid profiling
487
shows similar associations with prediabetes and type 2 diabetes. PLoS One 2013;8:e74341.
488
28. Graessler J, Bornstein TD, Goel D, Bhalla VP, Lohmann T, Wolf T et al. Lipidomic profiling before
489
and after Roux-en-Y gastric bypass in obese patients with diabetes. Pharmacogenomics J
490
2014;14:201-207.
491
29. Huang H, Kasumov T, Gatmaitan P, Heneghan HM, Kashyap SR, Schauer PR et al. Gastric
492
Bypass Surgery Reduces Plasma Ceramide Subspecies and Improves Insulin Sensitivity in
493
Severely Obese Patients. Obesity 2011;19:2235-2240.
494
30. Arora T, Velagapudi V, Pournaras DJ, Welbourn R, le Roux CW, Ore?i M et al. Roux-en-Y Gastric
495
Bypass Surgery Induces Early Plasma Metabolomic and Lipidomic Alterations in Humans
496
Associated with Diabetes Remission. 2015
497
31. Mutch DM, Fuhrmann JC, Rein D, Wiemer JC, Bouillot JL, Poitou C et al. Metabolite profiling
498
identifies candidate markers reflecting the clinical adaptations associated with Roux-en-Y gastric
499
bypass surgery. PLoS One 2009;4:e7905.
500
32. Noga AA, Zhao Y, Vance DE. An unexpected requirement for phosphatidylethanolamine
N-501
methyltransferase in the secretion of very low density lipoproteins. J Biol Chem
2002;277:42358-502
42365.
503
33. Schlitt A, Blankenberg S, Yan D, von Gizycki H, Buerke M, Werdan K et al. Further evaluation of
504
plasma sphingomyelin levels as a risk factor for coronary artery disease. Nutr Metab (Lond)
2006;3:5.
506
34. Sigruener A, Kleber ME, Heimerl S, Liebisch G, Schmitz G, Maerz W. Glycerophospholipid and
507
sphingolipid species and mortality: the Ludwigshafen Risk and Cardiovascular Health (LURIC)
508
study. PLoS One 2014;9:e85724.
509
35. Meikle PJ, Summers SA. Sphingolipids and phospholipids in insulin resistance and related
510
metabolic disorders. Nat Rev Endocrinol 2016
511
36. Levy M, Futerman AH. Mammalian ceramide synthases. IUBMB Life 2010NA.
512
37. Raichur S, Wang ST, Chan PW, Li Y, Ching J, Chaurasia B et al. CerS2 haploinsufficiency inhibits
513
beta-oxidation and confers susceptibility to diet-induced steatohepatitis and insulin resistance. Cell
514
Metab 2014;20:687-695.
515
38. Turpin SM, Nicholls HT, Willmes DM, Mourier A, Brodesser S, Wunderlich CM et al.
Obesity-516
induced CerS6-dependent C16:0 ceramide production promotes weight gain and glucose
517
intolerance. Cell Metab 2014;20:678-686.
518
39. Gosejacob D, Jäger PS, Vom Dorp K, Frejno M, Carstensen AC, Köhnke M et al. Ceramide
519
synthase 5 is essential to maintain C16:0 ceramide pools and contributes to the development of
520
diet induced obesity. J Biol Chem 2016
521
40. Bergman BC, Brozinick JT, Strauss A, Bacon S, Kerege A, Bui HH et al. Muscle sphingolipids
522
during rest and exercise: a C18:0 signature for insulin resistance in humans. Diabetologia
523
2016;59:785-798.
524
41. Laaksonen R, Ekroos K, Sysi-Aho M, Hilvo M, Vihervaara T, Kauhanen D et al. Plasma ceramides
525
predict cardiovascular death in patients with stable coronary artery disease and acute coronary
526
syndromes beyond LDL-cholesterol. Eur Heart J 2016;37:1967-1976.
527
42. Merrill AH, Lingrell S, Wang E, Nikolova-Karakashian M, Vales TR, Vance DE. Sphingolipid
528
biosynthesis de novo by rat hepatocytes in culture. Ceramide and sphingomyelin are associated
529
with, but not required for, very low density lipoprotein secretion. Journal of Biological Chemistry
530
1995;270:13834-13841.
531
43. Watt MJ, Barnett AC, Bruce CR, Schenk S, Horowitz JF, Hoy AJ. Regulation of plasma ceramide
532
levels with fatty acid oversupply: evidence that the liver detects and secretes de novo synthesised
533
534
44. Bergman BC, Brozinick JT, Strauss A, Bacon S, Kerege A, Bui HH et al. Serum sphingolipids:
535
relationships to insulin sensitivity and changes with exercise in humans. Am J Physiol Endocrinol
536
Metab 2015;309:E398-408.
537
45. Chaston TB, Dixon JB, O’Brien PE. Changes in fat-free mass during significant weight loss: a
538
systematic review. Int J Obes (Lond) 2007;31:743-750.
539
46. Memon RA, Holleran WM, Moser AH, Seki T, Uchida Y, Fuller J et al. Endotoxin and Cytokines
540
Increase Hepatic Sphingolipid Biosynthesis and Produce Lipoproteins Enriched in Ceramides and
541
Sphingomyelin. Arteriosclerosis, Thrombosis, and Vascular Biology 1998;18:1257-1265.
542
47. Chavez JA, Summers SA. Characterizing the effects of saturated fatty acids on insulin signaling
543
and ceramide and diacylglycerol accumulation in 3T3-L1 adipocytes and C2C12 myotubes.
544
Archives of Biochemistry and Biophysics 2003;419:101-109.
545
48. Jiang C, Xie C, Li F, Zhang L, Nichols RG, Krausz KW et al. Intestinal farnesoid X receptor
546
signaling promotes nonalcoholic fatty liver disease. J Clin Invest 2015;125:386-402.
547
49. Aron-Wisnewsky J, Verger EO, Bounaix C, Dao MC, Oppert JM, Bouillot JL et al. Nutritional and
548
Protein Deficiencies in the Short Term following Both Gastric Bypass and Gastric Banding. PLoS
549
One 2016;11:e0149588.
550
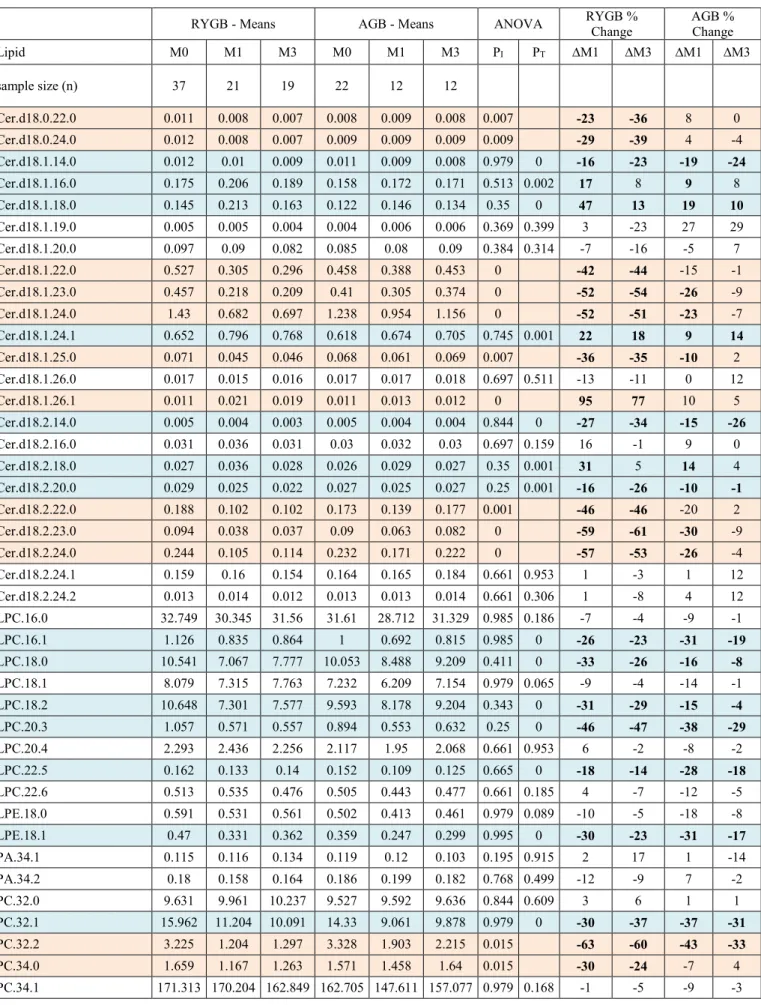
Table 1. Clinical parameters at baseline and during follow-up. ANOVA P are adjusted for the false
551
discovery rate. *P<0.05 compared to baseline, adjusted for the family-wise error rate. #Chi-squared test.
552
Values are mean (SE) for continuous variables and % prevalence for categorical. TC = Total cholesterol,
553
T2D = Type 2 Diabetes. P = Welch’s t-test for surgery differences at baseline, Padj = False discovery
554
rate adjustment of t-test. PI= Interaction (time x surgery), PS= Main-effect of surgery, PT= Main-effect of
555
time. McAuley index = exp[2.63 – 0.28ln(insulin) – 0.31ln(triglycerides)].
556
557
Figure 1. PCoA of baseline lipidomics with 95% confidence ellipses in A: AGB and RYGB, and B:
558
Untreated and statin-treated subjects. C: Correlation heatmap between baseline clinical parameters and
559
lipid classes, + is Padj<0.1. D: Summary of ANOVA results. E: Volcano plots of change in lipids without
560
an interaction averaged across the two surgeries at month 1 (left) and month 3 (right). F: Fold-change
561
from M0 to M3 for lipids without a significant interaction. Bold text and colored lines are lipids
562
significantly different from baseline (Padj<0.05).
563
564
Figure 2. A: Manhatten plot for the Time by Surgery interaction in the mixed effect ANOVA. Dotted line is
565
the 10% Benjamini-Hochberg false discovery rate. B: Change from baseline to M3 in AGB (dark) and
566
RYGB (light) for lipids with a significant interaction. * indicates Padj <0.05 after adjusting for weight loss.
567
568
Figure 3. A: Change in sphingolipids from baseline to M3 organized by fatty acid content for Cer and
569
presumed fatty acid content for SM (see Methods). B: Heatmap of correlations between deltas of lipids
570
and clinical parameters (M3-M0) that had a significant interaction in ANOVA, + indicates a Padj <0.1.
571
Lipids and clinical variables are clustered with average-linkage hierarchical clustering. C: Change in
572
saturated free fatty acids following surgery. Time points with different letters are statistically significantly
573
different (P<0.05) for both surgeries as there was no significant interaction. D: RYGB “signature” overlaid
574
on a simplified diagram of phospholipid and sphingolipid synthesis. Bold or colored names are analytes
575
measured in the current study. 1,2-DAG, 1-2-Diacylglycerol; CDP-DAG, Cytidine Diphosphate
576
Diacylglycerol; PA, Phosphatidic Acid; PI, Phosphatidylinositol; PG, Phosphatidylglycerol; PS,
577
Phosphatidylserine; PE, Phosphatidylethanolamine.
B MI B ody fat (%) A diponect in CRP G lucose HO MA 2-S Insulin McA uley A po-A 1 A po-B HDL-C LDL-C T riglycerides TC A LA T ASAT GGT PS PA LPC PI LPE PG PE CER SM PC + + + + + + + + + + + + + + + + -0.5 0 0.5 rho
A
B
C
Rho$ %0.5$ 0$ 0.5$ −5 0 5 −5 0 5Baseline PL/SL by surgery type
PCoA 1 (42.2%) PCoA 2 (10.6%) ● ● ● ● ● ● ● ● ● ● ● ● ● ● ● ● ● ● ● ● ● ● ● ● ● ● ● ● ● ● ● ● ● ● ● ● ● ● ● ● ● ● ● ● ● ● ● ● ● ● ● ● ● ● ● ● ● ● ● ● ● Band Bypass RYGB$ AGB$ Dimension$1$(42.2%)$ Dime nsion$2$(10.6%)$ −5 0 5 −5 0 5 Baseline PL/SL by statins PCoA 1 (42.2%) PCoA 2 (10.6%) ● ● ●● ● ● ● ● ● ● ● ● ● ● ● ● ● ● ● ● ● ● ● ● ● ● ● ● ● ● ● ● ● ● ● ● ● ● ● ● ● ● ● ● ● ● ● ● ● ● ● ● ● ● ● ● ● ● ● ● ● Untreated Statin Sta=n$ Untreated$ Dimension$1$(42.2%)$ Dime nsion$2$(10.6%)$
D
E
● ● ● ● ● ● ● ● ● ● ● ●●● ● ● ● ● ● ● ● ● ● ● ● ● ● ● ● ● ● ● ● ●● ● ● ● ● ● ● ● ● ● ● ● ● ● ● ● ● ● ● ● ● ● ● ● ● ● ● ● ● ● ● ● ● ● ● ● ● ● ● ● ● ● ● ● ● ● ● ● ● ● ● ● ● ● ● ● ● ● ● ● ● ● ● ● ● ● ● ● 0.25 0.50 0 2.0 4.0 0 5 10 15 −Log10(P) F old − change ● ● ● ● ● ● ● ● ● ● ● ●●● ● ● ● ● ● ● ● ● ● ● ● ● ● ● ●● ● ● ● ● ● ● ● ● ● ● ● ● ● ● ● ● ● ● ● ● ● ● ● ● ● ● ● ● ● ●● ● ● ● ● ● ● ● ● ● ● ● ● ● ● ● ● ● ● ● ● ● ● ● ● ● ● ● ● ● ● ● ● ● ● ● ● ● ● ● ● ● 0.25 0.50 0 2.0 0 5 10 15 −Log10(P) F old − change 1:10 1:10 ●LPC/LPE ●PA ●PC ●PE ●PG●PI ●PS ●SM●Cer Different by surgery RYGB = AGB Unchanged by surgery (64/131) (29/131) (38/131) M1$ M3$LPC(16:0) LPC(16:1) LPC(18:0) LPC(18:1) LPC(18:2) LPC(20:3) LPC(20:4) LPC(22:5) LPC(22:6) LPE(18:0) LPE(18:1) PA(34:1) PA(34:2) PC(32:0) PC(32:1) PC(34:1) PC(36:4) PC(36:5) PC(38:4) PC(38:5) PC(38:6) PC(40:3) PC(40:4) PC(40:5) PC(40:6) PC(40:7) PC(40:8) PE(32:1) PE(34:0) PE(34:1) PE(34:2) PE(34:3) PE(36:1) PE(36:2) PE(36:3)
PE(16:0/20:4) PE(18:2/18:2) PE(16:0/20:5) PE(18:2/18:3)
PE(36:6) PE(18:0/20:4) PE(38:5) PE(16:0/22:6) PE(40:4) PE(40:5) PE(18:0/22:6)
PE(40:7) PG(34:1) PG(34:2) PG(36:1) PG(36:2) PG(36:3) PG(38:4) PG(38:5) PI(32:0) PI(32:1) PI(34:0) PI(34:1) PI(34:2) PI(36:1) PI(36:2) PI(36:3) PI(36:4) PI(38:3) PI(38:4) PI(38:5) PI(38:6) PI(40:4) PI(40:5) PI(40:6) PS(36:1) PS(36:2) PS(38:3) PS(38:4) PS(40:4) PS(40:5) PS(40:6) SM(32:2) SM(34:0) SM(34:1) SM(34:2) SM(35:1) SM(36:1) SM(37:1) SM(38:2) SM(40:2) SM(41:2) SM(42:2) SM(43:2)
Cer(d18:1/14:0) Cer(d18:1/16:0) Cer(d18:1/18:0) Cer(d18:1/19:0) Cer(d18:1/20:0) Cer(d18:1/24:1) Cer(d18:1/26:0) Cer(d18:2/14:0) Cer(d18:2/16:0) Cer(d18:2/18:0) Cer(d18:2/20:0) Cer(d18:2/24:1) Cer(d18:2/24:2)
−2 −1 0 1 F old − change (M3 vs M0)
F
2$ 0$ 0.5$ 0.25$●● ● ● ●● ●●● ●● ● ●●● ●● ● ●● ● ● ● ●● ● ● ●● ● ●● ●● ● ● ● ●● ●●●● ●●●●● ● ●●● ●● ●●●●● ● ● ● ●●●●●●●●●● ● ●● ● ●● ● ●● ● ● ● ● ● ● ● ● ●●● ● ● ● ● ● ● ● ● ● ● ● ● ● ● ● ● ●● ● ●●●● ● ● ● ● ● ● ● ●● ●● ● ●● ●●
LPC(16:0) LPC(16:1) LPC(18:0) LPC(18:1) LPC(18:2) LPC(20:3) LPC(20:4) LPC(22:5) LPC(22:6) LPE(18:0) LPE(18:1) PA(34:1) PA(34:2) PC(32:0) PC(32:1)
PC(32:2) PC(34:0) PC(34:1) PC(34:2) PC(34:3) PC(36:1) PC(36:2) PC(36:3) PC(36:4) PC(36:5) PC(38:3)
PC(38:4) PC(38:5) PC(38:6) PC(40:3) PC(40:4) PC(40:5) PC(40:6) PC(40:7) PC(40:8) PE(32:1) PE(34:0) PE(34:1) PE(34:2) PE(34:3) PE(36:1) PE(36:2) PE(36:3) PE(16:0/20:4) PE(18:2/18:2) PE(16:0/20:5) PE(18:2/18:3) PE(36:6)
PE(38:3)
PE(18:0/20:4) PE(38:5) PE(16:0/22:6) PE(40:4) PE(40:5) PE(18:0/22:6) PE(40:7) PG(34:1) PG(34:2) PG(36:1) PG(36:2) PG(36:3) PG(38:4) PG(38:5) PI(32:0) PI(32:1) PI(34:0) PI(34:1) PI(34:2) PI(36:1) PI(36:2) PI(36:3) PI(36:4) PI(38:3) PI(38:4) PI(38:5) PI(38:6) PI(40:4) PI(40:5) PI(40:6) PS(36:1) PS(36:2) PS(38:3) PS(38:4) PS(40:4) PS(40:5) PS(40:6)
SM(32:1) SM(32:2) SM(34:0) SM(34:1) SM(34:2) SM(35:1) SM(36:1) SM(36:2) SM(37:1) SM(38:1) SM(38:2) SM(39:1) SM(40:1) SM(40:2) SM(41:1) SM(41:2) SM(42:1) SM(42:2) SM(42:3) SM(42:4) SM(43:1) SM(43:2) Cer(d18:0/22:0) Cer(d18:0/24:0)
Cer(d18:1/14:0) Cer(d18:1/16:0) Cer(d18:1/18:0) Cer(d18:1/19:0) Cer(d18:1/20:0)
Cer(d18:1/22:0) Cer(d18:1/23:0) Cer(d18:1/24:0) Cer(d18:1/24:1) Cer(d18:1/25:0) Cer(d18:1/26:0) Cer(d18:1/26:1)
Cer(d18:2/14:0) Cer(d18:2/16:0) Cer(d18:2/18:0) Cer(d18:2/20:0)
Cer(d18:2/22:0) Cer(d18:2/23:0) Cer(d18:2/24:0) Cer(d18:2/24:1) Cer(d18:2/24:2) 0 2 4 6 8 − log10(P − value)
A
B
PC(32:2) PC(34:0) PC(34:2) PC(34:3) PC(36:1) PC(36:2) PC(36:3) PC(38:3) PE(38:3) SM(32:1) SM(36:2) SM(38:1) SM(39:1) SM(40:1) SM(41:1) SM(42:1) SM(42:3) SM(42:4) SM(43:1)Cer(d18:0/22:0) Cer(d18:0/24:0) Cer(d18:1/22:0) Cer(d18:1/23:0) Cer(d18:1/24:0) Cer(d18:1/25:0) Cer(d18:1/26:1) Cer(d18:2/22:0) Cer(d18:2/23:0) Cer(d18:2/24:0)
0.5 0.7 0 1.4 F old − change (M3 − M0)