HAL Id: inserm-01935916
https://www.hal.inserm.fr/inserm-01935916
Submitted on 27 Nov 2018
HAL is a multi-disciplinary open access
archive for the deposit and dissemination of
sci-entific research documents, whether they are
pub-lished or not. The documents may come from
teaching and research institutions in France or
abroad, or from public or private research centers.
L’archive ouverte pluridisciplinaire HAL, est
destinée au dépôt et à la diffusion de documents
scientifiques de niveau recherche, publiés ou non,
émanant des établissements d’enseignement et de
recherche français ou étrangers, des laboratoires
publics ou privés.
The association of vision loss and dimensions of
depression over 12 years in older adults: Findings from
the Three City study
Suzanne Cosh, Isabelle Carriere, Virginie Nael, Christophe Tzourio, Cécile
Delcourt, Catherine Helmer
To cite this version:
Suzanne Cosh, Isabelle Carriere, Virginie Nael, Christophe Tzourio, Cécile Delcourt, et al.. The
association of vision loss and dimensions of depression over 12 years in older adults: Findings from the
Three City study: Vision loss and depression dimensions over 12 years. Journal of Affective Disorders,
Elsevier, 2019, 243, pp.477 - 484. �10.1016/j.jad.2018.09.071�. �inserm-01935916�
1
Running head: Vision loss and depression dimensions over 12 yearsThe association of vision loss and dimensions of depression over 12 years in older adults: findings from the Three City Study
Authors: Cosh S1,2*, Carriere I3, Nael V1,4,5, Tzourio C6, Delcourt C1, Helmer C1 and the Sense-Cog Consortium¥
1
Univ. Bordeaux, Inserm, Bordeaux Population Health Research Center, team LEHA, UMR 1219,
F-33000 Bordeaux, France
2
School of Behavioural, Cognitive and Social Sciences, University of New England, Armidale 2351 NSW, Australia
3
INSERM, Univ Montpellier, Neuropsychiatry: Epidemiological and Clinical Research, Montpellier, France
4
R&D Life and Vision Science, Essilor International, F-75012 Paris, France
5
Sorbonne University, UPMC University of Paris 06, INSERM, CNRS, Vision Institute, F-75012 Paris, France
6
Univ. Bordeaux, Inserm, Bordeaux Population Health Research Center, team HEALTHY, UMR 1219, CHU Bordeaux, F-33000 Bordeaux, France
*Corresponding author e-mail: scosh@une.edu.au
2
AbstractBackground: The established relationship between vision impairment and depression is limited
by the examination of depression only as a unidimensional construct. The present study explores the vision-depression relationship using a dimensional approach.
Methods: 9036 participants aged 65 years and above enrolled in the Three-City study were
included. Relationships between baseline near Vision Impairment (VI) or self-reported distance Visual Function (VF) loss with trajectory of four dimensions of depression – depressed affect, positive affect, somatic symptoms and interpersonal problems - over 12 years were examined using mixed-effects models. Depression dimensions were determined using the four-factor structure of the Centre for Epidemiology Studies-Depression Scale (CESD).
Results: In the fully adjustment models, mild near VI predicted poorer depressed affect (b=
0.04, p = .002) and positive affect (b = -0.06, p <.001) over time, with evidence of longer term adjustment. Distance VF loss was associated with poorer depressed affect (b = 0.27, p = <.001), positive affect (b = -0.15, p = .002), and somatic symptoms (b = 0.18, p = <.001) at baseline, although only the association with depressed affect was significant longitudinally (b = 0.01, p = .001). Neither near VI nor distance VF loss were associated with interpersonal problems.
Limitations: This paper uses a well-supported model of depression dimensions, however,
there remains no definite depression dimension model. Distance VF loss was self-reported, which can be influenced by depression symptoms.
Conclusions: Vision impairment in older adults is primarily associated with affective
dimensions of depression. A reduction in social connectedness and ability to engage in pleasurable activities may underlie the depression-vision relationship. Older adults with vision loss may benefit from targeted treatment of affective symptoms, and pleasant event scheduling.
Keywords: Vision impairment, visual loss, depression symptoms, ageing, mental wellbeing,
3
Vision impairment (VI) is common in older adults, with an estimated prevalence of 25% in those aged over 70 (Stevens et al., 2013); and VI substantially contributes to burden of disease in Europe (Mathers & Loncar, 2006). An association between VI and depression in the elderly population is well established (Carriere et al., 2013; Court, McLean, Guthrie, Mercer, & Smith, 2014; Hong et al., 2015), with prevalence of comorbid depression in older adults with VI estimated to be around 30% (Hayman et al., 2007; Hong et al., 2015). Comorbid depression leads to marked reductions in quality of life, increased disability, and increased mortality risk (Eisele et al., 2015; Hernandez Trillo & Dickinson, 2012; Zheng et al., 2012), underscoring the need to better understand the relationship between VI and depression and the long-term trajectory of depression symptoms in VI.
To date, when examining the association with VI, depression has been examined as a single disorder-based category; a methodology with substantial limitations. Major depressive disorder (MDD) is a polythetic disorder, characterized by a number of combinations of different symptoms (Vrieze et al., 2014). A unidimensional approach to depression fails to capture the substantial heterogeneity seen between individuals with depression (Basso, Combs, Purdie, Candilis, & Bornstein, 2013; Watson, 2009). Emerging evidence highlights the utility of a dimensional approach, which explores symptom dimensions rather than dichotomizing depression. Divergent prognoses, treatment needs, and quality of life outcomes have been reported for varying depression dimensions (Shafer, 2006; Soskin, Carl, Alpert, & Fava, 2012; Uher et al., 2012; Wardenaar, Monden, Conradi, & de Jonge, 2015). Moreover, different depression dimensions have been shown to differentially correlate with other mental and physical conditions (Watson, 2009) and may have different neurobiological substrates (Basso et al., 2013). Thus analyses using disorder-based categories may result in a substantial loss of valuable information (Brown & Barlow, 2009). By contrast, a dimensional approach is better suited to understanding the pathogenesis and course of psychiatric disorders and meeting the mental health needs of the elderly population (Bryant et al., 2013; Prisciandaro & Roberts, 2009).
Currently a dimensional approach to depression has not been applied in VI research, limiting understanding of the VI-depression association and the related needs of older adults with VI. This study therefore aims to examine the longitudinal relationship between near VI and distance Visual Function (VF) loss in older adults with depression dimension symptoms over 12 years.
4
MethodThis study forms part of the SENSE-Cog multi-phase research programme, funded by European Union Horizon 2020 programme. SENSE-Cog aims to promote mental well-being in older adults with sensory and cognitive impairments (www.sense-cog.eu/
)
. The first work package of thisproject aims to better understand the links between sensory, cognitive and mental ill-health in older Europeans.
Sample
Participants were recruited as part of the multi-centre Three-City (3C) study (The 3C Study Group, 2003), a prospective cohort study of community-dwelling French adults aged 65 years and over. A total of 9294 participants were recruited from electoral rolls in three cities (Bordeaux, Dijon and Montpellier) between 1999 and 2001. A standardized evaluation including a face-to-face interview and clinical examinations were undertaken at baseline. Participants were followed up at 2-3 year intervals for up to 12 years. The study protocol was approved by the Ethics Committees of the University– Hospitals and written informed consent was obtained from each participant.
Depression Measures
Depression symptoms were examined using the 20-item Centre for Epidemiology Studies-Depression scale (CESD) (Radloff, 1977). A four-factor structure proposed by Radloff is most commonly replicated (Radloff, 1977; Shafer, 2006). The four factors reflect different dimensions of depression symptoms: depressed affect (DA) assessed by 7 items (felt sad, crying spells, could not shake the blues, depressed, lonely, fearful, felt as though life is a failure); positive affect (PA) assessed by 4 items (hope about the future, enjoyed life, felt as good as others, felt happy); somatic symptoms (S) as represented by 7 items (poor appetite, restless sleep, could not get going,
5
that examine interpersonal problems (IP; people dislike me, people were unfriendly). The four dimensions are reported to be phenomenologically and psychometrically distinct (Devins, Orme, Costello, & Binik, 1988; Leventhal, Ramsey, Brown, LaChance, & Kahler, 2008; Shafer, 2006).The four-factor structure of the CESD has been validated across a number of populations (Shafer, 2006) including community dwelling older adults (Gellis, 2010) and has also been validated in the French version of the CESD in a population of community dwelling French adults (Morin et al., 2011). The scores for each item were summed for the different dimensions. For PA, items were not reverse scored as is required for calculating total CESD scores, thus lower scores indicate more severe depression. For the other dimensions, higher scores are indicative of more severe depression symptomatology.
Vision measures
Binocular near visual acuity was assessed using the Parinaud scale (a Jaeger-like reading test commonly used in France) at all time points. Assessment was undertaken using presenting vision with usual optical correction where applicable. Identical cards were used at each centre with a
standardised reading distance of 33 cm. Mild VI was classified as Parinaud 3 or 4 (Snellen equivalent 20/30-20/60) and moderate to severe VI as Parinaud > 4 (Snellen equivalent < 20/60). Distance visual function was assessed in the face-to-face interview. Distance VF loss was classified as self-reported inability or difficulty in recognising a familiar face at 4 metres.
Socio-demographic and health variables
Socio-demographic and health-related information was collected during the standardised interview at baseline. Known covariates of depression and/or vision were assessed, including variables such as education level (elementary schooling, secondary school, higher education), monthly income (low <€760, €760-2280, >€2280, withheld/missing), and marital status. Alcohol consumption (<10 grams, 10-40 grams, >40 grams per day), tobacco use (current-, past -, or non-smoker) and falls during the past 12 months were also assessed. A composite score representing activity limitations was calculated based on scores from the Rosow-Breslau scale, the Lawton-Brody
6
Instrumental Activities of Daily Living (IADL) scale and the Katz Index of Independence in Activities of Daily Living; activity limitations were (categorised as autonomous; dependent for mobility; mobility and IADL limitations; and dependent in 3 or more areas of functioning; Barberger-Gateau, Rainville, Letenneur, & Dartigues, 2000). During the detailed medical questionnaire history of myocardial infarction and use of psychotropic medication (ATC classification codes: N05A-C, N06A-B) in the past month was obtained. A medical examination assessed diabetes (fasting glycemia≥7mmol/L and/or anti-diabetic treatment), and blood pressure was measured using a digital electronic tensiometer OMRON M4. Hypertension was defined using the 140/90 mmHg threshold or treatment with blood-pressure lowering drugs. Cognitive functioning was also assessed using the Mini Mental State Examination (MMSE; <16, 16-23 or ≥24).
Statistical Analysis
The relationship between baseline near VI and distance VF loss at baseline with the trajectory of depression dimension symptoms over 12 years were assessed using multilevel growth models. Due to few participants reporting any IP symptomatology, the distribution of IP problems was not amenable to linear models, thus only S, DA and PA dimensions were examined using multilevel models (IP was examined using logistic mixed models). Due to non-normal distribution, dimension scores for PA, DA and S were transformed using the estimated link function (Proust-Lima, 2015). Scores were then converted to z-scores for subsequent analyses.
A series of exploratory models (Singer & Willett, 2003) were undertaken separately for each depression dimension (PA, DA, S) to assess the longitudinal effects of vision on depression symptoms over time; with all vision-related variables entered in a single model, thus models adjusted for the effect of VI on VF loss and VF loss on VI. In an initial step, an unconditional growth model adjusted only for time was undertaken to examine if depression dimension symptoms changed significantly over time. Secondly, time and its quadratic trend were entered to establish the trajectory of depression symptomatology. Exploratory analyses indicated that, for each dimension, depression trajectory was curvilinear and the model with a quadratic trend was the best fit of the data. These models then served as the basis for comparison for the subsequent models exploring the association between VI and VF loss with symptom dimensions. In a third step, baseline mild VI, moderate to severe VI, VF loss, and their interactions with time were entered concurrently into the model. A range of variables such as
7
functional ability, age, gender, education level, income and physical health have been identified as related to depression amongst older adults (see e.g. Blazer, 2003; Pennix, Leveille, Ferrucci, van Eijk, & Guralnik, 1999). Thus, in the final stage, three models were carried out for each dimension which adjusted for such known covariates that have been previously documented in the literature. The first adjusted for age, sex and study centre; the second model additionally adjusted for education level, income, marital status, and use of psychotropic medication; and the third model additionally adjusted for cognitive function (MMSE), activity limitations, falls in past 12 months, hypertension, diabetes, smoking status, alcohol consumption, and history of myocardial infarction, with covariates added as additional explanatory variables in the models.
The IP score was converted to a binary variable: presence of any IP symptomology and absence thereof. A logistic mixed model (Carriere & Bouyer, 2002) was used to explore if those with baseline VI or VF loss had differential odds of experiencing IP symptoms over the twelve years of follow-up.Logistic mixed models take into account within-subject correlation and model the individual time evolutionsof the outcome across the 12 years of follow-up; thus logistic mixed models also allow for the reversibility of symptoms. Three separate models were conducted for IP, adjusting for the same covariates as the multilevel models. Interactions between vision with sex, education and income were also systematically examined in all analyses. Analyses were conducted using SAS 9.4 (SAS Institute, Inc., Cary, NC).
Results
Of the 9294 participants recruited, 246 were missing baseline CESD or vision data and a further 12 had not completed the CESD due to impaired cognitive function as assessed by the trained interviewer. Thus a total of 9036 participants with complete depression and vision data at baseline were included in analyses. Participants had a mean age of 74.3 (SD=5.58) at baseline. The majority were female (60.7%, n = 5543). At baseline, prevalence of mild VI was 9.0% (n = 810), moderate to severe VI was 4.3% (n = 386) and distance VF loss was 5.4% (n = 491). Those with poor vision were older, less educated, less likely to be married, had greater functional impairment and were in poorer physical health on all assessed health outcomes than those without baseline impairment (Table 1).
8
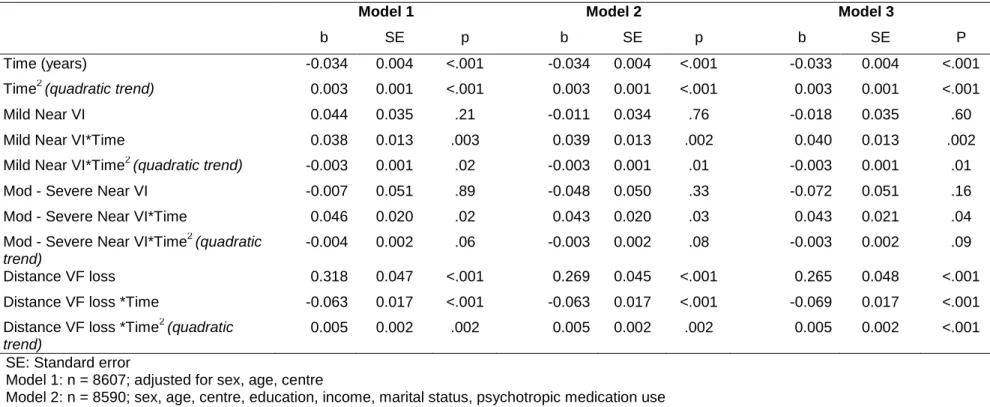
Depressed Affect
As shown in Table 2, in the fully adjusted model (model 3), mild VI was not associated with DA at baseline (b = -0.018, SE = 0.035, p = .60). However, mild VI was associated with an initial increase in DA symptomatology over time (b = 0.040 for linear interaction with time, SE = 0.013, p = .002), with symptoms then beginning to plateau (b = -0.003 for quadratic interaction with time, SE = 0.001, p = .01). Moderate to severe VI was also not related to DA at baseline. However, moderate to severe VI was associated with increasing DA symptoms over time (b = 0.043 linear interaction with time, SE = 0.021, p = .04). Distance VF loss was associated with increased DA symptoms at baseline (b = 0.265, SE = 0.048, p = <.001). In those with distance VF loss an initial small improvement in DA was seen before a longer term increase in DA symptoms (b = 0.005 for quadratic interaction with time, SE = 0.002, p = .001).
Positive Affect
Mild VI was associated with better PA at baseline (b = 0.107, SE = 0.04, p .003; Table 3). Mild VI was, however, associated with worsening PA symptoms over time (b = -0.060 for linear interaction with time, SE = 0.014, p <.001), before a tapering of symptoms over the longer term (b = 0.003 for quadratic interaction with time, SE = 0.001, p = .02). Moderate to severe VI was not associated with PA symptoms. Distance VF loss, on the other hand, was related to poorer PA at baseline (b = -0.147, SE = 0.047, p = .002), but had no longitudinal relationship with PA.
Somatic Symptoms
Neither mild nor moderate to severe VI were associated with somatic symptoms in the fully adjusted models, although a longitudinal relationship with moderate to severe VI was close to
significance (Table 4). Distance VF loss was associated with greater somatic symptoms at baseline (b = 0.175, SE = 0.046, p = <.001); however, this was not significant longitudinally (b = -0.007, SE = 0.020, p = .72).
9
Interpersonal Problems
Neither mild nor distance VF loss were associated with a greater likelihood of experiencing IP problems over 12 years in the fully adjusted models (OR = 0.84 95% CIs 0.64-1.11, p =.22, OR = 1.07 95% CIs 0.76-1.51, p =.69, respectively; Table 5). In the partially adjusted models, moderate to severe VI was associated with interpersonal problems, although this was just outside of significance in the fully adjusted model (OR = 1.42, 95% CIs 0.99-2.03, p =.06). In all models, none of the tested interactions were significant.
Discussion
This study adopted a novel dimensional approach to extend past research which has
previously established cross-sectional (Court et al., 2014; Garin et al., 2014; Hayman et al., 2007) and longitudinal (Carriere et al., 2013; Hong et al., 2015) relationships between VI and depression. Vision had differential relationships with different dimensions of depression. Affective dimensions, specifically depressed affect and positive affect, were more closely tied to VI and VF loss than somatic or
interpersonal symptoms. Thus the present findings provide a more comprehensive picture of
depression in vision and the dimensions that underlie the vision-depression relationship in the elderly population with VI.
Our findings demonstrated the varied relationships between different types of VI and
depression dimensions. Distance VF loss was associated cross-sectionally with DA, PA and somatic dimensions, whereas near VI did not have any cross-sectional associations with worse depressive symptomatology. This finding may indicate that distance VF loss is associated with greater initial distress that may remit over time, at least for PA and somatic dimensions. Alternatively, those who were more depressed at baseline may have been more likely to self-report vision problems. Notably in distance VF loss there was no evidence of adjustment to DA, suggesting that some dimensions may persist even in the absence of meeting a threshold for a single disorder-based assessment of depression. While the absence of cross-sectional associations between near VI and depression symptoms was perhaps unexpected, this finding might also reflect that depression likely increases with
10
worsening severity of the loss, and hence may be more strongly associated to depression symptoms over time.
The perhaps surprising finding that mild VI was associated with better PA at baseline might be explained through health behaviours. Previously higher PA has been associated with lack of
adherence to treatment, and inaccurate diagnosis and healthcare due to the underreporting of
symptoms (Pressman & Cohen, 2005). One possibility then is that those with higher PA might be more likely to use inappropriate optical correction thus resulting in higher rates of VI as assessed via
presenting correction. Correctible VI due to use of the wrong optical correction common in older adults (Taylor, Pezzullo, Nesbitt, & Keeffe, 2007). In the present study mild VI was, however, associated with a worsening of depression symptoms over time for both PA and DA. Yet for both dimensions there was a small longer term improvement in symptoms, indicative of adjustment, which is consistent with reports that older adults with VI exhibit depression symptoms at 5 but not 10 years post-onset (Hong et al., 2015). Our findings do suggest, however, that adjustment might be more complex than previously reported, with differential adjustment observed for different dimensions and types of VI. Although a range of factors that likely facilitate adjustment in VI have been reported (Senra et al., 2015), ongoing research is needed to better understand facilitators of adjustment for each dimension in order to help promote and improve quality of life (Wang & Chan, 2009).
Notably, within the present study, moderate to severe VI was only associated with DA over time, but was unrelated to the other depression dimensions. Due to a smaller sample meeting the moderate to severe threshold, the study may have been underpowered to detect such relationships. However, moderate to severe VI was associated with IP in the partially adjusted models, yet this was no longer significant after full adjustment for physical health covariates. Given that VI is associated with poorer physical health (Lam, Christ, Lee, Zheng, & Arheart, 2008) and greater functional
limitations (Bookwala & Lawson, 2011; Daien et al., 2011, 2014; Peres et al., 2017), it is possible that adjustment for these other factors might have attenuated the depression associations observed in the unadjusted models. Moreover, adjustment was noted in some dimensions in mild VI, thus those with moderate to severe VI might have already adjusted to their impairment. Relatedly, fear of total vision loss and future deterioration of vision are a central cause of distress in VI (Wang & Chan, 2009), yet may be less pertinent in those with already more severe VI.
11
The present results also shed further light on prior depression and vision research. Variations in the prevalence of comorbid depression in VI and eye diseases have been reported previously. Notably, one study using the Goldberg Depression Scale, which has a high proportion of items that assess somatic symptoms, reported relatively low rates of comorbid depression ranging from 4.3% in glaucoma to 10.5% in Age-related Macular Degeneration (AMD) (Eramudugolla, Wood, & Anstey, 2013). Other studies which have utilised the Hospital Anxiety and Depression Scale and Geriatric Depression Scale, both of which largely focus on affective symptoms of depression, have reported depression prevalence between 22-35% in VI and eye diseases (Hayman et al., 2007; Popescu et al., 2012; van der Aa, Comijs, Penninx, van Rens, & van Nispen, 2015; Yokoi et al., 2014). Thus the variation in prevalence rates may reflect the varied relationships between vision and depression dimensions. In addition, this study builds on previous depression dimension work that has shown prospective associations between affective depression dimensions with a number of physical health outcomes (Basso et al., 2013; Steptoe, Dockray, & Wardle, 2009). Our findings suggest that DA and PA are also related to aspects of vision and, moreover, that associations between affective
dimensions and health might be bidirectional, with our results indicating that poor vision predicted poorer DA and PA over time.
The results also shed further light on the range of possible mechanisms that might underlie the vision-depression association. Avoidance of social situations is observed in poor vision, leading to social isolation and reduced social support (Bookwala & Lawson, 2011; Hayman et al., 2007); both of which predict depression onset (Penninx, Leveille, Ferrucci, van Eijk, & Guralnik, 1999). Notably, positive affect is related to social connectedness and support (Brown & Barlow, 2009; Steptoe et al., 2009) and, concomitantly, those with depressed affect have fewer social connections (Steptoe et al., 2009) and report greater levels of loneliness (Wardenaar et al., 2015). Accordingly, the association between VI and affective symptoms suggests that social isolation and loss of social networks may be crucial factors underlying the association between VI and depression. Similarly, reduced functional independence observed in VI has been proposed as a mechanism (Carriere et al., 2013; Chou, 2008; Evans, Fletcher, & Wormald, 2007). Limited functional ability may also limit or restrict the ability to undertake pleasurable activities and events, resulting in reduced PA (Wahl, Heyl, & Schilling, 2012). Likewise reduced ability to engage in hobbies such as reading might further underlie the vision-depression association via reduced PA. Conversely, it has been argued that for those with increased
12
somatic symptoms of depression, common biological or ageing pathways likely underlie both the physical ill-health and depressive episode (Anderson, Berk, & Maes, 2014). The lack of associations between VI and somatic symptoms suggests that, at least in this sample, shared biological processes were less likely to be the mechanism underlying depression in VI.
Given that interventions targeted to specific dimensions can improve efficacy of depression treatment (Soskin et al., 2012), our findings indicate that a focus on treating affective symptoms is better suited to older adults with VI. This is particularly pertinent given that DA and symptoms of PA predict greater depression severity and poorer treatment response (Uher et al., 2012; Vrieze et al., 2014). Behavioural activation and pleasant event scheduling are beneficial therapeutic components for treating affective symptoms (Treadway & Zald, 2011) and behavioural activation is superior to
supportive therapy for preventing depression in AMD (Rovner et al., 2014). Given limitations in mobility and ability to engage in social outings and activities such as reading, a focus on generating and identifying alternate activities which generate PA may also be integral to improving wellbeing (Wahl et al., 2012). The results also highlighted some variation in treatment needs depending on type of VI. Mild VI was slower to remit, thus promoting adjustment may be of particular benefit in this population. Furthermore, DA did not remit in those with distance VF loss and given the bi-directional relationship between distance VF loss and depression (Carriere et al., 2013), treatment of DA symptoms may be of particular importance.
Strengths and Limitations
Study strengths include the large sample and length of follow up which allowed for the longer term trajectories of depression dimensions and adjustment to be explored, as well as the inclusion of measured binocular near visual acuity.However, this paper is presented with a number of limitations. Firstly distance VF loss was assessed by only 1 item and, being self-reported, may have been
influenced by existing depression symptoms. Moreover, although the model of depression dimensions utilized in this study has empirical support, debate remains over the best conceptualization of
depression dimensions and currently there is no conclusive model (van Loo, de Jonge, Romeijn, Kessler, & Schoevers, 2012). It is possible that alternate dimensional models or depression measures
13
would yield varied associations with vision. In addition, the CESD was originally designed as a general measure of depression rather than to assess specific subscales or factors (Shafer, 2006); ongoing research focused on assessment of depression dimensions in VI would be valuable. Relatedly, the interpersonal problems dimension was assessed by only two items and few participants endorsed any IP symptoms. Thus findings related to the IP dimension may not reflect the full range of interpersonal dysfunction in older adults with VI. Additionally, although Quality of Life (QoL) is related to depression and VI, no QoL data were available in this study, thus any possible confounds of QoL could not be ascertained. Future research might further consider the interplay of QoL in the relationship between specific depression dimensions and vision. A small proportion of participants had lower levels of cognitive function (as determined by the MMSE). Although these participants only completed self-report measures when deemed capable by the trained interviewer, the extent to which underlying cognitive fucntion might have impacted self-report cannot be fully ascertained. Furthermore, specific eye diseases or conditions underlying VI were not assessed. As a result, our findings do not account for possible reversibility of VI (e.g. due to cataract surgery).
Conclusions
The dimensional approach used here allows for increased understanding of the mental health needs of the elderly population with VI. Older adults with poor vision predominantly experienced a worsening of affective symptoms. Although longitudinal associations were observed with dimensions of depression, older adults with near VI showed some evidence of adjustment over time. Findings suggest that VI might be related to depression via a reduction in social connectedness and ability to engage in pleasurable activities. Older adults with VI may particularly benefit from targeted treatment of affective symptoms to enhance wellbeing.
14
Reference listAnderson, G., Berk, M., & Maes, M. (2014). Biological phenotypes underpin the
physio-somatic symptoms of somatization, depression, and chronic fatigue syndrome. Acta
Psychiatr Scand, 129(2), 83-97. doi:10.1111/acps.12182
Barberger-Gateau, P., Rainville, C., Letenneur, L., & Dartigues, J. F. (2000). A hierarchical
model of domains of disablement in the elderly: a longitudinal approach. Disabil
Rehabil, 22(7), 308-317.
Basso, M., Combs, D., Purdie, R., Candilis, P., & Bornstein, R. (2013). Neuropsychological
correlates of symptom dimensions in inpatients with major depressive disorder.
Psychiatry Res, 207(1-2), 61-67. doi:10.1016/j.psychres.2013.01.018
Blazer, D. G. (2003). Depression in Late Life: Review and Commentary. Journal of
Gerontology: Medical Sciences, 58A(3), 249-265.
Bookwala, J., & Lawson, B. (2011). Poor vision, functioning, and depressive symptoms: a
test of the activity restriction model. Gerontologist, 51(6), 798-808.
doi:10.1093/geront/gnr051
Brown, T. A., & Barlow, D. H. (2009). A proposal for a dimensional classification system
based on the shared features of the DSM-IV anxiety and mood disorders: implications
for assessment and treatment. Psychol Assess, 21(3), 256-271. doi:10.1037/a0016608
Bryant, C., Mohlman, J., Gum, A., Stanley, M., Beekman, A. T., Wetherell, J. L., . . . Lenze,
E. J. (2013). Anxiety disorders in older adults: looking to DSM5 and beyond. Am J
Geriatr Psychiatry, 21(9), 872-876. doi:10.1016/j.jagp.2013.01.011
Carriere, I., & Bouyer, J. (2002). Choosing marginal or random-effects models for
longitudinal binary responses: application to self-reported disability among older
persons. BMC Med Res Methodol, 2, 15.
Carriere, I., Delcourt, C., Daien, V., Peres, K., Feart, C., Berr, C., . . . Ritchie, K. (2013). A
prospective study of the bi-directional association between vision loss and depression
in the elderly. J Affect Disord, 151(1), 164-170. doi:10.1016/j.jad.2013.05.071
Chou, K. L. (2008). Combined effect of vision and hearing impairment on depression in older
adults: evidence from the English Longitudinal Study of Ageing. J Affect Disord,
106(1-2), 191-196. doi:10.1016/j.jad.2007.05.028
Court, H., McLean, G., Guthrie, B., Mercer, S. W., & Smith, D. J. (2014). Visual impairment
is associated with physical and mental comorbidities in older adults: a cross-sectional
study. BMC Medicine, 12(181). doi:10.1186/s12916-014-0181-7
Devins, G. M., Orme, C. M., Costello, C. G., & Binik, Y. M. (1988). Measuring depressive
symptoms in illness populations: Psychometric properties of the Center for
Epidemiologic Studies Depression (CES-D) scale. Psychology & Health, 2, 139–156.
Eisele, M., Kaduszkiewicz, H., Konig, H. H., Lange, C., Wiese, B., Prokein, J., . . . Hajek, A.
(2015). Determinants of health-related quality of life in older primary care patients:
results of the longitudinal observational AgeCoDe Study. Br J Gen Pract, 65(640),
e716-723. doi:10.3399/bjgp15X687337
Eramudugolla, R., Wood, J., & Anstey, K. J. (2013). Co-morbidity of depression and anxiety
in common age-related eye diseases: a population-based study of 662 adults. Front
Aging Neurosci, 5, 56. doi:10.3389/fnagi.2013.00056
Evans, J. R., Fletcher, A. E., & Wormald, R. P. (2007). Depression and anxiety in visually
impaired older people. Ophthalmology, 114(2), 283-288.
15
Garin, N., Olaya, B., Lara, E., Moneta, M. V., Miret, M., Ayuso-Mateos, J. L., & Haro, J. M.
(2014). Visual impairment and multimorbidity in a representative sample of the
Spanish population. BMC Public Health, 14(815). doi:10.1186/1471-2458-14-815
Gellis, Z. D. (2010). Assessment of a brief CES-D measure for depression in homebound
medically ill older adults. J Gerontol Soc Work, 53(4), 289-303.
doi:10.1080/01634371003741417
Hayman, K., Kerse, N. M., La Grow, S. J., Wouldes, T., Roberston, M. C., & Campbell, A. J.
(2007). Depression in Older People: Visual Impairment and Subjective Ratings of
Health. Optometry and Vision Science, 84(11), 1024-1030.
Hernandez Trillo, A., & Dickinson, C. M. (2012). The impact of visual and nonvisual factors
on quality of life and adaptation in adults with visual impairment. Invest Ophthalmol
Vis Sci, 53(7), 4234-4241. doi:10.1167/iovs.12-9580
Hong, T., Mitchell, P., Burlutsky, G., Gopinath, B., Liew, G., & Wang, J. J. (2015). Visual
impairment and depressive symptoms in an older Australian cohort: longitudinal
findings from the Blue Mountains Eye Study. Br J Ophthalmol, 99(8), 1017-1021.
doi:10.1136/bjophthalmol-2014-306308
Lam, B. L., Christ, S. L., Lee, D. J., Zheng, D. D., & Arheart, K. L. (2008). Reported visual
impairment and risk of suicide: the 1986-1996 national health interview surveys. Arch
Ophthalmol, 126(7), 975-980. doi:10.1001/archopht.126.7.975
Leventhal, A. M., Ramsey, S. E., Brown, R. A., LaChance, H. R., & Kahler, C. W. (2008).
Dimensions of depressive symptoms and smoking cessation. Nicotine Tob Res, 10(3),
507-517. doi:10.1080/14622200801901971
Mathers, C. D., & Loncar, D. (2006). Projections of global mortality and burden of disease
from 2002 to 2030. PLoS Med, 3(11), e442.
Morin, A. J., Moullec, G., Maiano, C., Layet, L., Just, J. L., & Ninot, G. (2011). Psychometric
properties of the Center for Epidemiologic Studies Depression Scale (CES-D) in
French clinical and nonclinical adults. Rev Epidemiol Sante Publique, 59(5), 327-340.
doi:10.1016/j.respe.2011.03.061
Penninx, B. W., Leveille, S., Ferrucci, L., van Eijk, J. T., & Guralnik, J. M. (1999). Exploring
the effect of depression on physical disability: longitudinal evidence from the
established populations for epidemiologic studies of the elderly. Am J Public Health,
89(9), 1346-1352.
Pennix, B. W. J. H., Leveille, S., Ferrucci, L., van Eijk, J. T., & Guralnik, J. M. (1999).
Exploring the effect of depression on physical disability: longitudinal evidence from
the established populations for epidemiologic studies of the elderly. American Journal
of Publlic Health, 89(9), 1346–1352.
Popescu, M. L., Boisjoly, H., Schmaltz, H., Kergoat, M. J., Rousseau, J., Moghadaszadeh, S.,
. . . Freeman, E. E. (2012). Explaining the relationship between three eye diseases and
depressive symptoms in older adults. Invest Ophthalmol Vis Sci, 53(4), 2308-2313.
doi:10.1167/iovs.11-9330
Pressman, S. D., & Cohen, S. (2005). Does positive affect influence health? . Psychological
Bulletin, 131, 925-971.
Prisciandaro, J. J., & Roberts, J. E. (2009). A comparison of the predictive abilities of
dimensional and categorical models of unipolar depression in the National
Comorbidity Survey. Psychol Med, 39(7), 1087-1096.
doi:10.1017/s0033291708004522
Proust-Lima, C. (2015). How to use LCMM package for normalizing psychometric tests.
Retrieved from France:
Radloff, L. S. (1977). The CESD Scale: A self-report depression scale for research in the
general population. Applied Psychological Measurement, 1, 385–401.
16
Rovner, B. W., Casten, R. J., Hegel, M. T., Massof, R. W., Leiby, B. E., Ho, A. C., &
Tasman, W. S. (2014). Low vision depression prevention trial in age-related macular
degeneration: a randomized clinical trial. Ophthalmology, 121(11), 2204-2211.
doi:10.1016/j.ophtha.2014.05.002
Senra, H., Barbosa, F., Ferreira, P., Vieira, C. R., Perrin, P. B., Rogers, H., . . . Leal, I. (2015).
Psychologic adjustment to irreversible vision loss in adults: a systematic review.
Ophthalmology, 122(4), 851-861. doi:10.1016/j.ophtha.2014.10.022
Shafer, A. B. (2006). Meta-analysis of the factor structures of four depression questionnaires:
Beck, CES-D, Hamilton, and Zung. J Clin Psychol, 62(1), 123-146.
doi:10.1002/jclp.20213
Singer, J. D., & Willett, J. B. (2003). Applied Longitudinal Data Analysis: Modeling Change
and Event Occurrence. New York, USA: Oxford University Press.
Soskin, D. P., Carl, J. R., Alpert, J., & Fava, M. (2012). Antidepressant effects on emotional
temperament: toward a biobehavioral research paradigm for major depressive
disorder. CNS Neurosci Ther, 18(6), 441-451. doi:10.1111/j.1755-5949.2012.00318.x
Steptoe, A., Dockray, S., & Wardle, J. (2009). Positive affect and psychobiological processes
relevant to health. J Pers, 77(6), 1747-1776. doi:10.1111/j.1467-6494.2009.00599.x
Stevens, G. A., White, R. A., Flaxman, S. R., Price, H., Jonas, J. B., Keeffe, J., . . . Bourne, R.
R. (2013). Global prevalence of vision impairment and blindness: magnitude and
temporal trends, 1990-2010. Ophthalmology, 120(12), 2377-2384.
doi:10.1016/j.ophtha.2013.05.025
Taylor, H. R., Pezzullo, M. L., Nesbitt, S. J., & Keeffe, J. E. (2007). Costs of Interventions for
Visual Impairment. American Journal of Ophthalmology, 143(4), 561-565.e561.
doi:
https://doi.org/10.1016/j.ajo.2006.10.055
The 3C Study Group. (2003). Vascular factors and risk of dementia: design of the Three-City
Study and baseline characteristics of the study population. Neuroepidemiology, 22(6),
316-325.
Treadway, M. T., & Zald, D. H. (2011). Reconsidering anhedonia in depression: lessons from
translational neuroscience. Neurosci Biobehav Rev, 35(3), 537-555.
doi:10.1016/j.neubiorev.2010.06.006
Uher, R., Perlis, R. H., Henigsberg, N., Zobel, A., Rietschel, M., Mors, O., . . . McGuffin, P.
(2012). Depression symptom dimensions as predictors of antidepressant treatment
outcome: replicable evidence for interest-activity symptoms. Psychol Med, 42(5),
967-980. doi:10.1017/s0033291711001905
van der Aa, H. P., Comijs, H. C., Penninx, B. W., van Rens, G. H., & van Nispen, R. M.
(2015). Major depressive and anxiety disorders in visually impaired older adults.
Invest Ophthalmol Vis Sci, 56(2), 849-854. doi:10.1167/iovs.14-15848
van Loo, H. M., de Jonge, P., Romeijn, J. W., Kessler, R. C., & Schoevers, R. A. (2012).
Data-driven subtypes of major depressive disorder: a systematic review. BMC Med,
10, 156. doi:10.1186/1741-7015-10-156
Vrieze, E., Demyttenaere, K., Bruffaerts, R., Hermans, D., Pizzagalli, D. A., Sienaert, P., . . .
Claes, S. (2014). Dimensions in major depressive disorder and their relevance for
treatment outcome. J Affect Disord, 155, 35-41. doi:10.1016/j.jad.2013.10.020
Wahl, H. W., Heyl, V., & Schilling, O. (2012). Robustness of personality and affect relations
under chronic conditions: the case of age-related vision and hearing impairment. J
Gerontol B Psychol Sci Soc Sci, 67(6), 687-696. doi:10.1093/geronb/gbs002
Wang, C. W., & Chan, C. L. (2009). Psychosocial adaptation status and health-related quality
of life among older Chinese adults with visual disorders. Qual Life Res, 18(7),
841-851. doi:10.1007/s11136-009-9505-z
17
Wardenaar, K. J., Monden, R., Conradi, H. J., & de Jonge, P. (2015). Symptom-specific
course trajectories and their determinants in primary care patients with Major
Depressive Disorder: Evidence for two etiologically distinct prototypes. J Affect
Disord, 179, 38-46. doi:10.1016/j.jad.2015.03.029
Watson, D. (2009). Differentiating the mood and anxiety disorders: a quadripartite model.
Annu Rev Clin Psychol, 5, 221-247. doi:10.1146/annurev.clinpsy.032408.153510
Yokoi, T., Moriyama, M., Hayashi, K., Shimada, N., Tomita, M., Yamamoto, N., . . .
Ohno-Matsui, K. (2014). Predictive factors for comorbid psychiatric disorders and their
impact on vision-related quality of life in patients with high myopia. Int Ophthalmol,
34(2), 171-183. doi:10.1007/s10792-013-9805-8
Zheng, D. D., Christ, S. L., Lam, B. L., Arheart, K. L., Galor, A., & Lee, D. J. (2012).
Increased mortality risk among the visually impaired: the roles of mental well-being
and preventive care practices. Invest Ophthalmol Vis Sci, 53(6), 2685-2692.
18
Table 1: Baseline characteristics of the study population by vision loss. Three-City (3C) Study 1999-2001, N=9036.No visual loss n= 7552 Mild VI only n= 726 Moderate to Severe VI only n= 267 VF loss only n= 288 VI and VF loss n= 203 p Age: mean (SD) 73.8 (5.3) 76.4 (5.9) 76.6 (5.8) 75.8 (6.2) 78.8 (6.3) <.001a Female 4475 (59.3) 488 (67.2) 163 (61.1) 213 (74.0) 153 (75.4) <.001 Education (reference category = high) <.001 Low 1794 (23.8) 299 (41.5) 110 (41.2) 72 (25.1) 67 (33.2) <.001 Mid 4277 (56.7) 331 (45.9) 122 (45.7) 173 (60.3) 105 (52.0) .001 Income (reference category = high) <.001
Low (< €760) 341 (4.8) 86 (12.9) 22 (9.7) 15 (5.5) 28 (15.6) <.001 Mid (€760-€2280) 4139 (58.2) 436 (65.4) 156 (68.4) 183 (67.5) 115 (63.9) .003 Withheld/missing 437 (5.8) 59 (8.1) 39 (14.6) 17 (5.9) 23 (11.3) <.001 Married 4667 (61.8) 347 (47.9) 140 (52.4) 145 (50.4) 77 (38.1) <.001 Smoking(reference category = non-smoker) <.001 Current smoker 421 (5.6) 49 (6.8) 12 (4.5) 16 (5.6) 10 (5.0) . 63 Past smoker 2561 (33.9) 206 (28.4) 90 (33.7) 71 24.7) 53 (26.2) <.001 Psychotropic medication use 2045 (27.1) 284 (39.1) 90 (33.7) 116 (40.3) 90 (44.3) <.001 Alcohol consumption (reference category = high) <.001 Low (>10 grams per day) 4281 (56.7) 476 (65.6) 173 (64.8) 187 (64.9) 145 (71.4) <.001 Moderate (10-40 per day) 2735 (36.2) 206 (28.4) 84 (31.5) 88 (30.6) 48 (23.7) <.001 Fall in past 12 months 1373 (18.2) 173 (23.9) 69 (26.0) 65 (22.6) 60 (29.7) <.001 Hypertension 5789 (76.7) 596 (82.1) 217 (81.6) 232 (80.6) 169 (83.3) <.001 Diabetes 583 (7.8) 68 (9.4) 34 (12.8) 26 (9.1) 22 (11.1) .01 Myocardial infarction 374 (5.0) 33 (4.6) 15 (5.6) 6 (2.1) 12 (5.9) <.001 MMSE (reference category ≥24) <.001 <16 44 (0.6) 5 (0.7) 4 (1.5) 3 (1.0) 4 (2.0) .05 16-23 422 (5.6) 77 (10.7) 31 (11.8) 33 (11.5) 26 (12.9) <.001 Activity Limitations (reference category = autonomous) <.001 Dependent for mobility 2721 (37.1) 330 (46.5) 120 (47.6) 104 (38.7) 75 (39.9) <.001 Mobility and IADL limitations 445 (6.1) 134 (18.9) 48 (19.1) 42 (15.6) 71 (37.8) <.001 Dependent in 3 or more areas 41 (0.6) 15 (2.1) 6 (2.4) 6 (2.2) 8 (4.3) <.001 Missing 223 (3.0) 17 (2.4) 15 (5.6) 19 (6.6) 15 (7.4) <.001 VI: Visual impairment; VF loss: Visual function loss; SD: Standard deviation, a = determined by one-way ANOVA, all other p values determine by Chi square tests
19
Table 2: Association between baseline Vision Loss and Depressed Affect (z-score). Three-City (3C) StudyModel 1 Model 2 Model 3
b SE p b SE p b SE P Time (years) -0.034 0.004 <.001 -0.034 0.004 <.001 -0.033 0.004 <.001 Time2 (quadratic trend) 0.003 0.001 <.001 0.003 0.001 <.001 0.003 0.001 <.001 Mild Near VI 0.044 0.035 .21 -0.011 0.034 .76 -0.018 0.035 .60 Mild Near VI*Time 0.038 0.013 .003 0.039 0.013 .002 0.040 0.013 .002 Mild Near VI*Time2 (quadratic trend) -0.003 0.001 .02 -0.003 0.001 .01 -0.003 0.001 .01 Mod - Severe Near VI -0.007 0.051 .89 -0.048 0.050 .33 -0.072 0.051 .16 Mod - Severe Near VI*Time 0.046 0.020 .02 0.043 0.020 .03 0.043 0.021 .04 Mod - Severe Near VI*Time2 (quadratic
trend)
-0.004 0.002 .06 -0.003 0.002 .08 -0.003 0.002 .09 Distance VF loss 0.318 0.047 <.001 0.269 0.045 <.001 0.265 0.048 <.001 Distance VF loss *Time -0.063 0.017 <.001 -0.063 0.017 <.001 -0.069 0.017 <.001 Distance VF loss *Time2 (quadratic
trend)
0.005 0.002 .002 0.005 0.002 .002 0.005 0.002 <.001 SE: Standard error
Model 1: n = 8607; adjusted for sex, age, centre
Model 2: n = 8590; sex, age, centre, education, income, marital status, psychotropic medication use
Model 3: n = 8209; sex, age, centre, education, income, marital status, psychotropic medication use, MMSE, functional ability, falls, hypertension, diabetes, smoking, alcohol consumption, and history of myocardial infarction
20
Table 3: Association between baseline Vision Loss and Positive Affect (z-score). Three-City (3C) Study
Model 1 Model 2 Model 3
b SE p b SE p b SE p Time (years) 0.035 0.004 <.001 0.034 0.004 <.001 0.031 0.004 <.001 Time2 (quadratic trend) -0.004 0.001 <.001 -0.004 0.001 <.001 -0.003 0.001 <.001 Mild Near VI 0.067 0.036 .06 0.098 0.037 .005 0.107 0.036 .003 Mild Near VI*Time -0.062 0.014 <.001 -0.062 0.015 <.001 -0.060 0.014 <.001 Mild Near VI*Time2 (quadratic trend) 0.003 0.001 .01 0.003 0.001 .01 0.003 0.001 .02 Mod - Severe Near VI -0.024 0.052 .65 -0.002 0.052 .98 0.037 0.053 .48 Mod - Severe Near VI*Time -0.014 0.022 .54 -0.011 0.022 .61 -0.017 0.023 .46 Mod - Severe Near VI*Time2 (quadratic
trend)
-0.001 0.002 .94 -0.001 0.001 .86 -0.001 0.002 .99 Distance VF loss -0.198 0.047 <.001 -0.161 0.047 <.001 -0.147 0.047 .002 Distance VF loss *Time 0.009 0.019 .63 0.008 0.020 .67 0.013 0.019 .50 Distance VF loss *Time2 (quadratic
trend)
-0.002 0.002 .30 -0.002 0.002 .31 -0.002 0.002 .20
Model 1: n= 8581; sex, age, centre
Model 2: n= 8564; sex, age, centre, education, income, marital status, psychotropic medication use
Model 3: n= 8183; sex, age, centre, education, income, marital status, psychotropic medication use, MMSE, functional ability, falls, hypertension, diabetes, smoking, alcohol consumption, and history myocardial infarction
21
Table 4: Association between baseline Vision Loss and Somatic Symptoms (z-score).Three-City (3C) Study
Model 1 Model 2 Model 3
b SE p b SE p b SE p Time (years) -0.027 0.004 <.001 -0.026 0.004 <.001 -0.025 0.004 <.001 Time2 (quadratic trend) 0.002 0.001 <.001 0.002 0.001 <.001 0.002 0.001 <.001 Mild Near VI 0.066 0.035 .06 0.033 0.035 .35 0.027 0.035 .44 Mild Near VI*Time 0.029 0.014 .03 0.030 0.014 .03 0.027 0.014 .06 Mild Near VI*Time2 (quadratic trend) -0.002 0.001 .19 -0.002 0.001 .19 -0.001 0.001 .26 Mod - Severe Near VI 0.044 0.051 .39 0.020 0.050 .68 0.006 0.051 .91 Mod - Severe Near VI*Time 0.032 0.021 .13 0.029 0.021 .17 0.021 0.022 .34 Mod - Severe Near VI*Time2 (quadratic
trend)
-0.001 0.002 .50 -0.001 0.002 .59 -0.001 0.002 .94 Distance VF loss 0.234 0.047 <.001 0.193 0.046 <.001 0.175 0.046 <.001 Distance VF loss *Time -0.002 0.018 .93 -0.002 0.018 .93 -0.007 0.019 .72 Distance VF loss *Time2 (quadratic
trend)
-0.001 0.002 .97 -0.001 0.002 .97 0.001 0.002 .87
Model 1: n= 8598; sex, age, centre
Model 2: n= 8582; sex, age, centre, education, income, marital status, psychotropic medication use
Model 3: n= 8199; sex, age, centre, education, income, marital status, psychotropic medication use, MMSE, functional ability, falls, hypertension, diabetes, smoking, alcohol consumption, and history of myocardial infarction
22
Table 5: Association between baseline Vision Loss and interpersonal problems. Three-City (3C) Study OR 95% CI p Mild near VI Model 1 0.93 0.71 1.22 .61 Model 2 0.84 0.64 1.11 .22 Model 3 0.84 0.64 1.11 .22Moderate to Severe near VI
Model 1 1.71 1.22 2.41 .002 Model 2 1.51 1.08 2.13 .02 Model 3 1.42 0.99 2.03 .06 Distance VF loss Model 1 1.09 0.78 1.53 .61 Model 2 1.07 0.76 1.49 .71 Model 3 1.07 0.76 1.51 .69
OR: odds ratio
CI: confidence interval
Model 1: n= 7445; sex, age, centre
Model 2: n= 7431; sex, age, centre, education, income, marital status, psychotropic medication use Model 3: n= 7103; sex, age, centre, education, income, marital status, psychotropic medication use, MMSE, functional ability, falls, hypertension, diabetes, smoking, alcohol consumption, and history of myocardial infarction