Publisher’s version / Version de l'éditeur:
Vous avez des questions? Nous pouvons vous aider. Pour communiquer directement avec un auteur, consultez la
première page de la revue dans laquelle son article a été publié afin de trouver ses coordonnées. Si vous n’arrivez pas à les repérer, communiquez avec nous à [email protected].
Questions? Contact the NRC Publications Archive team at
[email protected]. If you wish to email the authors directly, please see the first page of the publication for their contact information.
https://publications-cnrc.canada.ca/fra/droits
L’accès à ce site Web et l’utilisation de son contenu sont assujettis aux conditions présentées dans le site
LISEZ CES CONDITIONS ATTENTIVEMENT AVANT D’UTILISER CE SITE WEB.
Student Report; no. SR-2009-11, 2009-01-01
READ THESE TERMS AND CONDITIONS CAREFULLY BEFORE USING THIS WEBSITE. https://nrc-publications.canada.ca/eng/copyright
NRC Publications Archive Record / Notice des Archives des publications du CNRC :
https://nrc-publications.canada.ca/eng/view/object/?id=67420cff-03cf-4c0a-a7d5-019b160ce7a0 https://publications-cnrc.canada.ca/fra/voir/objet/?id=67420cff-03cf-4c0a-a7d5-019b160ce7a0
NRC Publications Archive
Archives des publications du CNRC
For the publisher’s version, please access the DOI link below./ Pour consulter la version de l’éditeur, utilisez le lien DOI ci-dessous.
https://doi.org/10.4224/18238669
Access and use of this website and the material on it are subject to the Terms and Conditions set forth at Offline Statics Tests Performed on On-Load Release Mechanisms of Davit Launched Lifeboats
National Research Council Canada Institute for Ocean Technology Conseil national de recherches Canada Institut des technologies oc ´eaniques
SR-2009-11
Student Report
Offline Statics Tests Performed on On-Load Release
Mechanisms of Davit Launched Lifeboats.
Mesh, J.
Mesh, J., 2009. Offline Statics Tests Performed on On-Load Release Mechanisms of Davit Launched Lifeboats. St. John's, NL : NRC Institute for Ocean Technology. Student Report, SR-2009-11.
DOCUMENTATION PAGE
REPORT NUMBER
SR-2009-11
NRC REPORT NUMBER DATE
April 2009
REPORT SECURITY CLASSIFICATION
Unclassified
DISTRIBUTION
Unlimited
TITLE
Offline Static Tests Performed on On-Load Release Mechanisms of Davit Launched Lifeboats
AUTHOR(S)
Jonathan Mesh
CORPORATE AUTHOR(S)/PERFORMING AGENCY(S)
National Research Council- Institute for Ocean Technology
PUBLICATION
SPONSORING AGENCY(S)
IOT PROJECT NUMBER
2188
NRC FILE NUMBER
KEY WORDS
Hooks, on-load release, twin fall davit, offline
PAGES 17 FIGS. 9 TABLES 10 SUMMARY
The capabilities of three on-load release mechanisms were investigated for normal and failure type release operations at the Institute for Ocean Technology.
Failures of release mechanisms during maintenance and exercise drills is a well documented
occurrence, however, until very recently the possible causes for the failures have only been postulated but never tested in a systematic way. The current study aims at better understanding the operational performance of lifeboat release mechanisms with respect to normal, extreme and failure operational situations.
Three twin fall davit on-load release mechanisms were tested in the experimental study. All the release mechanism design types are fully certified by the regulatory bodies. Of the three on-load release mechanisms, two were of older existing design types while the third was of a newer design. Two of the release mechanisms were new and never used outside of this study (one each of older and newer design) and had a loading capacity of 6 tonnes, while the third release mechanisms had been in operation and had a capacity of 3 tonnes.
• The experiments were conducted in the material testing facility of the Institute for Ocean Technology of the National Research Council of Canada and encompassed the following tests: • Inline/offline on-load tests
• Inline/offline static tests • Offline cyclic loading • Offline damage release cable
Results for the offline on-load tests as well as the offline damage release cable tests will be presented in this report.
Thus far all the results from in-line to offline, and from dynamic to static indicate that Hook C appears to have a higher degree of stability than the other two sample hooks.
ADDRESS National Research Council
Institute for Ocean Technology Arctic Avenue, P. O. Box 12093 St. John's, NL A1B 3T5
National Research Council Conseil national de recherches Canada Canada Institute for Ocean Institut des technologies
Technology océaniques
OFFLINE STATIC TESTS PERFORMED ON ON-LOAD RELEASE
MECHANISMS OF DAVIT LAUNCHED LIFEBOATS
SR-2009-11
Jonathan Mesh
SUMMARY
The capabilities of three on-load release mechanisms were investigated for normal and failure type release operations at the Institute for Ocean Technology. Failures of release mechanisms during maintenance and exercise drills is a well documented occurrence, however, until very recently the possible causes for the failures have only been postulated but never tested in a systematic way. The current study aims at better understanding the operational performance of lifeboat release mechanisms with respect to normal, extreme and failure operational situations.
Three twin fall davit on-load release mechanisms were tested in the experimental study. All the release mechanism design types are fully certified by the regulatory bodies. Of the three on-load release mechanisms, two were of older existing design types while the third was of a newer design. Two of the release mechanisms were new and never used outside of this study (one each of older and newer design) and had a loading capacity of 6 tonnes, while the third release mechanisms had been in operation and had a capacity of 3 tonnes.
The experiments were conducted in the material testing facility of the Institute for Ocean Technology of the National Research Council of Canada and encompassed the following tests:
Inline/offline on-load tests Inline/offline static tests Offline cyclic loading
Offline damage release cable
Results for the offline on-load tests as well as the offline damage release cable tests will be presented in this report.
Thus far all the results from in-line to offline, and from dynamic to static indicate that Hook C appears to have a higher degree of stability than the other two sample hooks.
TABLE OF CONTENTS Page 1. Introduction 1 1.1 Background Information 1 1.2 Testing 2 1.3 Definitions 2 2. Release system 3 3. Test Setup 3 4. Data Collection 5 5. Test Matrix 5
5.1 Offline Static Load Test Series 6
5.2 Cable Malfunction Test Series 7
6. Data Analysis 8 7. Results 9 7.1 Hook A Results 9 7.2 Hook B Results 11 7.3 Hook C Results 14 8. Conclusion 17
1
1. Introduction
1.1 Background Information
At present, the lifeboat release mechanism (hook) has been identified by marine accident boards and regulators as the “weakest link” in the evacuation system. Many fatalities have occurred as a result of design flaws and lack of functionality or understanding by crewmembers. According to a 2000 report from Oil
Companies International Marine Forum (OCIMF), INTERTANKO, and SIGTTO, there have been frequent incidents of pre-mature hook release, causing injuries and fatalities to passengers and crew. In another report by Marine Accident Investigation Branch (MAIB), in 2001, it was found that between the years of 1989 – 1999, eighty-seven (87) professional seafarers were injured and twelve lost their lives. The number of deaths accounted for 16% of the total lives lost on merchant vessels. All these accident occurred during testing and training and everyone involved were experienced and qualified seafarers. MAIB findings are supported by an investigation by the Australian Transport Safety Bureau (ATSB), which concluded, “The design of the on-load release system was flawed with respect to the hook locking mechanism”.
In 2006 Transport Canada, Petroleum Research Atlantic-Canada, Transportation Safety Board and the Institute for Ocean Technology (IOT) of the National
Research Council of Canada (NRC) entered into a collaborative agreement aiming at establishing the operational performance of lifeboat release mechanisms.
The project involved a systematic study of three on-load release mechanisms for normal release operations, static loading at various cam angles and abnormal operations (failures or extreme) such as malfunctioning release cables, or cyclic wave loading. The study also aimed at gaining a better understanding of the effects of offline loads versus online.
2
1.2 Testing
All testing and data analysis is completed for all of the release mechanisms, however this report will only cover information from the offline static loads that were applied to each release mechanism. There were 862 tests performed that evaluated the effect of off-axis loading combined with release cable failure and static loading at various cam angles.
The first hook that was tested (hook A) is a new design and was rated for 6 tonnes. The second hook tested (Hook B) was also rated for 6 tonnes. The third hook tested (Hook C) was rated for 3 tonnes.
1.3 Definitions
On-load Release This isn’t a normal operating procedure and occurs when the coxswain releases the lifeboat from the hooks while the lifeboat is still suspended above the water.
Pre-mature Release The release mechanism opens without a deliberate action from the coxswain to release the hook.
Static The load on the cam will be tested at various cam angles. The intension here is to investigate how an incorrectly reset affects the load of the whole release system.
Damaged Cable To simulate a damaged or broken release cable the hook will be loaded with the release cable detached from the cam.
Offline The load was applied to aft, forward and side sections of the hook at angles of 50, 50, and 20 degrees
3
2. Release system
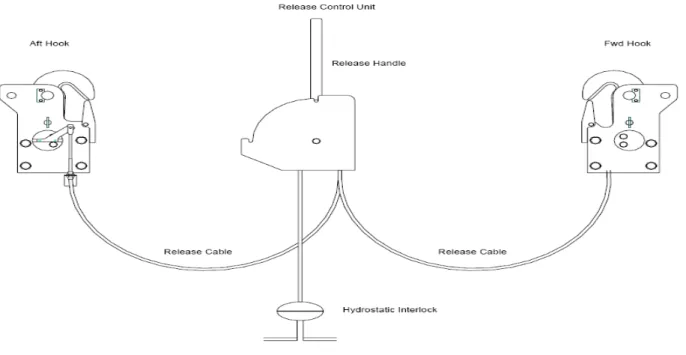
Almost all twin fall lifeboat release systems (Figure 1) consist of two hooks located forward and aft on the lifeboat with a release control unit position on the side of the steering console. The release control unit is fitted with a hydrostatic interlock and a release handle. The hydrostatic interlock prevents the lifeboat from releasing until it is waterborne, however the coxswain can manually override it if necessary. The release mechanism and the release control unit are connect by telescopic cables (release cables).
Figure 1 – Release System for Davit Launched Lifeboat
3. Test Setup
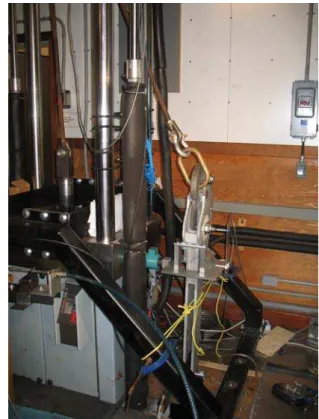
The Release Mechanisms were tested in the Material Testing Apparatus (MTA) at The Institute for Ocean Technology. The MTA is a standardized material testing machine that allows for uniaxial force to be applied to the release mechanisms. The MTA applies a load to the release mechanism in a controlled, repetitive and safe manner. Figures 2-4 illustrate the different release mechanisms setup in the MTA for the Offline Tests.
4
Figure 2 – Hook A Setup for Forward Pull Figure 3 – Hook B Setup for Side pull
5
In addition to the MTA other equipment was also used during the offline
experiments. This equipment includes a bullring and shackle, an electric actuator (open hook), three load cells (release cable, deck and pin loads), one linear displacement variable transducer (LVDT) and an angular displacement transducer (cam angle).
To apply a load to the release mechanism the bullring and shackle were
connected from the MTA to the hook. The electric actuator permitted the rotation of the cam in a controlled and repetitive manner. A load cell was connected between the actuator and the cam lever of the release mechanism. The angular displacement transducer was then used to record the cam angles. The remaining two load cells were used to measure the compressive load at the hook-canopy interface and at the hook-lifeboat attachment pin.
4. Data Collection
The three on-load release mechanisms were tested according to the following procedure:
• With no load connect the bullring to the release mechanism. • Rotate the cam to the specified angle with the electric actuator. • Start data acquisition.
• Let the system settle for 20-30 seconds and then apply the required load to the hook using the MTA.
• Slowly bring on the load and record loads, angles, etc. For 30 seconds. • Stop the data acquisition.
• Unload the applied load from the hook.
After each test the data was checked for integrity by plotting each individual channel time series and performing basic stats on the data.
5. Test Matrix
The test matrix was divided into two (2) categories: Offline Static Load at Various Cam Angles, and Extreme or Failure Operational conditions in which the release cable malfunctioned. The Offline static load tests were conducted to investigate the loading conditions on the cam and release cable when the cam is accidentally
6
re-set to various open angles. It would also investigate the affects of pulling from forward, aft and side sections of the hook. The Extreme or Failure Operational condition test series explored scenarios in which the release cable did not operate properly because it may have been broken or severed.
5.1 Offline Static Load Test Series
In the Offline static test series, separate tests were performed for each load condition at a pre-determined cam angle. The cam angles start at 0 degrees (fully closed position) and were increased by increments of 10 degrees to a maximum cam angle. However, for the 6,000 kg load condition for Hooks A and b, and the 3000 kg load condition for hook C, a series of additional tests were done at cam angles near the release point at increments of 1 degree until the hook released. This established the actual static release point for the hooks at its designed load. Each test was performed for at least 30 seconds. Tables 1-3 display the offline static test matrix employed for Hooks A, B and C. A similar test matrix was done for the aft and side section pulls.
Table 1 - Hook A Offline Static Tests in Forward Pulls
Applied Load (kg) Cam Angles (deg)
2000 0, 10, 20, 30, 40, 50, 60, 70, 71, 73, 75, 80
4000 0, 10, 20, 30, 40, 50, 60, 65, 68, 69, 70
6000 0, 10, 20, 30, 40, 50, 60, 65, 68, 69, 70, 71
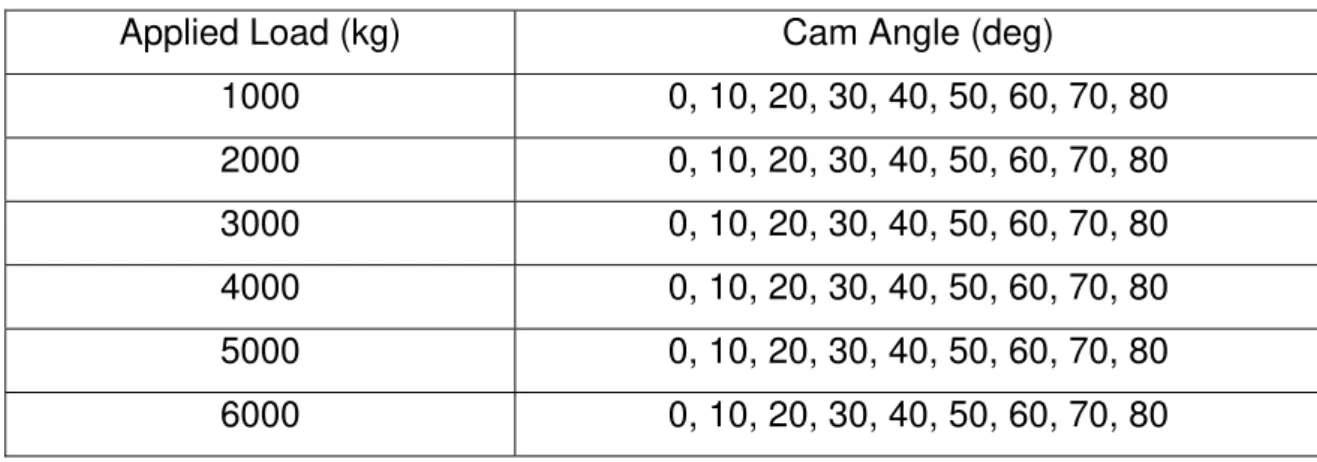
Table 2 - Hook B Offline Static Tests in Forward Pulls
Applied Load (kg) Cam Angle (deg)
1000 0, 10, 20, 30, 40, 50, 60, 70, 80 2000 0, 10, 20, 30, 40, 50, 60, 70, 80 3000 0, 10, 20, 30, 40, 50, 60, 70, 80 4000 0, 10, 20, 30, 40, 50, 60, 70, 80 5000 0, 10, 20, 30, 40, 50, 60, 70, 80 6000 0, 10, 20, 30, 40, 50, 60, 70, 80
7
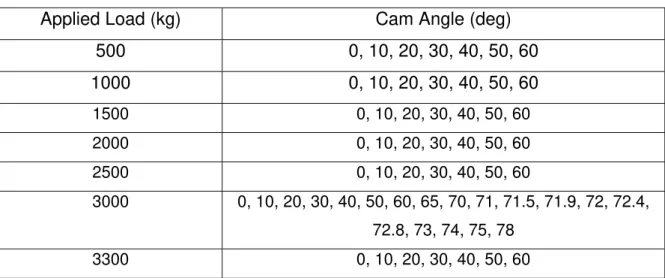
Table 3 - Hook C Offline Static Tests in Aft Pulls
Applied Load (kg) Cam Angle (deg)
500 0, 10, 20, 30, 40, 50, 60 1000 0, 10, 20, 30, 40, 50, 60 1500 0, 10, 20, 30, 40, 50, 60 2000 0, 10, 20, 30, 40, 50, 60 2500 0, 10, 20, 30, 40, 50, 60 3000 0, 10, 20, 30, 40, 50, 60, 65, 70, 71, 71.5, 71.9, 72, 72.4, 72.8, 73, 74, 75, 78 3300 0, 10, 20, 30, 40, 50, 60
5.2 Cable Malfunction Test Series
Damaged cables are often identified by service agents when doing inspections on lifeboats. For this reason, researchers thought it was important to test and determine what would happen if a cable was broken. The tests were conducted using the same methodology as the Offline static tests outlined in section 5.1, except the actuator was disconnected from the hook assembly. The removal of the actuator enables the cam to rotate if there is enough force acting on it. The purpose of these tests was to determine if the cam would rotate open due to the load applied to the hook. Tables 4-6 display the load conditions and their
associated cam angles for the damaged cable tests performed on Hooks A, B and C. Again, a similar text matrix was completed for the directional pulls not shown in the tables.
Table 4 - Hook A Offline static Damaged Cable Tests in Forward Pulls
Applied Load (kg) Cam Angle (deg)
2000 0, 10, 20, 30, 40, 50, 60, 70
8
Table 5 - Hook B Offline static Damaged Cable Tests for Aft Pulls
Applied Load (kg) Cam Angle (deg)
2000 0, 10, 20, 30, 40, 50, 60, 70, 70, 71, 72, 75, 80,
80
6000 0, 10, 20, 30, 40, 50, 60, 70, 72, 73, 75
Table 6 - Hook C Offline static Damaged Cable Tests for Forward Pulls
Applied Load (kg) Cam Angle (deg)
1000 0, 10, 20, 30, 40, 50, 60, 70, 71, 71, 72
3000 0, 10, 20, 30, 40, 50, 60, 70, 71, 71
6. Data Analysis
The data for the offline static tests for the release mechanisms was stored in the project drive as DAC Files. The DAC Files were then imported into Igor Pro 6.0 which is a software program used by IOT to analyze data. Once the DAC Files were imported into Igor the channels could be renamed and displayed. The channels that were displayed were hook tension, cam angle, release cable load, pin load, deck load and MTS LVDT. Using cursors, points were then taken from each displayed channel and the corresponding values were plotted in an excel file. These points were taken from along the transient and steady state areas of the loading process and included the initial value, no-load value (right before loading began) and final load value (after desired load is obtained). Also, any points of interest between these values such a sudden spikes, overshoots and cyclic loading processes that may have had any effect on the data were also taken. The release moment was then calculated in excel using the final release cable load multiplied by the cam arm length of the corresponding release mechanism.
Using Igor Pro 6.0, two channels were created in each load series, one for the release moment and the other for the cam angle. The values for the release moment were placed in the release moment table and the final cam angle values
9
were placed in the cam angle table. A release moment vs. cam angle graph was then created using these values. On the release moment vs. cam angle graph a positive moment is a closing moment and a negative moment is an opening moment. From the moment vs. cam angle graph it is easy to see when the hook was released and therefore gives a good indication as to which hook is the most stable up until its release point.
7. Results
7.1 Hook A Results
The Hook A Offline Static Load Tests were performed at various cam angles as described in section 3.1.1. Results from the offline static test series were obtained by analyzing the data from the six different channels described above in section 4.0. Once the data was plotted into an excel file it was easy to see at
approximately what cam angle the hook released at. Using the hook tension channel of the data and monitoring when to final loads had a sudden decrease showed when the hook had released. By looking at the release moment
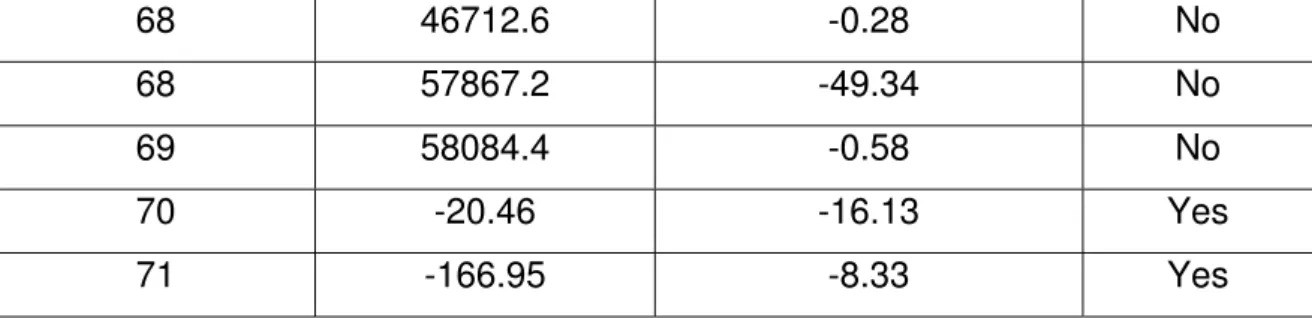
calculated and monitoring when the moment had a major decrease into the negative, meaning opening moment, also gave a good idea as to when the mechanism had released. Table 7 shows the change in release moment and hook tension during the 6 ton load tests in the forward direction.
Table 7 – Release Moment and Hook Tension of 6 Ton Load Tests in forward Direction for Hook A
Cam Angle (deg) Hook Tension (N) Release Moment (N*m) Release
0 57402.7 -10.42 No 20 57963.2 -3.21 No 30 57438.0 -4.00 No 40 57747.5 -4.46 No 50 57909.2 -3.05 No 60 58085.3 -10.30 No 65 57864.6 -7.94 No
10 68 46712.6 -0.28 No 68 57867.2 -49.34 No 69 58084.4 -0.58 No 70 -20.46 -16.13 Yes 71 -166.95 -8.33 Yes
Using the release moment values, which were calculated using the final release loads, as well as the final cam angle values for each load series a Release
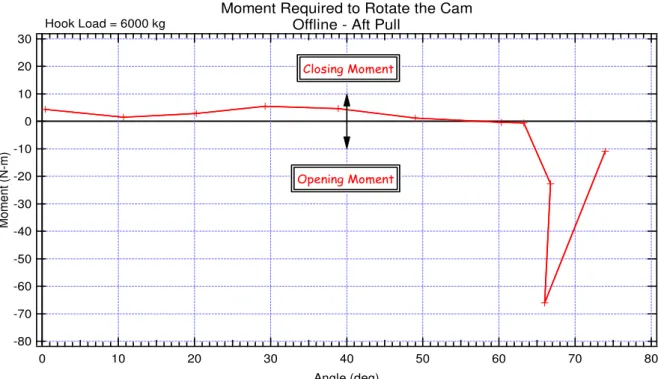
Moment vs. Cam Angle graph can be plotted. This graph can then be used to see exactly when the hook will release. Figure 5-6 show a Release Moment vs. Cam Angle graph for the 6 ton load series for Hook A in the forward and aft direction respectfully. -60 -50 -40 -30 -20 -10 0 10 20 Mo men t ( N -m ) 80 70 60 50 40 30 20 10 0 Angle (deg)
Moment Required to Rotate the Cam Offline - Fwd Pull
Hook Load = 6000 kg
Opening Moment Closing Moment
Figure 5 – Release Moment vs. Cam Angle Graph for Hook A 6 Ton Load Series in Forward Direction
11 -80 -70 -60 -50 -40 -30 -20 -10 0 10 20 30 M o m e n t (N-m ) 80 70 60 50 40 30 20 10 0 Angle (deg)
Moment Required to Rotate the Cam Offline - Aft Pull
Hook Load = 6000 kg
Opening Moment Closing Moment
Figure 6 - Release Moment vs. Cam Angle Graph for Hook A 6 Ton Load Series in Aft Direction
From the Release Moment vs. Cam Angle graph it is easy to tell when the hook has released by looking at the point at which it undergoes a large drop into the negative or opening moment area of the graph. When analyzing the data for the offline static tests of Hook A, the release point for this mechanism ranged from 65-75 degrees. Also, Hook A seems to maintain a positive or near zero moment up until its releasing point. This is important because it does not have significant opening moment acting on the cam which could potentially cause the hook to release prematurely. For this reason Hook A is stable until it reaches its release point in the vicinity of 65-75 degrees.
7.2 Hook B Results
The Hook B Offline Static Load Tests were performed at various cam angles as described in section 3.1.1. Results from the offline static test series were obtained by analyzing the data from the six different channels described above in section 4.0. Once the data was plotted into an excel file an approximate cam angle could be found for when the hook released. Using the hook tension channel of the data
12
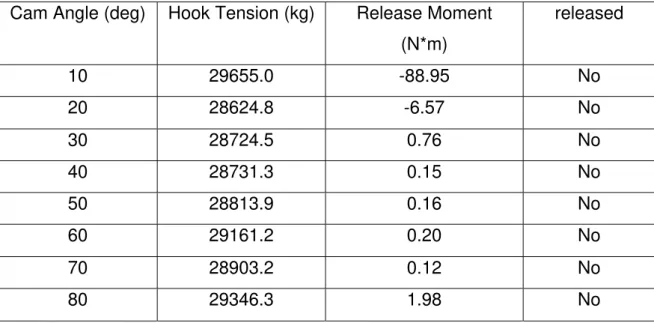
and monitoring when the final loads had a sudden decrease showed when the hook had released. By looking at the release moment calculated and monitoring when the moment had a major decrease into the negative, meaning an opening moment, also gave a good idea as to when the mechanism had released. Table 8 shows the change in release moment and hook tension during the 3 ton load tests in the Aft direction.
Table 8 – Release Moment and Hook Tension of 6 Ton Load Tests in Aft Direction for Hook B
Cam Angle (deg) Hook Tension (kg) Release Moment
(N*m) released 10 29655.0 -88.95 No 20 28624.8 -6.57 No 30 28724.5 0.76 No 40 28731.3 0.15 No 50 28813.9 0.16 No 60 29161.2 0.20 No 70 28903.2 0.12 No 80 29346.3 1.98 No
Using the release moment values, which were calculated using the final release loads, as well as the final cam angle values for each load series a Release
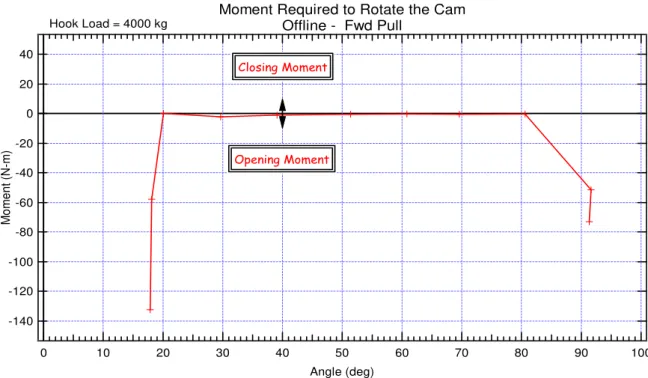
Moment vs. Cam Angle graph can be plotted. This graph can then be used to see exactly when the hook will release. Figure 7 shows a Release Moment vs. Cam Angle graph for the 6 ton load series for Hook B in the forward direction.
13 -140 -120 -100 -80 -60 -40 -20 0 20 40 Mo me n t ( N -m ) 100 90 80 70 60 50 40 30 20 10 0 Angle (deg)
Moment Required to Rotate the Cam Offline - Fwd Pull
Hook Load = 4000 kg
Opening Moment Closing Moment
Figure 7 - Release Moment vs. Cam Angle Graph for Hook A 4 Ton Load Series in Forward Direction
From the Release Moment vs. Cam Angle graph for Hook B it is easily seen when the hook begins to release at approximately 81 degrees and then final releases fully at approximately 91 degrees. However, when analyzing the offline static data for Hook B the release moment values were not all like this. Most of the load test series had very unstable release moment values that dropped into large negative, opening moment, values at earlier cam angles. This is significant because it shows that hook is very unstable at even lower cam angles and has a high tendency to release prematurely. An example of the fluctuating release moment values as the cam angle increases is shown in Table 9.
Table 9 – Fluctuating release Moments for Hook B on 5 ton Side Pulls
Cam Angle (deg) Release Moment (N*m)
10 -9.21 20 -14.47 30 -27.85 40 -23.06
14
50 -18.74 60 -7.49 70 -25.50
7.3 Hook C Results
The Hook C Offline Static Load Tests were performed at various cam angles as described in section 3.1.1. Results from the offline static test series were obtained by analyzing the data from the six different channels described above in section 4.0. Once the data was plotted into an excel file an approximate cam angle could be found for when the hook released. Using the hook tension channel of the data and monitoring when the final loads had a sudden decrease showed when the hook had released. By looking at the release moment calculated and monitoring when the moment had a major decrease into the negative, meaning an opening moment, also gave a good idea as to when the mechanism had released. The release points for Hook C are little higher however the Hook is rated at only half the load of Hooks A and C. Table 10 shows the change in release moment and hook tension during the 3 ton load tests in the Aft direction.
Table 10 - Release Moment and Hook Tension of 3 Ton Load Tests in Aft Direction for Hook C
Cam Angle (deg)
Hook Tension (N) Release Moment
(N*m) Released 0 29082.9 -0.15 No 10 29233.2 -0.03 No 20 29179.1 -0.77 No 30 29129.7 -1.05 No 40 28984.0 -0.04 No 50 29339.8 -0.73 No 60 29370.2 -0.10 No 65 29243.4 -0.06 No 70 29449.2 -0.04 No
15 71.5 29337.5 -0.24 No 71.9 29270.9 -16.70 No 72 28883.6 -3.10 No 72.4 29278.4 -4.79 No 72.8 29107.5 -26.78 No 73 29645.2 -13.87 No 74 -18.69 -28.80 Yes 75 -36.46 -32.15 Yes 78 -36.39 -16.59 Yes
Using the release moment values, which were calculated using the final release loads, as well as the final cam angle values for each load series a Release Moment vs. Cam Angle graph can be made. This graph can then be used to see exactly when the hook will release. Figure 8 - 9 show Release Moment vs. Cam Angle graphs for the 3 ton load series for Hook C in the aft and side direction respectfully. -20 -15 -10 -5 0 5 10 15 20 Mo men t ( N -m ) 80 70 60 50 40 30 20 10 0 Angle (deg)
Moment Required to Rotate the Cam Offline - Aft Pull
Hook Load = 3000 kg
Opening Moment Closing Moment
Figure 8 - Release Moment vs. Cam Angle Graph for Hook C 3 Ton Load Series in Aft Direction
16 -20 -18 -16 -14 -12 -10 -8 -6 -4 -2 0 2 4 6 8 10 Mo me n t ( N -m ) 90 80 70 60 50 40 30 20 10 0 Angle (deg)
Moment Required to Rotate the Cam Offline - Side Pull
Hook Load = 3000 kg
Opening Moment Closing Moment
Figure 9 - Release Moment vs. Cam Angle Graph for Hook C for 3 Ton Load Series in Side Direction
From the Release Moment vs. Cam Angle graph as well as all the other data that was analyzed for Hook C the release point is found to be within the range of 70 -85 degrees for the offline static tests. However, as stated earlier Hook C only has a load rating at 3 tonnes which is half of that of the other two release
mechanisms. More importantly the release moment prior to its reaching its release point is near zero or negative. During the side pull testing the release moment becomes very unstable meaning that hook will have a tendency to release prematurely at lower cam angles. Therefore Hook C has some stability but under certain conditions becomes extremely unstable with its release moment fluctuating into large negative values, which could cause serious problems.
17
8. Conclusion
As outlined in the introduction, the objectives of this study were to determine the forces that the release cables experience under various loading conditions and hook stability. The tests were performed on three different hook designs.
Hook A test results indicate that the release cable experience mostly tensile loading within the loading parameters of the cable. Hooks B and C however experienced either compressive or near zero moments. Therefore the release cables are a critical structural part of some hook systems. The telescopic cables are designed to move in two directions easily and provide flexibility to ensure the cables can be weaved through the lifeboat from the coxswain station to release the hook lever arm. The cables are also designed to take more tensile loading and less compressive loading. Loads larger than the maximum design loads can quite easily damage cables
It is apparent from the results that the loading of the release cable and the inherent stability of the hook are related. The test results for Hook A show that this release mechanism is very stable. If the cables become damaged or removed from the lever arm the hook will remain closed and will not have a tendency to release prematurely. However, Hook B, which is very unstable has no fault forgiveness. The release moment fluctuates from 0 to large opening moment, which is a major cause for a premature release. Hook C also displays similar attributes to Hook B. However, it is only load rated at half the value of both hooks A and C.
Data for the Wave loading conditions are still required to determine how each hook acts under extreme loading conditions. So far for the completed offline static tests Hook C seems to be the most stable and safest hook out of the three.