Automotive Component
Product Development Enhancement
Through Multi-Attribute System Design Optimization
In an Integrated Concurrent Engineering Framework
by,
Massimo Usan
M. S. Aeronautical Engineering (1992)
Polytechnic of Turin
Submitted to the System Design and Management Program in Partial Fulfillment of the Requirements for the Degree of
Master of Science in Engineering and Management
at the
Massachusetts Institute of Technology
February 2005
C 2005 Massachusetts Institute of Technology All rights reserved
J
Signature of Author
Massimo Usan System Design and Management Program February 2005 Certified by
Daniel Whitney Thesis Supervisor Center for Te logy, Policy & Development
Certified by
Olivier de Weck
Thesis Supervisor
MITL-ibries
Document Services Room 14-0551 77 Massachusetts Avenue Cambridge, MA 02139 Ph: 617.253.2800 Email: [email protected] http://libraries.mit.edu/docsDISCLAIMER OF QUALITY
Due to the condition of the original material, there are unavoidable
flaws in this reproduction. We have made every effort possible to provide you with the best copy available. If you are dissatisfied with this product and find it unusable, please contact Document Services as soon as possible.
Thank you.
The images contained in this document are of
the best quality available.
Automotive Component
Product Development Enhancement
Through Multi-Attribute System Design Optimization
In an Integrated Concurrent Engineering Framework
by
Massimo Usan
Submitted to the System Design and Management Program in Partial Fulfillment of the Requirements for the Degree of
Master of Science in Engineering and Management
February 2005
ABSTRACT
Automotive industry is facing a tough period. Production overcapacity and high fixed costs constrain companies' profits and challenge the very same existence of some corporations. Strangulated by the reduced cash availability and petrified by the organizational and products' complexity, companies find themselves more and more inadequate to stay in synch with the pace and the rate of change of consumers' and regulations' demands.
To boost profits, nearly everyone pursue cost cutting. However, aggressive cost cutting as the sole approach to fattening margins results invariably in a reduction of operational capabilities which is likely to result in a decline in sales volume that leads to further cost reductions in a continuous death spiral.
Long-term profitable growth requires, instead, a continuous flow of innovative products and processes. The focus should be, therefore, shifted from cost reduction to increased throughput. Automotive companies need to change their business model, morphing into new organizational entities based on systems thinking and change, which are agile and can swiftly adapt to the new business environment. The advancement of technology and the relentless increase in computing power will provide the necessary means for this radical transformation.
This transformation cannot happen if the Product Development Process (PDP) does not break the iron gate of cycle time-product cost-development expenses-reduced product performance that constrains it. A new approach to PD should be applied to the early phases, where the leverage is higher, and should be targeted to dramatic reduction of the time taken to perform design iterations, which, by taking 50-70% of the total development time, are a burden
of today's practice.
Multi-disciplinary Design Analysis and Optimization, enabled by an Integrated Concurrent Engineering virtual product development framework has the required characteristics and the potential to respond to today's and tomorrow's automotive challenges. In this new framework, the product or system is not defined by a rigid CAD model which is then manipulated by product team engineers, but by a parametric flexible architecture handled by optimization and analysis software, with limited user interaction. In this environment, design engineers govern computer programs, which automatically select appropriately combinations of geometry parameters and drive seamlessly the analyses software programs (structural, fluid dynamic, costing, etc) to compute the system's performance attributes. Optimization algorithms explore the design space, identifying the Pareto optimal set of designs that satisfy the multiple simultaneous objectives they are given and at the same time the problem's constraints.
Examples of application of the MDO approach to automotive systems are multiplying. However, the number of disciplines and engineering aspects considered is still limited to few (two or three) thus not exploiting the full potential the approach deriving from multi-di sciplinarity.
In the present work, a prototype of an Enhanced Development Framework has been set up for a particular automotive subsystem: a maniverter (a combination of exhaust manifold and catalytic converter) for internal combustion engines. The platform, adequately simplified to cope with the project constraints, features a bus architecture where the different analyses modules can be excluded and included with minor effort. Commercially available software is used, with some customization for the particular use. Particular emphasis is placed on the breadth of the engineering disciplines considered - which include fluid dynamics, pressure waves propagation, thermal management, vibrational behaviour and mass properties - and on the inclusion of business elements, in the form of a parametric cost model.
The development process executed in the new framework, benchmarked with current practice, resulted in a reduction of 75% in development time and cost and projections of 85% reduction are made for a full-functional tool running on adequate hardware. In addition, thanks to the possibility to evaluate many different maniverter configurations, an innovative design
solution with better performance and greatly lower cost was identified.
The efficient interface management coupled with the 24/7 working capability of computers let us think that the application of "Product Development Computerization" could reasonably lead to 50% reduction of the development cost and budget of many automotive systems, in
addition of delivering products with enhanced performances. Benefits are expected to be higher for complex systems where the diverse conflicting requirements narrow the trade space and for products that feature high levels of similarities from one application to another.
The deployment of such an environment improves the change management capability of a company, enabling new levels of business agility and triggering a virtuous spiral. Faster time to market, lower development costs and more cost efficient products can result in an increase of market share and profit margins. Engineering resources, released by the burden of
time-consuming modelling, routine CAE analyses and continuous rework in a schedule pressure environment, can focus on the delicate decision-making phase and more proficiently devote their time to research for next-generation products, to explore new business segments and to innovation. These projected efficiencies more than offset any cost for the development of the framework and any additional software or hardware that may be necessary.
Yet, its successful implementation requires winning some challenges. The most critical are::
1) overcoming the resistances of engineers that "like doing things by hand"; 2) creating in the
engineering community an open mindset that is ready to accept possible radically innovative solutions found by optimization algorithms scavenging traditionally unexplored areas of the design space; 3) breaking the traditional organizational divisions by functions to establish a network of knowledge management teams.
No global automotive company, especially Tier 1 suppliers, can afford to wait. In fact, as an organization approaches irrelevance, latitude for constructive action diminishes. Times call for immediate action: we need to invest in research and development so we can continue to prosper and grow. The winner will be the one who has a clear vision of the final agile state, starts earlier on the journey to achieve this vision, and implements it piece by piece.
ACKNOWLEDGEMENTS
In the beginning was the Vision. Then came the Goal and with it the challenge to achieve it. Achieving was then finding the best path to reach the goal: the higher the summit, the harder the climb. Descending from the goal, I have worked from whole to part, dividing the total scope of work into fragments and working on them one by one and in the end, bringing them all together.
At the beginning of the project, many warned me that the summit was way to high; some, illuminated by the experience and seniority, were even more explicit and said that achieving the goal was nearly impossible, given the working conditions. I want to thank them because they were right: my youth and my enthusiasm drove me into a rough ocean. After having succeeded and approaching a safe harbour, I can realize how challenging the task was. Only, the great teamwork and the combination of long-sighted minds and outstanding skills make possible to
reach this big result.
In addition to my wonderful Thesis Advisors, I would like to thank firstly my great Supervisors that have sponsored and supported me throughout the SDM effort up to the Thesis stretch: Silvio Angori, Jack Grace, Massimo Impavidi and Winfried Willeke.
In addition, my never-ending gratitude for their contribution and help goes to very many companies, universities and professionals that have worked together with me have to make the Vision come true:
* ArvinMeritor: Mohamud Aden Awed, Daniel Esteban, Valter Gorrea, Dorothee Hartmann, Juan Marcos, Youssef Mochkaai, Edgar Neuhaus, Martin Roll, Ian Rutherford, Jurgen Schaefer, Klaus Spindler
* Autostudi S.r.l: Carlo Angiono, Bruno Cuzzoni, Antonino di Franco, Piero Taruffi * AVL: Johann Krammer, Andreas Muenzer, Ivo Prah, Maik Suffa
" Centro Ricerche Fiat: Paolo Dondo, Luciano Pera, Cristina Randazzo, Maria Luisa
Sanseverino, Marco Zanzola
" Engineous Software Inc.: Jeff Bond, Mary Carr, Jack Cofer, Mike Sheh, Holger Wenzel " Fiat-GM Powertrain: Giovanni Basso, Luigi Pilo, Luigi Strazzullo
* Gamma Technologies: Marilyin DeVries, John Silvestri, Jinny Tremmel
* MSC.Software: Cinzia Chillemi, Luca Fattore, Valerio Giorgis, Mauro Parodi, Fabrizio Trentini, Ernesto Troncarelli
* Massachusetts Institute of Technology: Bill Foley, Pat Hale, Ted Hoppe, Denny Mahoney, Donna Rhodes, Thomas Roemer, David Wallace
* Pennsylvania State University: Timothy Simpson * Politecnico di Torino: Vilma Boaglio
* UGS PLM Solutions: Tavia Carson
" University of Strathclyde Business School: Valerie Belton
A big thanks goes also to all my friends that in many ways have accompanied me in this
long journey. They took out part of the pressure when it was too high for me to resist, and fed me with energy when I was short of it.
And, at last, I want to wholeheartedly thank my beloved parents who have helped me like no others in these two years of the System Design and Management Program and that have shared with me every single moment of this Thesis effort.
TABLE
OF
CONTENTSLIST OF FIGURES...11
LIST OF TABLES ... 16
LIST OF ACRONYMS...17
1. INTRODUCTION...19
1.1. MOTIVATION FOR THE WORK AND THESIS' VALUE PROPOSITION ... 19
1.1.1. Current Status ofAutomotive industry and Future Outlook... 19
1.1.2. Doing more with less: the risk of cost cutting... 22
1.1.3. Beyond cost cutting: new paradigms for product development... 24
1.1.4. The Enhanced Product Development Framework... 29
1 .2 . O B JE C T IV E S ... 3 0 1.3. OPERATIVE APPROACH ... 31 1.3.1. Introduction... 31 1.3.2. Methodology ... 33 1.3.3. Structure of Thesis ... 40 2. LITERATURE REVIEW ... 41 2 .1. IN TR O D U C TIO N ... 4 1 2.2. PD PROCESS IMPROVEMENT RESEARCH ... 41
2.2.1. Fraunhofer Institute Perspective ... 42
2.2.2. BMW Pilot Project... 43
2.2.3. F ord C 3P ... 44
2.3. MULTI-DISCIPLINARY DESIGN OPTIMZATION ... 45
2.3.1. Multidisciplinary Technology Overview ... 45
2.3.2. Available MDO software tools... 49
2.3.3. MDO as a tool to harness engineering complexity... 50
2.4. MDO ENABLERS: THE ICE PLATFORM IN A HPC ENVIRONMENT ... 52
2.4.1. ICE: the solution to software interoperability ... 53
2.4.2. High Performance Computing... 54
2.5. EXAMPLES OF APPLICATION OF MDO AS A DESIGN TOOL ... 59
2.5.1. Automotive Industry... 59
2.5.2. Exhaust System Related Applications ... 67
3. BUILDING THE ENHANCED DEVELOPMENT FRAMEWORK...75
3 .1.IN TR O D U C TIO N ... 75
3.2. APPLICATION: THE IC ENGINE EXHAUST SYSTEM MANIVERTER ... 75
3.2.1. Background... 75
3.2.2. Fiat Fire 1.4 16V engine... 79
3.3. HARDWARE / SOFTWARE PLATFORM FOR ICE ENVIRONMENT... 81
3.4. SCOPE D EFINITION ... 81
3.5. ARCHITECTURE D EFINITION... 83
3.6. THE GEOMETRY M ODULE ... 85
3.6.1. The Computer Aided D esign... 85
3.6.2. Essential CAD capabilities: parametric / associative modelling andAPI.... 87
3.6.3. A particular CAD tool: Unigraphics by UG PLM Solutions... 88
3.6.4. Product Conceptualization ... 89
3.6.5. Param etric M odel D etails... 92
3.6.6. M odeling O utcom e... 95
3.6.7. CAD Preparation for the Geom etry H andler ... 97
3.6.8. G eom etry H andler m odule... 98
3.7. STRUCTURAL ANALYSIS M ODULE ... 102
3.7.1. Introduction... 102
3.7.2. The Finite Element Method and Patran /Nastran... 102
3.7.3. Pre-processing: the FE m odel ... 104
3.7.4. Processing... 109
3.7.5. Post-processing: gathering the results ... 110
3.7.6. Running the Analysis in Batch ... 111
3.8. FLUID D YNAMICS M ODULE ... I11 3.8.1. Background... 112
3.8.2. The AVL BO OST Code... 113
3.8.3. The BO OST m odel ... 116
3.8.4. Perform ance A ttributes D efinition... 1 19 3.8.5. Autom ation of BO OST Calculations... 120
3.9. COST M ODULE... 122
3.9.1. Introduction... 122
3.9.2. M aniverter Cost Structure ... 124
3.10. THE ENHANCED D EVELOPMENT FRAMEW ORK... 127
3.10.1. The Optim izer... 127
3.10.2. Process Integration: putting the pieces together ... 129
3.10.3. Problem definition ... 134
3.10.4. Available D esign Strategies... 136
3.11. POST PROCESSING: VISUALIZING RESULTS DATA ... 137
3.11.2. iSIGHT Visualization tools: Engineering Data Mining and Scatter plots.. 139
3.11.3. An intuitive tools for engineers: the Rainbow Plot... 140
4. USING THE TOOL: DEVELOPING PRODUCTS EFFICIENTLY ... 142
4 .1. IN TR O D U C TIO N ... 142
4.2. THE TRAIN ER : A SIM PLE PIPE... 142
4.2.1. System 's D escrip tion... 143
4.2.2. R esu lts ... 144
4.3. PHASE I: TESTING THE EDF ON THE MANIVERTER ... 146
4.3.1. D esign Space Exploration... 146
4.3.2. Single Objective Optimizations... 149
4.3.3. Multi-Objective Analysis and Trade-space exploration ... 153
4.4. PHASE II: RUNNING THE EDF WITH FULL CAPABILITIES... 157
4.4.1. P rep aration R uns... 158
4.4.2. P areto Set Extraction... 159
4.4.3. The Engineering D ecision... 162
4.5. THE VALUE OF THE TOOL: SUMMARY OF INSIGHTS... 167
5. COST BENEFIT ANALYSIS AND IMPLEMENTATION...170
5 .1. IN TR O D U C TIO N ... 170
5.2. D EVELO PM EN T PLAN ... 171
5.3. H ARDW ARE R EQUIREM ENTS ... 175
5.4. THE ENVISIONED CHANGE IN THE PRODUCT DEVELOPMENT PROCESS... 177
5.5. C O ST B EN EFIT A N A LYSIS ... 181
5.6. BENEFITS AMPLIFY IN A VIRTOUS SPIRAL ... 186
5.7. IMPLEMENTATION AND ORGANIZATIONAL CHANGES ... 187
5.7.1. Reshaping the Organization ... 188
5.7.2. Be aware: it's going to get worse before getting better... 192
5.8. THE FOLLOWING GENERATION: MODELING UNCERTAINTY TO MANAGE RISK .... 193
6. CONCLUSIONS AND RECOMMENDATIONS...195
6.1. A VISION FOR THE 2 1sT CENTURY AUTOMOTIVE INDUSTRY: NETWORK OF ADAPTIVE, AGILE, LEAN, SELF-CONTROLLING ORGANIZATIONS ... 195
6.1.1. Change as a Mode of Operation... 196
6.1.2. Organizational Implications... 197
6.1.3. The R ole of Technology ... 198
6.2. MDO: A FUNDAMENTAL KNOWLEDGE MANAGEMENT TOOL FOR HIGH PERFORMANCE PRODUCT DEVELOPMENT PROCESS OF THE NEW AGILE ENTERPRISE ... 200
6.3. THE BIG RISK IS DELAYED ACTION: TAKE A BOLD-FACE DECISION... 201
7. APPENDIX...205
7.1. GEOMETRICAL MODEL INDIPENDENT PARAMETERS LIST ... 205
7 .2 . K E F A O PTIM IZER ... 207
7.2.1. Com m and syntax... 207
7.2.2. Operating System Requirements... 207
7.3. BOOST APPLICATION AUTOMATION INPUT FILE ... 207
7.4. RESOURCES FOR ADVANCES IN PRODUCT DEVELOPMENT ... 209
7.5. RESOURCES FOR MULTIDISCIPLINARY DESIGN OPTIMIZATION ... 210
7.6. RESOURCES FOR KNOWLEDGE MANAGEMENT:... 210
7.7. RESOURCES FOR COMPLEX SYSTEMS AND CHAOS THEORY:... 210
LIST OF FIGURES
Fig. 1: Global Yearly Light Vehicle Capacity and Demand... 19
Fig. 2: Continuous supplier consolidation ... 19
Fig. 3: Proliferation of models - heavy burden on development resouces...20
F ig. 4 : R & D budgets rem ain flat...20
Fig. 5: PD Lead time constantly decreases ... 21
F ig . 6 : S p eed to M ark et... 2 1 Fig. 7: Overload may destroy long term peformance ... 23
Fig. 8: the iron gate of Product Development... 25
Fig. 9: Lifecycle cost committed Vs. Project Phase ... 26
F ig . 10: T he cost of change... . 26
Fig. 11: Product Development Costs: dominated by rework... 27
Fig. 12: Iterations grows exponentially with product's and organizational complexity...27
Fig. 13: Computerized Engineering Vision ... 29
Fig. 14: example of a maniverter system... 31
Fig. 15: the Integrated Concurrent Engineering Architecture ... 34
Fig. 16: Hardware Architecture Options... 35
Fig. 17: ICE Platform Architecture and Team Members Coverage ... 37
F ig . 18 : T h e S im ple P ip e ... . 3 8 F ig . 19 : T he F ull M aniverter... . 38
Fig. 20: Rapid Product Development as new Approach... 41
Fig. 21: Evolutionary-Iterative Development... 42
Fig. 22: N ew F orm s O f C oordination ... 42
Fig. 23: The B M W D igital A uto Project ... 43
Fig. 24: The Ford C3P Framework ... 44
Fig. 25: General MDO Framework... 46
Fig. 26: D oE Techniques O verview ... 47
Fig. 27: O ptim ization A lgorithm s... 48
Fig. 28: Parallel, qualitative, and quantitative efforts in design ... 51
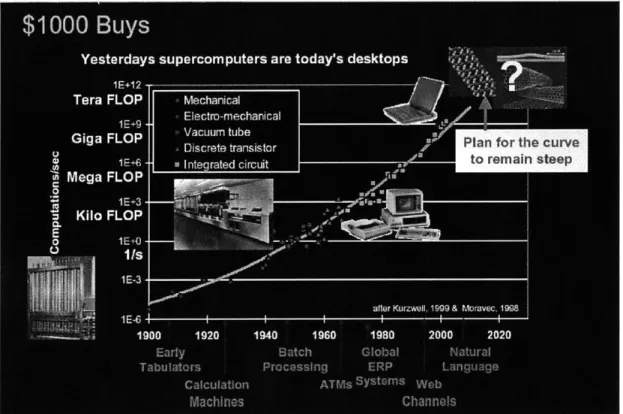
Fig. 29: Technology Progress Sigmoidal Staircase ... 52
Fig. 30: Moore's Law ... ... ... 55
Fig. 31: Top Computers Over Time for the Highly-Parallel Linpack Benchmark...56
F ig . 3 2 : B lu e G en e/L ... 56
Fig. 33: IB M Supercom puting R oadm ap... 57
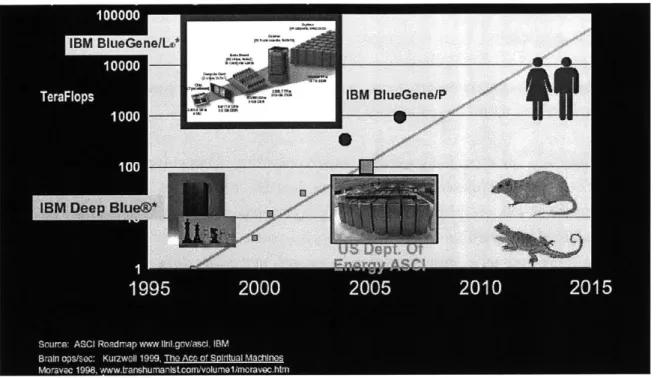
Fig. 34: E volution of FL O P s... 58
Fig. 35: CAE model for Frontal Crash... 59
Fig. 36: CAE M odel for 50% Offset Frontal Crash... 59
Fig. 37: CAE M odel for Roof Crash... 60
Fig. 38: CAE M odel for Side Impact... 60
Fig. 39: W eight Vs. Offest Intrusion ... 62
Fig. 40: Torsion Displacement Vs. Offset Crash Intrusion ... 63
Fig. 41: The Ferrari 360 M odena... 63
Fig. 42: Scheme of the aerodinamic optimization procedure ... 63
Fig. 43: AFM Evaluation Flowchart... 64
Fig. 44: Sketch of the Air Intake used for AFM Evaluation... 65
Fig. 45: AFM M DO Analysis Results ... 66
Fig. 46: The Exhaust System M odel... 67
Fig. 47: Acceleration Results at points 3 (above) and 4 (below)... 68
Fig. 48: Sketch of M uffler Internals ... 69
Fig. 49: Tailpipe Noise Results: baseline and optimized muffler... 70
Fig. 50: 2nd-3.5 Engine Order Sound Pressure Level difference: baseline and optimized m a n ifo ld ... 7 1 Fig. 51: Optimized M anifold Layout for Sporty Sound ... 72
Fig. 52: The initial manifold shape and design variables ... 72
Fig. 53: Solutions plotted in the objective function space; Case 1, merging points optimization ... 7 3 Fig. 54: Solutions plotted in the objective function space; Case 2, merging points and pipe rad iu s o p tim izatio n ... 7 3 Fig. 55: An Example of a Full Exhaust System ... 76
Fig. 56: An Example of a M aniverter ... 77
Fig. 57: The Fiat Fire 1.4 Engine... 80
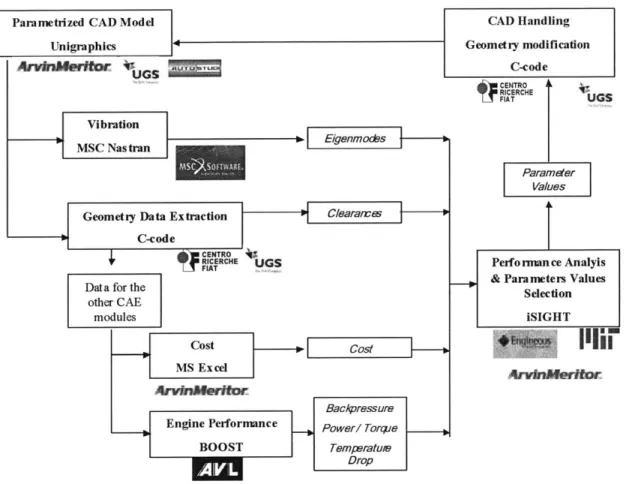
Fig. 58: Overview of the ICE platform Architecture:... 83
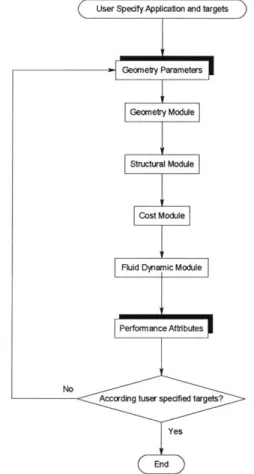
Fig. 59: Flowchart of the design loop execution... 84
Fig. 60: Dependency matrix of different ICE modules... 84
Fig. 61: CAD Functionalities... 86
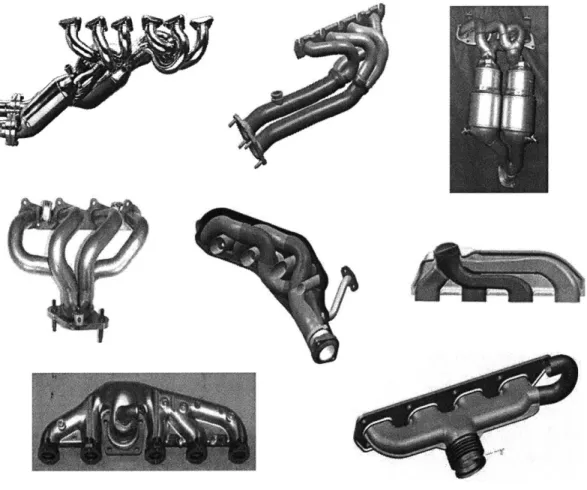
Fig. 62: A gallery of manifolds / maniverters designs...90
Fig. 63: Product Conceptualization Decision Tree... 91
Fig. 64: Simplified M aniverter Concept ... 91
Fig. 65: Inlet Flange, Pipework and Plenum conceptual model ... 92
Fig. 66: Catalytic Converter Body Conceptual M odel ... 93
Fig. 67: Catalytic Converter & Inlet / Outlet cones conceptual model...93
Fig. 68: Example of a Downpipe Bracket... 94
Fig. 70: Side and Front Views of a prototype actually developed for the Fiat Fire1.4 16V engine
(left) and the corresponding version obtained with the parametric maniverter (right)...97
Fig. 71: CAD Model is enriched by KF Objects ... 97
Fig. 72: KEFAOptimizer: Inputs and Outputs...98
Fig. 73: KEFAOptimizer Architecture and its Interaction with the CAD Model...99
F ig. 74 : F inite E lem ent T ypes... 102
Fig. 75: The Different Phases of a FEA... 104
Fig. 76: Parasolid Geometric Model imported in MSC.Patran... 105
Fig. 77: 4-node (left) and 10-node (right) Tetrahedra...106
Fig. 78: Benchmarking of Tet-4 Vs. Tet-10 elements and 4 mm Vs. 8 mm element dimension ... 1 0 7 Fig. 79: Solution time of problems with different mesh size and type of elements ... 107
Fig. 80: R esulting Finite Elem ent M esh ... 108
Fig. 81: Boundary Conditions applied to the Pipework... 108
Fig. 82: Boundary Conditions applied to the Bracket... 109
Fig. 83: Linear Elastic Isotropic Material Properties... 109
Fig. 84: Modal Shape Visualization (global lateral mode)... 110
F ig . 85: T he B O O ST M odel ... 116
Fig. 86: BOOST Model Parameters sample ... 117
Fig. 87: Torque, Power and Volumetric Efficiency Data. Blue line: current production system GT-Power results, Black Line: current production system, BOOST results, Red Line: B aseline m aniverter, B O O ST results... 118
Fig. 88: Performance Index and Average Catalyst Inlet Temperature ... 120
Fig. 89: Arcitecture of the BOOST Automation routine ... 121
Fig. 90: Different Costing Approaches for Different Project Phases ... 123
Fig. 9 1: M aniverter C ost Structure ... 124
Fig. 92: Pipe Price as function of Pipe Weight (AISI 304) ... 125
F ig. 93: C ost M odel O verview ... 127
F ig . 94 : iSIG H T A rchitecture ... 128
Fig. 95: T he iSIG H T F our Steps... 128
Fig. 96: The iSIGHT Implementation of the ICE Platform... 130
Fig. 97: ICE Platform Data Flow... 130
Fig. 98: The Input / Simulation Code / Output Module Structure... 132
Fig. 99: Input F ile P arsing Sam ple ... 133
Fig. 100: O utput F ile Parsing Sam ple... 133
Fig. 101: IC E Platform Param eters L ist... 134
Fig. 102 : E xam ple of G oals Setting ... 135
Fig. 103: Example of Parameters Upper / Lower Bounds setting ... 135
Fig. 104: Design Study Options available in iSIGHT ... 136
Fig. 105: Optimization Algorithms available in iSIGHT ... 137
F ig. 106: A n exam ple of G lyph ... 138
Fig. 107: The Scatter Plots Capability in iSIGH T ... 138
Fig. 108: The Engineering Data Mining Tool in iSIGHT ... 139
Fig. 109: Qualitative Rainbow Plot of Simple Pipe Pareto Designs... 140
Fig. 110 Quantitative Rainbow Plot of Simple Pipe Pareto Designs... 141
F ig. 111: The trainer: a Sim ple Pipe ... 143
Fig. 112: Monte Carlo Analysis setup: variables mean values and boundaries...144
Fig. 113: Monte Carlo analysis: Frequency-Mass Trade-Space ... 144
Fig. 114: Monte Carlo Analysis: Massflow-Outlet Temperature Trade-Space...145
Fig. 115: Pictorial representation of boundaries range for pipework control points ... 146
Fig. 116: an exam ple of unfeasible geom etry ... 147
F ig . 117 : F easibility C hannels ... 14 8 Fig. 118: Testing Phase -Maniverter Mass Minimization - Optimization History... 150
Fig. 119: Testing Phase -Maniverter Mass Minimization - Resulting Geometry ... 150
Fig. 120: Testing Phase -Performance Maximization - Optimization History ... 151
Fig. 121: Testing Phase - Performance Maximization - Resulting Geometry...152
Fig. 122: Testing Phase - Cost Minimization - Optimization History...152
Fig. 123: Testing Phase - Cost Minimization - Resulting Geometry ... 153
Fig. 124: Testing Phase - Frequency-Mass Trade-Space...155
Fig. 125: Testing Phase - Performance-Cost Trade-Space ... 156
Fig. 126: Final Run - Performance Maximization - Optimization History ... 157
Fig. 127: Final Run - Cost Minimization - Optimization History ... 157
Fig. 128: Final Run - Frequency Maximization - Optimization History...158
Fig. 129: Final Run - Catalyst Inlet Temperature Maximization - Optimization History ... 158
Fig. 130: Final Run - Mass Minimization - Optimization History...159
Fig. 131: Final Run - Performance Attributes Scatter Plots... 160
Fig. 132: Final Run - Performance Attributes Scatter Plots (cont'd)... 161
Fig. 133: Final Run - Pareto Data Qualitative Rainbow Plot... 162
Fig. 134: Final Run - Pareto Data Quantitative Rainbow Plot... 163
Fig. 135: Baseline (right) and Optimized (left) Maniverter Geometry... 165
Fig. 136: Timing Plan for the Maniverter EDF development... 174
Fig. 137: Projected C ost per TFL O P S ... 177
Fig. 138: Current Maniverter Development Process and the New EDF enabled ... 179
Fig. 139: M atrix O rganizational Structure... 188
Fig. 140: Re-allocation of resources freed-up by the use of the maniverter EDF ... 191
Fig. 142: The Reality of Change... 192
Fig. 143: Correlation of the number of changes to their impact... 196
Fig. 144: The EDF as a tool to achieve business agility ... 197
Fig. 145: Investments in Digital Simulation Technologies ... 198
Fig. 146: The Articulation of M DO... 202
LIST OF TABLES
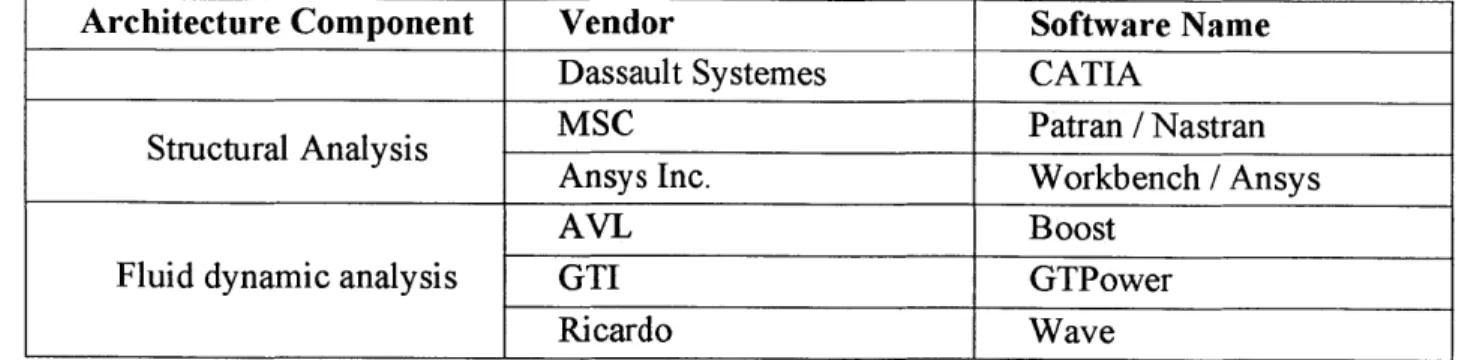
Tab. 1: Software Packages Options for the ICE platform Analyses Modules...36
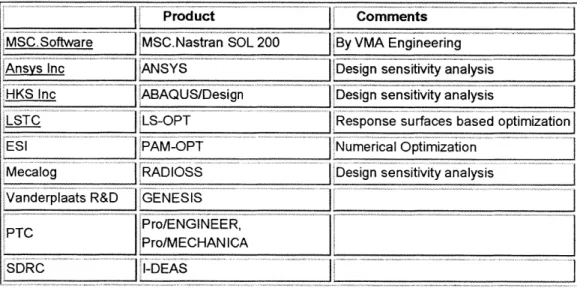
Tab. 2: ISVs Specializing in MDO and Process Integration Applications...50
Tab. 3: Traditional CAD and CAR ISVs with Design Optimization Functionality ... 50
Tab. 4: Safety & N V H M D O R esults ... 62
Tab. 5: Validation Results: Wind Tunnel Experimental Data... 64
Tab. 6: Effect of Surface Finish on Engine Performances... 65
Tab. 7: Maniverter Engineering Issues and related Disciplines ... 79
Tab. 8: Design Aspects Included and Excluded in the Prototype EDF ... 82
Tab. 9: Performance Attributes Comparison: Optimized vs. Baseline Solution ... 164
Tab. 10: Thickness of different maniverter components - Baseline vs. Optimized Solution .. 164
Tab. 11: Estimated FLOPs required by the current prototype and future EDF ... 176
Tab. 12: Development Project Costs (current and EDF enabled)... 180
T ab. 13: E D F D evelopm ent C osts ... 182
Tab. 14: Financial Benefits of the application of the EDF ... 184
Tab. 15: EDF D evelopm ent Project: NPV and DPP... 185
LIST OF ACRONYMS Page. 17/218 Acronym AFM ANSI BSFC CAD CAE CAS CAx CEO CFD COA COC CPU DI DoE ECU EDF FEA FEM FLOPS FM FTE FMVSS GA GUI HPC HW IC ICE IGES IPT IRR ISV KBD Meaning
Abrasive Fluid Machining
American Standard National Institute Brake Specific Fuel Consumption Computer Aided Design
Computer Aided Engineering Computer Aided Simulation Computer Aided x activity Chief Executive Officer
Computational Fluid Dynamics Center Of Application
Center Of Competence Central Processing Unit Direct Injection
Design of Experiment Engine Control Unit
Enhanced Development Framework Finite Element Analysis
Finite Element Method
FLoating point Operations per Second Functional Manager
Full Time Equivalent
Federal Motor Vehicle Safety Standards Genetic Algorithm
Graphical User Interface High Performance Computing Hardware
Internal Combustion
Integrated Concurrent Engineering Initial Graphics Exchange Specifications Integrated Product Team
Internal Rate of Return
Independent Software Vendor Knowledge-Based Design
Acronym Meaning
KBE Knowledge-Based Engineering
KF Knowledge Fusion
M&S Modeling & Simulation
MDA Multi-disciplinary Design Analysis MDO Multi-disciplinary Design Optimization
NPV Net Present Value
NVH Noise Vibration and Harshness OEM Original Equipment Manufacturer
PD Product Development
PDP Product Development Process
PLM Product Lifecycle Management
PM Program / Project / Product Manager
PMU Profit Margin Unit
QED Quick Exhaust Design
RFQ Request For Quotation
SI Spark Ignition
STEP STandard for Exchange of Product model data
SUV Sport Utility Vehicle
SW Software
THK Thickness
TQM Total Quality Management
TTM Time To Market
1. INTRODUCTION
1.1. Motivation for the Work and Thesis' Value Proposition
1.1.1. Current Status of Automotive industry and Future Outlook
"The industry's massive volatility represents the shudders of a dying business model that has created an era of high sales volume and negligible profits... Today we have high sales volume and low profitability. We have to change.
My view is the change is under way".
David Cole - President of the Center for Automotive Research (Automotive News, 01/15/2003 - for the full
presentation, see [1]).
As scaring perspective as it may appear, this is indeed the sharp depiction of the profitless prosperity that the automotive industry is facing these years, with stock valuations and cash available for re-investment that are at historic lows.
Industry analysts and observers (for some reviews see [2]
)
identify overcapacity (20-25%) and high fixed costs the main drivers of this downturn, Fig. 1[3] .Furthermore, within the next ten years, they predict consolidation to three or four global OEMs and a 25% consolidation of capacity and companies across the supply base. Accenture, for example, estimates that the number of Tier-One suppliers will decline to around 4,000 by 2010 [4] , Fig. 2.
Automotive companies are strained by multiple tensions. -a, 6 z 90 80 --- -- - - ---7 0 --- - ---60 --- - - - - ---50 - - ---- --- --- - ---40 0 D C (M)
Fig. 1: Global Yearly Light Vehicle Capacity and
10 00 6.000 5.000
Sij
-25%y 0 2002 2005Fig. 2: Continuous supplier consolidation
6.000
KIj
400-33%
M
2010
Data reveal that since the 1960's the number of basic vehicle segments has grown from 4 to more than
15. The industry's top five
manufacturers alone are expected to introduce nearly 160 new models and facelifts in the U.S market from 2003 through 2007 (Fig. 3 [5]).
The number and
complexity of new-model features also continues to climb. The electronics cost
Cumulative US Vehicle Launches by OEM 2002-2007
159 total vehicle launeM from 2003-07!
to0 60 so0 40-30, 2D 10, 01 (40 ... ... ... ... ... .... ... .... .. ..... ... .. .. ..... ... .. ... ... .. ... ..~ .. . ... ... ... ... ... m... .. .... ... .. . ... .. .. ... .I .... ... . .. .... ... .. .. .... ... -. M Ma zoo92 M90 zw9
1) ftn-W W3 9" t~w vomsaw; @MA C) oo**' V1207)0
Soto. ~aLew apt.- - -4 e MtlfZ140*4
Fig. 3: Proliferation of models - heavy burden on development resouces
content of an average car in the 1970's was less than 10 percent. It's expected to top 40 percent
by the year 2010. Additionally, regulatory requirements also have a major impact on product
development. Rising fuel economy, safety and environmental standards put additional pressure
on OEMs product
development.
While costs and
complexity have risen sharply in recent years, the price of an average vehicle has remained virtually unchanged since 1993. In parallel, since 1998, R & D budgets as a percent of sales at five of the industry's top
OEMs have remained
virtually unchanged at an average of 4% of sales, Fig. 4. R&D as a (1998-200 6- 5- 4- 3-% of Sales 3)1) a *0
U
998 1999 2000 2001 2002 2003 4 T ,Score: Comrpan Finegs ( WAn -po-s)
Fig. 4: R&D budgets remain flat
However, pressures to reduce costs and to increase systems' contents are not the only forces that shake automotive companies. Other forces are challenging the status quo and pushing for breakthroughs. The first is the reduction in the time to market (TTM).
Over time, the product development lead-time of car manufacturers has been constantly shrinking (Fig. 5), linked to shorter and shorter TTM. From the 60 months of about ten years ago, to the current range of 46-36 months, to the stretch target of 18 months touted in a recent announcement by GM [6] . Drawing a TTM data a 'speed to market curve', Fig. 6, a technology S-curve emerges that would indicate that, in the next ten years, the car industry will move at a much faster pace than today.
In addition to increasing operational margins, coping with systems of increasing complexity and reducing the development time, there is an increasing need for flexibility, the possibility to quickly change . from one design to the other 6W
IV with different performance 0
C
metrics to adapt to market or E company strategy changes.
O.
PD Lead times decreasing ... Development period after design freeze [months
40-, 30- 20- 10-0 5.3. 4.3 3.8 3.3 2.8 2.3 1.8 1.3 0.8 1985 *1 I I I I 1994 1996 1998 2000 2002 2004
Fig. 5: PD Lead time constantly decreases
1990 1995 2000 2005 2010 2015
Fig. 6: Speed to Market
1.1.2. Doing more with less: the risk of cost cutting
When a business's income and expenses are out of balance, it's a symptom. You can no more cure your business by cutting expenses than you can cure a fever by dropping the patient in an ice-water bath [7] .
Up to now, in order to sustain their business in this context of overcapacity, high fixed costs
and intense competition both OEMs and suppliers' have reacted (somewhat irrationally) asking their suppliers for immediate cost reductions.
Cost reduction, however, has several negative implications. First of all, it further squeezes companies' margins and increases the risk of supply. Secondly, as a report of AMR Research points out [8] , targeting cost to improve margins throws manufacturers into what General Electric's Jeff Immelt calls "commodity hell"- where companies find themselves competing on price alone. But, what's worse, it might put the company in a state of permanent emergency with quality reduction and long development leadtime at no actual appreciable reduction in product development costs. This is due to the occurrence and to the subsequent spreading of a pathological organizational dynamic phenomenon called fire fighting [9] [10] , which is defined as the unplanned allocation of resources to fix problems discovered late in a product's development cycle.
The understanding of fire fighting is intimately linked to the understanding of project dynamics.
Cooper et al. [11] pinpoint three interrelated factors related to the dynamics of a single project: the rework cycle, feedback effects on productivity and quality impacts, and knock-on effects from upstream phases to downstream phases. Customarily, conventional project management neglects rework. In reality, more or less rework emerges in any project. At least part of rework lies undiscovered for a considerable time, and after its discovery, it is rushed to completion, competing with other work assigned to the specialists in question. Feedback effects on productivity and quality refer especially to the situation where there is managerial corrective action after deviation from the plan. Bringing more resources, using overtime or exerting schedule pressure will usually reduce productivity and quality. Reduced quality will, in turn, lead to more rework. When a project consists of several phases, the availability and quality of upstream work can impact the productivity and quality of downstream work. Thus, the rework cycles and feedback effects in one phase extend their influence to the next phases. When multiple projects are running, as in a normal company, the problems on one project knock then onto the following project in a never-ending spiral.
Repenning et al. [10] demonstrate the existence of a tipping point above which the negative effects of rework, productivity and quality loss and knock-on dynamics amplify and spread
whereas they die out below this point. In analogy with models of infectious diseases where the tipping point represents the threshold of infectivity and susceptibility beyond which a disease becomes epidemic, in product development systems there exists a threshold for problem-solving activity. When crossed, fire fighting will emerge, grow and spread rapidly from a few isolated areas to the entire development system, due to a sort of domino effect from one project to the other.
Fire fighting is a self-reinforcing phenomenon: once the system has entered the fire-fighting zone, escape is difficult. As illustrated by Brooks' Law (1995) about the Mythical Man-month [11] , in fire-fighting situation the progress is not proportional with the effort. This is because resource utilization efficiency drops. As a result development cost rise and leadtime lengthen, which induce management to further attempt to increase the pressure. The fire-fighting syndrome persists because few actions can push the product development system back over the tipping point into a virtuous cycle of improved process execution [10] .
Moreover, as Repenning and Henderson point out, when the company is in a fire-fighting mode, all the resources are utilized to fix problems and to manage the growing rework, which,
being immediate needs, are perceived as Nolor
more urgent and compelling. Resources spent in fire-fighting are drained from
Pressure to
medium-long term innovation and -Fix short term .ent -%j
problems 1ghting
research, with the result of emptying the
product pipeline (Fig. 7, [13] ) and %*
undermining effective management of the P.x -.10 development system [14] . Extreme time ipportun es
pressure not only stops medium and long- Grovit projects
term research but kill also vital incremental innovation. The need to freeze
the design avoiding high rewards / high- Fig. 7: Overload may destroy long term peformance risk paths pushes developers to follow
known development routes and ending in products of standard performances
Why fire-fighting occurs? And why, resources have such an important role? One
contributory cause for this situation, discussed by Dorner [15] , is the cognitive limitation of humans as decision-makers and their inability to cope with complex and dynamic situations. Dorner isolates four factors. First, the question is about complexity, the existence of many interrelated variables. Second, we have to deal with dynamic systems. It is not enough to manage the system a single moment, but over time. Third, the system is to some extent intransparent; we cannot see all we want to see. Fourth, ignorance and mistaken hypotheses
prevail. We usually do not know all relationships between the variables. D6rner goes on to explain the generic causes of mistakes people make when dealing with complex systems:
" Slowness of thinking
* Small amount of information that can be processed at any one time * Limited inflow capacity of the memory
* Tendency to protect the sense of competence
* Tendency to focus on the immediately pressing problems.
Resources limitation created by cost cutting, if not adequately compensated by more powerful tools that allow the correct management of the dynamic complexity, exalts the negative modes of project dynamics and lowers the tipping point, thus making easier for fire fighting to burst.
In addition, the "better-before-worse" behavior created by fire fighting coupled with basic human tendencies for immediate rewards and intuitions further leads decision makers down the wrong path.
1.1.3. Beyond cost cutting: new paradigms for product development
"When you are face to face with a difficulty, you are up against a discovery."
- Lord Kelvin To stay competitive in a changing market, automotive companies need to continuously increase their operational efficiency. This means increasing the added value of resource utilization in engineering, manufacturing, and distribution processes - both internally and along the supply chain.
A major leverage factor, as Liz Lempres, director in McKinsey's Boston office, notes [16] ,
is the process, which in most companies has become an inflexible sequence of activities, like a production line. Because it is inflexible, it is disconnected from marketplace changes that may determine the fate of new products. The solution is to inject more customer-related information into the process and to make it flow better. By transforming a rigid process into a more dynamic and information-based one, companies can quicken the pace of development and improve a product's odds of success.
However, to do so, they will have to implement basic changes in the way they make and time product-development decisions. By improving the quality, timing, and synthesis of information throughout the development cycle, companies can free themselves from
prescheduled project time lines and formalized process steps and manage their resources and work flows more flexibly. They can keep their product options open longer, act on market information later, and reduce the delays, bottlenecks, rework, and wasted effort inherent in today's assembly-line product-development process.
Both managers and scholars increasingly realize the central role that product development plays in
creating competitive advantage. Deve nentst
Product Development is governed by the classic four forces of cycle time, product cost, development expenses and reduced product performance or feature set, Fig. 8 [17] that trade off
with each other. Improving PD Product Deveopment
should aim to achieve, at the same fea 'e an*
time, lower time to market, competitiveness through innovation and to lower costs due to change,
either because of the need to fix Fig. 8: the iron gate of Product Development failures or because of changing
customer requirements.
Product-development cycles have improved over the past two decades by following a more disciplined and rigorous process. However in the recent years, the pace of improvement seems to have levelled off, and companies are unable to meet the rising demand for better and more frequently launched new products aimed at narrower customer segments.
The conflict of opposing forces, the compelling need of nowadays to do more with less, sets the premises for growth, change, and progress. For example, new approaches to mass customization via product platforms are pursued. We believe that the auto industry is preparing for a huge technology revolution over the next few years, especially in PD.
Significant, permanent changes with holistic structural interventions and appropriate tools are needed to create a fire resistant product development system. Novel approaches are expected to have bigger benefits if:
* They are applied to the early phases where the leverage is higher, * They dramatically reduce the time taken to perform design iterations. In what follows each of features will be briefly discussed
The crucial role of the early phases
of PD Detail design and devdopment
~75-Experience of manufacturers in 8 "em alysis, evahiaflon of
z~ alternalves(traeofts system
8 deflitan etc.
many industries has shown that 80%
so-hbuket anaysis, feasbiliy study,
of the total time and cost of product - le
25maintnn ce concept, etc
development are committed in the
early stages of product 0-f
development, when only 5% of ..
project time and cost have been expended (Fig. 9 [18] ). This is
Fig. 9: Lifecycle cost committed Vs. Project Phase
because in the early concept stages, fundamental decisions are made
regarding basic geometry, materials, system configuration, and manufacturing processes [19] Further along in the cycle, changes get harder to make. Essentially, the time and cost to correct problems increase ten-fold with each step of the product development cycle [20] concept definition, detailed design, prototype
manufacture, prototype testing, and
production, Fig. 10. So a relatively minor t'o
change that would have cost a few dollars if made in the concept definition stage, could end up costing hundreds of thousands of dollars in the production
stage, or millions if flawed products are C. E.
shipped.
Despite the crucial importance of this
delicate phase, surprisingly in the Fig. 10: The cost of change industry it is not given the attention it
deserves. This has, as a consequence, a
lot of failure-trial-fix loops and development costs dominated by failure recovery actions (Fig.
11 - [21] ).
Consequently any PD improvement will be more beneficial if allows better exploration and resolution of the system's trade-offs in the early stages of design definition.
73% 0 Single Engine Certification Dmonstration 10% EnIneerpn 15
Initial Design 2 % YEARS
Examples of Nonrecurring Development Costs
Rocket Engines " SSME $ 2.8 B - F-1 $ 2.4 B - J-2 $ 1.7 B Jet Engines -F-100 $ 2.0 B Automobiles - 1996 Ford Taurus $ 2.8 B
Fig. 11: Product Development Costs: dominated by rework
Design iterations
Product Development is inherently iterative and this property makes it particularly difficult to keep it under control. Delays in schedule and budget excedances are common. The combination of the interdependency structure and dynamics delays cause development problems (issues) believed to be solved (closed) to re-appear (reopen) at later stages of development.
As an anonymous product development manager at an
automobile manufacturer said, "We 1000%
just churn and chase our tail until t " ?"n* .* .
someone says that they won't be 2
able to make the launch date." [22] 7i Iterations occur because of A 2
inherently conflicting trade-offs for . 1 2 . 1
which it's very difficult to find a.
balance and they usually represent Fig. 12: Iterations grows exponentially with product's and
a major portion of the product organizational complexity
development leadtime and cost.
Iterations duration increases exponentially with the number of interrelated activities and, consequently, with product / organizational complexity (Fig. 12, [23] , [24] ).
The modest effort that is usually deployed in the concept design phase leads to a limited number of design iterations whereas they could be more rewarding. Consequently, the design space is poorly explored and / or some design aspects are neglected. This poor job in the concept design sets the seeds for the rework that will surface downstream in the project, causing longer and more expensive design loops.
Hence, an improvement in PD should allow performing more design iterations, particularly in the concept and preliminary design phase.
CAx tools are extensively used in these early stages to virtually simulate the performance of the product. Impressive advances are being made in the application of M&S in design. However, M&S is believed to still be in its infancy. M&S tools suffer several limitations,
among which we can enumerate the following:
" They are complex, and each tool requires a specifically designed data set to enable its
operation.
* Creation of the data sets and models that enable accurate simulation is costly and time-consuming.
* Difficulty of calibrating the models against real experimental data
" Interoperability is a huge issue
* The models that now exist are in most cases incomplete, in that they do not always support good decision processes with accurate bounding of risks and uncertainty.
* Current models are unable to allow the evaluation of design alternatives across different disciplines and that prevents a great opportunity for cost effective, robust designs that meet all product requirements.
1.1.4. The Enhanced Product Development Framework
Given this scenario of strong forces that push for cost and leadtime reduction and to increased flexibility, having identified the concept / preliminary design as the highest returns phase where to intervene and having isolated an important source of waste, namely design iterations, we can now proceed to formulate a roadmap for a solution.
We envision an approach to product development with superior performance the one which, assuming a system's perspective, considers the product in its all performance dimensions, minimizes the disruptions by establishing optimum communication channels along the interdependence lines and allows fast execution of design iterations.
This Enhanced Development Framework is therefore a development process that has to, simultaneously, take care of all targets and constraints and deal with several different analysis disciplines in an integrated environment for concept evaluation, optimisation, verification, and multiphysics integration. It should also enable the developers to reach overall best solutions and very closely survey the different conceptual limitations.
We argue that Multi-disciplinary Design Optimization appears well positioned to become the core of this environment. To exploit its full potential, MDO needs to be executed in an Integrated Concurrent Engineering platform where seamless data transfer among simulation packages occurs. The greater the number of product performance dimensions and the deeper is the interrelation among them, the higher the advantages expected of this methodology will be.
The EDF with its high performance ICE platform is projected to enable a very fast execution of design iterations in the early phases of PD. Consequently, many solutions can be
Eliminate
Failure Modes 73%
Demonstration Design & Engineering 70% 10% F Test & Demonstration 30%
0 =0
Certification Certification
Initial
Design TIME TIME
2% YEARS
Fig. 13: Computerized Engineering Vision
investigated at a relatively low cost. In addition, the MDO approach leads to evaluate each solution from all the relevant performance attributes standpoints. The combinations of the two factors, i.e. comprehensive design exploration and holistic perspective, is expected to reduce dramatically the cost of rework, thereby leading to product's value maximization, Fig. 13 [21]
Automakers search for ways to increase their speed, agility, situational awareness and ability to innovate and, in consequence, improve their competitive position. Following our industry and PDP analysis, MDO in an ICE framework is viewed and proposed as a mindset and a methodology to cope with the challenging demands that the market is imposing on automotive manufacturing firms, helping the transition in the product-development and engineering processes from a "test, analyze, and fix" paradigm toward an industry-ideal "design-right-first-time" for value maximization.
1.2. Objectives
Given the previously illustrated value proposition, the present work has the resulting set of goals:
" Explore Product Development improvement research
* Investigate the application of the Multi-disciplinary Multi-objective development paradigm in the automotive industry
" For a specific system, an exhaust system maniverter for passenger cars, evaluate
potential benefits and issues of the application of a MDO approach and of a system perspective in engineering simulation in terms of:
o Cost reduction
o Product development lead time reduction o Flexibility
o Innovation (non-traditional solutions)
" Perform a cost benefit analysis to verify that a project targeted to develop such a new
framework is characterized by a solid business case
" Outline an implementation roadmap in a business setting investigating the technical and
1.3. Operative Approach
1.3.1. Introduction
To prove the feasibility and robustness of the MDO approach in an ICE platform and evaluate the challenges of the implementation of the EDF as well as the potential rewards, a prototype of the proposed environment is built around a specific application. As a particular system an exhaust system manifold or, more precisely a maniverter (manifold+converter) for passengers cars, is chosen (see Fig. 14 for an example). The choice of this system is driven
by multiple reasons. First and foremost, an
exhaust maniverter is intrinsically a highly multi-disciplinary system: in fact, its design is governed by fluid dynamics requirements
(pressure losses, engine tuning), heat
management issues (gas temperature drop, Fig. 14: example of a maniverter system radiated heat) as well as structural constraints
(resonance frequencies, thermal stresses, vibration induced stresses), not to mention, packaging, manufacturability and cost. Second, the system is of a favourable medium-size complexity and therefore amenable to be managed in a limited resources-limited budget framework such as of a thesis project and yet it is not too simple to make the development trivial. Last, but not least, this is the type of systems which the writer has first hand experience and can have direct access to related information.
In building the prototype EDF, several guiding principles have been followed:
The ICE platform has been set-up with a modular structure with minimum interaction among the different software packages. This architecture ensures, at least conceptually, independence from the individual software and has several benefits:
o Possibility to replace easily one software package with another one, depending on the company strategy or available skills
o Possibility to use the best software package for the specific task
o Possibility to add at any time additional modules to widen the scope of the performance attributes evaluation.
* Single platform / single node execution. To mitigate interoperability issues all the software programs have been installed on a single computational platform. In addition a laptop has been chosen to favour the data and information exchange among the different people that contributed to the effort and that worked in different geographic locations. Since the chosen platform is not capable of computationally intensive calculations, analyses that require high computing power have been either discarded or low computational cost alternatives pursued. As an example, CFD, which is usually utilized in the development of maniverter to compute the pressure drop and flow distribution in front of the catalyst, was soon excluded from the analyses suite because of its computational requirements. As a competitive alternative, a 1-D fluid dynamic code was used.
* Emphasis is placed more on the characteristics of the process as a whole than on the accuracy of the results. The prototype environment created in the present work is intended to be a demonstrator of the advantages of the MDO approach and of the ICE platform and to verify the business / organizational implications of a potential implementation. Therefore breadth was emphasized rather than depth. Absolute accuracy of CAE results in the respective domains was not pursued, but care was only put that the trend showed by the calculus was in the right direction. For the same reason, the geometry was not modelled with all the details to keep the number of parameters
within a manageable range.
SMDO as a business tool. Taking a managerial perspective, the demonstrator was verified as a tool to improve some crucial business processes such as trade-off evaluation, decision-making and customer relationship
* Incremental approach. The framework was built incrementally to keep the complexity always at a controllability level. Complexity was raised progressively along two dimensions: application complexity and framework complexity. The complexity of the application was raised from a simple pipe with fixed centreline and variable cross sections, to a simplified maniverter with constant and circular cross section but variable piperun and finally to a maniverter system with several design variables.
1.3.2. Methodology
Given the project goals and the system to be analyzed, the following steps were taken:
" Scope definition
* Architecture / platform layout and essential pre-requisites list
" Hardware / software requirements " Partnership building
* Hardware / software acquisition * Literature search
* Project execution, i.e. building the EDF o Simple pipe
o Full manifold * Cost-Benefit Analysis
" Implementation layout:
o Skill set re-definition - Project Managers * Functional members o Change management
The following paragraphs briefly describe each of those steps.
Scope Definition
Even though this phase was iterative, a preliminary list of analyses and performance aspects to be evaluated has been laid out at the outset, using the experience in product development of the writer. Among those that were identified from the beginning, there are:
* Mass characteristics * Structural behavior
" Fluid Dynamic and thermal behaviour " Emissions performance
" Engine Performance " Cost
In subsequent phases, this list was then refined and tailored to the available options. Structural behavior was then restricted to the eigenfrequencies, excluding, on the other side, thermal induced stresses and forced vibration induced stresses. Fluid dynamic section was de-scoped from a full 3D Computational Fluid Dynamic (CFD) analysis because of too much