Analysis of MIT's Past and Future Energy Expenditure
MASSACHUby OF TE
Michael Hartman
JUL
LIB
Submitted to the
AF
Department of Mechanical Engineering
in Partial Fulfillment of the Requirements for the Degree of
ISETTS INSTITUTESETTS INSTITUTE
CHNOLOGY
162019
RARIES
CHIVES
Bachelor of Science in Mechanical Engineering at the
Massachusetts Institute of Technology
June 2019
2019 Massachusetts Institute of Technology. All rights reserved.
Signature redacted
Signature of Author:Department of Mechanical Engineering May 10, 2019
Signature redacted
Certified by:
\j V Timothy Gutowski
Professor of Mechanical Engineering
Signature redacted
Thesis SupervisorAccepted by:
Maria Yang Professor of Mechanical Engineering Undergraduate Officer
77 Massachusetts Avenue Cambridge, MA 02139 http://Iibraries.mit.edu/ask
DISCLAIMER NOTICE
Due to the condition of the original material, there are unavoidable
flaws in this reproduction. We have made every effort possible to
provide you with the best copy available.
Thank you.
The images contained in this document are of the
best quality available.
Analysis of MIT's Past and Future Energy Expenditure
by Michael Hartman
Submitted to the Department of Mechanical Engineering on May 10, 2019 in Partial Fulfillment of the
Requirements for the Degree of
Bachelor of Science in Mechanical Engineering
ABSTRACT
With the current rate at which technology is advancing, MIT has to update and replace out-of-date facilities as well as add new ones to stay at the forefront of university research. As MIT continues to expand its facilities, the amount of energy required to run those facilities will also increase. An analysis of future energy usage allows for energy saving systems to be planned before the facilities are complete, and implementation can be started before the energy has been spent. This thesis will be such an analysis on the energy usage of MIT's current capital projects, as well as the historical trends of MIT's energy usage. Conclusions will be drawn on how much these facilities or renovations will increase the university's energy expenditure by comparing facilities that currently exist to ones that are still in planning. By comparing the EUI of planned capital projects to that of existing facilities, a range was found for each facility's energy usage. Using this data, it was found that MIT will see a change in purchased energy between -16.5% and 4.28% by 2030. The low energy estimate matches with MIT's claimed -15% by 2030. The high energy estimate does not match, and shows that the rate at which MIT is currently
expanding is not sustainable until 2030.
Thesis Supervisor: Timothy Gutowski Title: Professor of Mechanical Engineering
Table of Contents
Abstract 2 Table of Contents 3 List of Figures 4 1. Introduction 5 1.1 Motivation 5 1.2 Efficiency 61.2.1 Purchased vs. Building Input 6
1.2.2 Central Utilities Plant 7
2. Comparisons and Calculations 11
2.1 Historical Trends 11
2.2 Capital Project Estimations 16
2.2.1 Capital Project Information 16
2.2.2 Schwarzman College of Computing 17
2.2.3 Vassar Street Residence 17
2.2.4 Metropolitan Warehouse 18 2.2.5 Volpes Site 18 2.2.6 Music Building 18 2.2.7 Kendall Site 4 19 2.2.8 Nano Building 19 2.3 Future Projections 20 3. Conclusions 21 4. References 23
List of Figures and Tables
Figure 1-1: Figure 1-2: Figure 1-3: Figure 1-4: Figure 1-5: Figure 1-6: Figure 2-1: Figure 2-2: Figure 2-3: Figure 2-4: Figure 2-5: Figure 2-6: Figure 2-7: Figure 2-8: Figure 2-9: Figure 2-10: Figure 2-11: Table 2-1:MIT's Plan to Reduce Emissions Resource Transfer Diagram 2020 CUP Energy Flow Diagram CUP Efficiency Graph
Campus Efficiency Graph Electricity Usage Graph
MIT Greenhouse Gas Emissions Inventory
MIT's Purchased Energy During the Efficiency Phase Energy Usage Separated by Calendar Year Quarters
Energy Purchased Building Input Total Degree Days
Energy Purchased Scaled by Total Degree Days Building Input Scaled by Total Degree Days Facility Area Growth
Total Campus EUI Capital Project Additions Capital Project Information
5
6
7 89
10 11 12 13 14 14 14 14 14 15 15 20 16Introduction
1.1 Motivation
MIT is currently in a phase of constant growth, and it has been for some time. This growth involves expanding their facilities through either renovations or adding entirely new facilities. These new additions inevitably effect the amount of energy used by MIT as a whole either by a positive impact where energy is saved, or a negative one, where the amount of energy purchased and used is increased. MIT is aware of this correlation between growth and increased energy usage, and, in efforts to stay within regulations and the constant strive towards a greener planet, MIT has introduced a plan that decreases the increase caused by the expansion.
MIT plan
Reduce emissions at least 32% by 2030 from a 2014 baseline "
Campus
growth 10%4
Central Utility 1-3*/B E
Plant (CUP) 17%
enhancements Efficiency On-site
gains in solar - - - - -
-Large-scale 32% REDUCTION GOAL
solar project T
COC1
CARBON NEUTRAL
Figure 1-1 MIT's Plan to Reduce Emissions [1]
In this figure, MIT appears to claim that by 2030, they will see a +10% increase in CO2e
emissions by 2030. Figure 1-1 also shows that the +10% emissions increase will be negated due
decrease emissions will reduce the current output by -15% when compared to 2014, the reference year for MIT's energy usage.
Figure 1-1 shows predictions for campus emissions until 2030, using 2014 as a reference. The units used in Figure 1-1, Metric Tons of CO2e, has a direct conversion to the amount of energy used by the university, kBTU and MMBTU. Therefore, the same percentage decreases found in the official emissions predictions should be reflected by the energy usage for large periods of time. When dealing with the CUP upgrade, however, this unit change must be accounted for since it involves a specific year. In 2014, MIT still used a significant amount of fuel oils #6 and #2 in the
CUP, which has a larger impact on Metric Tons of CO2e than on energy, therefore a +10% increase
in efficiency with Metric Tons of CO2e correlates to a +9.48% increase in efficiency with energy. In this thesis, estimations will be made using energy data to see how valid MIT's claims are.
1.2 Efficiency
1.2.1 Purchased vs. Building Input
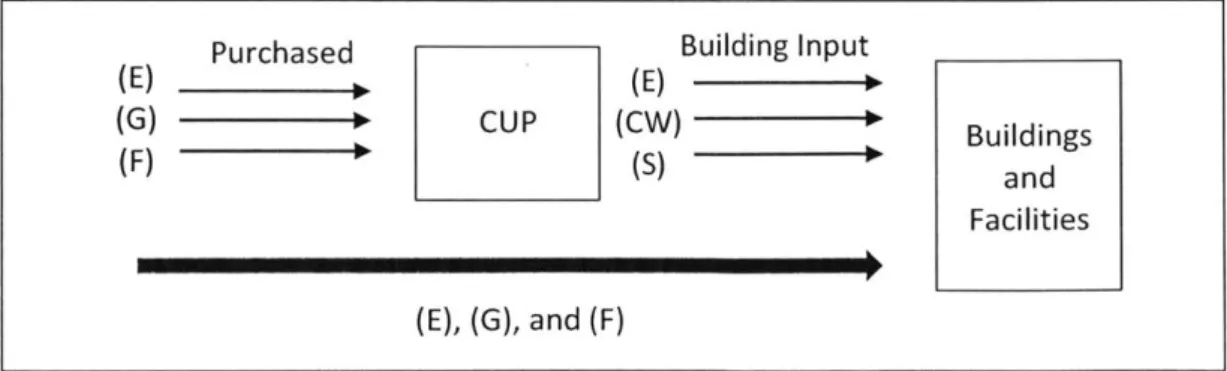
MIT receives energy in the form of gas, electricity, and fuel oils. Most of the gas (G) and fuel oils (F) are converted into usable energy through the CUP, which will be discussed in section 1.2.2, to produce steam (S), chilled water (CW), and more electricity (E). Through this process, there can be significant losses due to entropy. Purchased Electricity, however, can go directly to the campus without any significant losses.
Purchased Building Input
(E) (E)
(G) CUP (CW) _
Buildings
(F) (S) and
Facilities
Figure 1-2 Resource Transfer Diagram
Figure 1.2 is a basic illustration of where resources are transferred. The Purchased
resources are never able to be converted at a 100% rate, and there will always be loses in such processes.
1.2.2 Central Utilities Plant
Most of the energy used by MIT's facilities must go through the Central Utilities Plant
(CUP), while a small percentage goes directly to the facilities. Energy is inevitably lost during this
conversion and causes a divide in the amount of purchased energy, and the amount of energy input
to the facilities. 2001 so KPPH 100$a" W/00 $0 XPH UniOd IW0KPPHMe
~COGEN
- 0 TObbnw TUWOlne 22M WV i 22M4WIWo Evaww W3 KV 1 624 MA PWOna Subaoft" 13.8 KV & Z4AK VFOUACAMOFR0G( STEAM 100 WMr1l C-nwokE O 00* am TO --cam. 1-2 law0Tog E&0616K 3 4000 TOMNS3
CNm 4 400 TONS Coen " O TOS Ea.
A2V~aw ChedWar mW. Coabv T~n
CeWare
003r 1-241000 TOW 10 E40 CCW C6er4 UONTOOS@ 040 SCOWP
I
C74 200 TONS EACMOMe -10 200 TONS E.
0 11-12 2SOOTOSAF WA___
4r ahfdW-a
I ONatflNG.iipus
NOTE, Nwn aMeeaopia eetnn* .PAO =cspttydepenosc-eqpnWt -d a.SinueAdSWt.
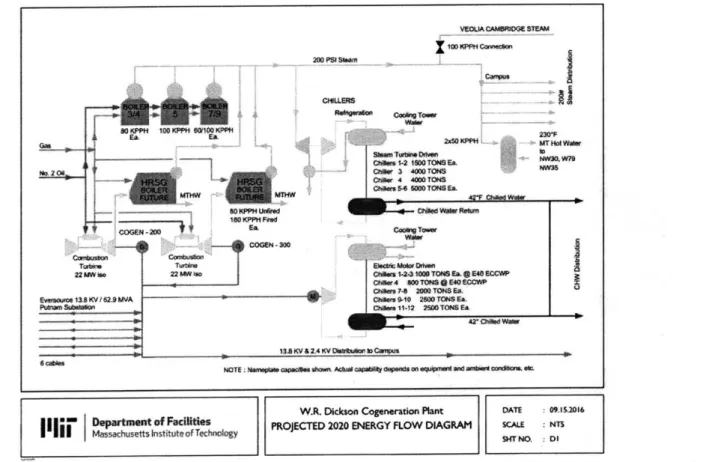
W-W.R. Dickson Cogenration Plant DATE 09 132016
Ii r
I Msachust of trnoiogy PROJECTED 2020 ENERGY FLOW DIAGRAM SCALE :NTSe itoTNO. 01
Figure 1-3 gives a detailed look at the process at which gas, oil, and electricity are converted through the CUP. Resources are purchased on the left side, then converted or directly transferred to campus on the right side. Purchased gas and oils are used to drive boilers to produce steam and turbines to run a cogeneration process.
Cogeneration is when excess heat, that would usually be wasted, is used to produce a usable
resource. In the CUP, cogeneration runs on the excess heat from a combustion turbine that
normally produces electricity. This excess heat is transferred to boilers that produce more steam. The cogeneration process makes a significant contribution to the efficiency of the CUP, and by adding another turbine in 2020, MIT projects they can achieve an extra +9.48% efficiency from the CUP when compared to 2014.
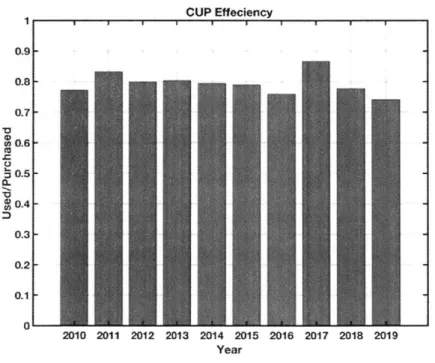
CUP Effeciency I I-I- I--....-..1 0.9 0.8 0.7- 0.3- 0.2-0.1 2010 2011 2012 2013 2014 2015 2016 2017 2018 2019 Year
Figure 1-4 CUP Efficiency Graph [3]
By taking the ratio of purchased energy to the CUP and the building input the CUP sends
to campus, values for CUP efficiency are found. Due to the cogeneration processes, the CUP is able to achieve very high efficiencies averaging at 0.79 while having a slight annual decrease by
-0.35%. While 0.79 is a very high ratio, a ratio of 1 can never be achieved. Even with cogeneration, a system cannot achieve a perfect conversion from natural resources to usable energy. There will always be loses due to entropy from the irreversible reactions from gas combustion and turbine friction. Despite this, MIT sees an outlier efficiency of 0.87 in 2017. This maximum does not follow the decreasing trend shown in the figure, and without it, the CUP sees an annual decrease of -0.49%. For the entire campus, an efficiency analysis can be found below.
1 Effeciency per Year
0.9 -00.8 0. .50.7 0.2 A 0.1 2010 2011 2012 2013 2014 2015 2016 2017 2018 Years
Figure 1-5 Campus Efficiency Graph [3]
Here we can see that MIT has an average efficiency ratio of 0.80 with a slight increase of +0.02% per year, while the CUP has an average of 0.79 and decreases at -0.49% per year. Once again, the peak at 2017 appears, but is even higher for the entire campus, maxing at 0.89.
The immediate leap in efficiency is not random. During 2017, the CUP was under
maintenance and had to be shut down, causing the campus to purchase a higher amount of electricity. Purchased energy in the form of electricity can go directly to the campus without any
significant loses, therefore, if a high percentage of the purchased resources is electricity, there will be a direct impact on efficiency.
0.25 Electricity Usage Over Time
0.2 0.2-i 0.15 0 4) 0.1 0.05-01 2011 2012 2013 2014 2015 2016 2017 2018 Year
Figure 1-6 Electricity Usage Graph [3]
Figure 1.6 shows the percentage of campus wide, purchased electricity for each year. 2017 is where we can find the maximum of the purchased electricity ratio, therefore, we also find the maximum efficiency. The varying electricity percentages in other years are small compared to the
0.23 found in 2017, and do not have as large of an impact. The spike in 2017 goes beyond two
Comparisons and Calculations:
2.1 Historical Trends
Before an analysis of the future can be correctly conducted, the past must be analyzed for the trends of MIT's energy usage. Going back to 2006 and 2014, MIT has been in what they call an Efficiency Phase, where they have tried to reduce the amount of purchased energy compared to the rate at which they are expanding. This phase has a great significance in the current model of MIT's energy usage trends because it is where the response to the peak of MIT's energy usage since 1980 is found. When MIT hit the peak in 2006, new facilities were nearing competition that would dramatically increase the already record high usage. These facilities would go on to become the most energy intensive buildings at MIT, being the Brain and Cognitive Sciences, building 46 and the Koch Institute for Cancer Research, building 76, which combined make up around 10% of MIT's current energy expenditure.
n ANNUAL EMISSIONS
PRE-COGEN
ENERGY USE
sJL-DN"G ONLY AUDITEDSTARTS201A
~
rM71
COGENERATION GROWTH
IM640 2C-2MS
MISSiONS DATA
EFFICIENCY CIMATE LEADERSHIP
022M4 2M18
Figure 2-1 MIT Greenhouse Gas Emissions Inventory [4] Ly
Given the start of the Efficiency Phase in 2006, MIT's purchased energy trends in this phase are found below.
x 166 Historical Purchased Energy
Linear FI
2.5-0
2006 2008 2010 2012 2014 2016 2018 2020
Year
Figure 2-2 MIT's Purchased Energy During the Efficiency Phase [3]
A linear fit to this data shows that the average, yearly value for purchased energy has
declined -1.12% per year since 2006. An annual decrease of -1.12% would result in a total decrease of -17.92% by 2030 as compared to 2014. By looking at the historical, purchased energy data alone, the -15% decrease MIT claims to see by 2030 seems reasonable, but this estimation does not include any capital projects MIT is currently working on, nor does it include the weather or efficiency.
Cambridge is a very cold place, and keeping facilities warm in an area with such low temperatures requires a larger amount of energy usage. A more detailed look at the years shows us that the first quarter of the calendar year, which is the coldest, gives the highest output of energy.
X15 Quarterly Purchased Energy 14. 12 10 6- 2-0 2011 2012 2013 2014 2015 2016 2017 2018 2019 Yearly Quarters
Figure 2-3 Energy Usage Separated by Calendar Year Quarters [3]
In this figure, there are clear spikes each year when Cambridge is the coldest, suggesting that the weather has a non-negligible impact on how much energy is required to run the facilities. With each passing year comes a different set of temperatures that need to be accounted for by facilities. This is quantified by heating and cooling degree days (HDD and CDD), which, when added, make total degree days (TDD). A degree day is measured by taking the difference of the temperature of the outside and the temperature you want to keep your facilities for each day. This data is then added up over a time period and can be used to scale the energy usage and input by year for a more accurate representation of the change in energy used and energy input for MIT's facilities.
x10 Yearly EneW Purchased
2010 2011 2012 2013 2014 2015 2016 2017 2018
Years
x10 Yeary Buildng Input
52-a
0
2010 2011 2012 2013 2014 2015 2016 2017 2018
Years
Total Dogree Days 6000 6 000 Im 2010 2011 2012 2013 2014 2015 2016 2017 2018 Years tW.d EM.~y SCalad by ID Fl tAoo-Ru~bno 027 4c0od by TDDJF1 400.
20%20 011 001 2013 204 2015 200 2017 a 2010 nil0 201 02 2013 2014 201 a"?* 2 a07
Figures 2-4, 5, 6, 7, and 8 show the energy input and the energy used by MIT's facilities. [5] [3] From this data, we can see that, once scaled, purchased energy decreases annually by -1.50% in Figure 2-6 and input energy decreases annually by -1.40% in Figure 2-7. However, an analysis of the decline in energy usage is only useful if it can be related to the gross area of the facilities.
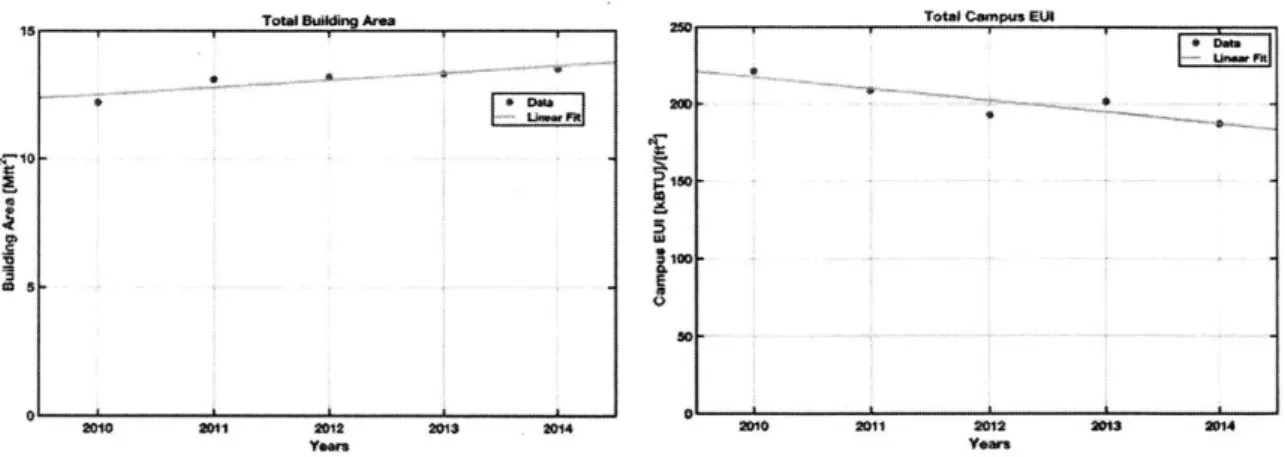
Total uild250Are T*ta Qampus Mt TA A.-ISO-~ 1100. a, 0 1 it;0 201 2011 2013 204 2010 2011 2412 20301
Figures 2-9 and 10 Facility Area Growth and Total Campus EUI [3]
Figure 2-9 shows the relation between energy, after being scaled by TDD, and building
area creating an energy unit intensity (EUI), measured in kBTU/ft2, for years 2010 through 2014.
Figure 2-9 shows that total building area has increased by +2.29% per year, while 2-10 shows that the total EUI has decreased by -3.36% per year. From 2010 to 2014, the total building area has been increased by +11.45% while the campus-wide EUI has seen a total decrease of -16.80%. These numbers hold very significant implications. A decreasing EUI paired with increasing building area means MIT is getting more efficient with its building space. While these graphs only show a brief period, between 2010 and 2014, the information extrapolated from them can still be useful, if it can match with the data found in previous sections.
E= EUI * B (eq. 1) E,= EI * (eq. 2) E= EUI * B * P(eq.3) EI dEp 1 dEp I dEUI 1 dB El Eq Ep dt EUI dt Bdt Ep dt -1.56% = -3.36% + 2.29% - 0.49 -1.56% = -3.36% + 2.29% - 0.35% V- Unow FK1
Where E, building input energy (MMBTU), Ep is purchased energy (MMBTU), and B is
total building area (Mft2). Using eq. 4 and inputting an annual EUI decrease of -3.36%, annual
building area increase of +2.29%, and an annual CUP efficiency decrease of either -0.49% or
-0.35%, it is found that the purchased energy decreases by -1.56% or -1.42% each year. When
these values are compared to the purchased energy data that had been scaled by yearly TDD where an annual decrease of -1.50% was found, we see that the brief period of Figures 2-9 and 10 still gives meaningful insight to MIT's trends.
2.2
Capital Project Estimations
2.2.1 Capital Project information
MIT has several capital projects either in construction or completed. While exact building
specifications are not currently available, estimations can be made on how much of an impact the facilities will have on the building service input. An estimation for how much a building will use is best found by using a range rather than trying to match buildings under construction or in planning to ones that is already complete. An EUI is best for such calculations because. Based on what each capital project will be used for, a range can be found between the highest and lowest
EUI that can be expected for such a building to use, and using eq. 1, which requires a knowledge
Completion Start Area EUI Upper EUI Lower Estimated Estimated Previous Percentage Percentage Date Date lsqit.) i(kTU/sq.ft.) (kTU/q-ft.) Upper (kBTU) Lower (kUTU Usage (kBTU) High vs 2014 Low vs 2014 LWabs/Mixed 2022 TBD Const. 221,194 500: 206 110,597,000 45,565,964- 4.38 180
...- --- --... .... .... .. .. .. - --
Wpe Site Labs/Mixed 2022 2019 Const. 375,000 278 151 104,250,000 56,625,000 4 13 2.24
Labs/Mixed 2022 2019 Renov. 160,000 500 217 76,912,070 31632,070 3,087.930 3,04 1.25 Music Buiding Recreation 2022 TBD C t. 33,000 319 45 10,527,000 1 468,5- 0.42 0.06
Vasa teet ice Offdu Off s/Mied s ie 2020 200 2018 21 Const. os. 156,000 , _______________1069 112 80 17,503,200 12.480,000 069 0.49.9
Kendall Ste 4 Residence 1 2020 2017 Renov. 133,062 117 73 12,640,479 6,759,138 2,981,000 0.50 0.27
Nano Buding Labs 2018 compfete Cons 237, MI 7.m 173,332,750 166,443,9W 5,734,450 7 . 6,59
-~Co x ---- -- --
--Sum of Percentages High and low 1S 84 10,9
Table 2-1 Capital Project Information [6]
Information was gathered for each capital project MIT is planning and ordered into a table based on date of completion. The upper and lower EUI bounds were found for each project, and a subsequent energy usage range was then calculated. For projects undergoing renovations or still waiting to fully come online, such as the Nano building, the current usage was subtracted from each value in the estimated range. Lastly, a percentage was calculated from the range divided by the energy usage of 2014, the reference year, and summed at the bottom of the table.
2.2.2 Schwarzman College of Computing
The new College MIT is planning on adding will be a hub for a new addition for the Computer Science department, and will have a ten-story building with an area of 160,000 square feet. The lowest reasonable range for this facility would be the Media Lab, which is currently a harbor for the Architecture and Computer Science departments. There is a possibility that this College will be similar to the current, off campus IST servers in building W9 1, which would have a large EUI. Given this information, an estimate for the kBTU this facility will use can be found
by plugging into equation 1 and subtracting the current energy usage of building 44. This gives
76,912,070 kBTU, (2.3% of 2014) as the high estimate, and 31,632,070 kBTU (0.95% of 2014) as the low estimate.
2.2.3 Vassar Street Residence
The Vassar Street Residence will be a new dorm added to campus that holds around 450 new students. The facility will be running in 2020, and will use somewhere between the current dorms with the similar student count, Simmons and Next House. The new building will have an area of 156,000 square feet, therefore the range for kBTU used by this facility will be between: 17,503,200 kBTU (0.53% of 2014) and 12,480,000 kBTU (0.37% of 2014).
2.2.4 Metropolitan Warehouse
MIT has purchased the currently existing Metropolitan Warehouse, and will repurpose the Warehouse to be new headquarters for the department of Architecture, which currently resides in the Media Lab. The facility is expected to be finished in 2022, and will have an area of 221,194 square feet. The estimations for this facility are taken from a similar building in size and function, Mclarun Building 4, and for the high estimate, the Brain and Cognitive Sciences Building 46. This results with a range between: 110,597,000 kBTU (3.3% of 2014) and 45,565,964 (1.4% of 2014) kBTU.
2.2.5 Volpe Site
MIT is working on a redevelopment of the John A. Volpe National Transportation Systems Center in Kendall Square. The site has a varied potential and will be heavily mixed between
offices, housing, and labs. The site, therefore, cannot have a reasonable estimate using the high and lows used previously. The site will have an area of 375,000 square feet. The median values of the Labs and Offices are more appropriate since the facility will have such a range between: 61,491,932 kBTU (3.1% of 2014) and 33,400,294 (1.7% of 2014) kBTU.
2.2.6 Music Building
MIT is planning to expand its current music program by adding a dedicated Music
Building. This facility will hold places for recoding, research and a performance lab. The building is planned to be 33,000 square feet. The estimates used for this facility are the Samuel Tak Lee building on the high end, and NW 23 for the low end. These estimates result in a range between: 10,527,000 kBTU (0.32% of 2014) and 1,468,500 kBTU (0.04% of 2014).
2.2.7 Kendall Site 4
MIT is planning a very large-scale project to add many facilities to Kendall. Most of these facilities will be used commercially and not be drawing energy from MITs usage, but Site 4 will be used for offices and graduate student housing. The building will be 133,000 square feet, and will hold around 500 graduate students, leading to a range between: 12,640,479 kBTU (0.38% of 2014) and 6,759,138 kBTU (0.20% of 2014).
2.2.8 Nano Building
The Nano Building was completed in 2018, but has not fully come online. The facility
houses a large set of labs designed to study materials on the nanoscale. This facility is planned to
with the facility's area of 237,777 square feet results in either: 178,332,750 kBTU (5.38% of 2014) or 166,443,900 kBTU (5.02% of 2014).
2.3 Future Projections
Using the estimates in 2.2, a timeline was made comparing the current usage to the estimated change over time. This timeline only goes to 2022, the last year of planned Capital Projects, and can be found in figure 5 below.
-x10 6 5' W-CI 1. 0. 2014...
Building Services Demand Independent of Effeciency Improvements
2018 2019 2020
Year
2021 2022
Figure 2-11 Capital Project Additions [6] [3]
From the estimations in Figure 2-11, MIT will see an increase in building input between
+10.90% as the low estimate increase and +15.84% as the high estimate when compared to 2014.
Both of these values show MIT's claim to only see a growth of +10% to be inaccurate, and overshoots the estimate by +0.90% and +5.84%.
3 5 5--High 0 X10 6
Conclusions
In 2014, MIT made the statement to reduce CO2e emissions by -15% by 2030 due to efficiency gains in buildings. Since then, the university has seen great improvements to efficiency.
By determining the difference between energy potential of purchased resources and the energy
input to the campus, it was found that the university has seen a generally consistent efficiency ratio since 2012. A spike in efficiency was found in 2017, but was caused by repairs to the CUP, making the facility go offline and give inaccurate readings for the year. With an upgrade in the CUP set for 2020 that will increase the plant's efficiency to +9.48% greater than in 2014, the CUP will have a new average efficiency of 88.48%.
MIT is constantly expanding its total building area at an annual rate of +2.29%, and this would normally be expected to be accompanied by a similar response from the purchased energy, but the opposite has been observed. Total building EUI is lowering by -3.36% per year. An analysis of this data found MIT's purchased energy was decreasing by -1.50% per year when scaled by TDD (F). With such a rate, MIT will see a total decrease in scaled purchased energy of -24% by 2030.
When determining the future energy cost of MIT's campus, estimations were made about the current capital projects the university is planning. It was determined that MIT would see an increase between +10.90% and +15.84% in building input when the new facilities are added, both values higher than the claimed +10% growth from MIT's statement.
There are two ways a projection to 2030 can be done, giving a wide range of a lower limit and upper limit. The lower limit assumes MIT will have no more capital projects until 2030, meaning the increase due to the current capital projects will be the only increase MIT will see between 2022 and 2030. The upper limit assumes MIT will continue at the same rate of expansion
and will continue to add capital projects at the same rate until 2030. The low estimation gives a total change between -20.98% and -16.04%, while the high limit gives a change between -10.08% and -0.19%. The low limit gives a range that makes the claimed -15% from MIT seem modest. The high limit, however, sees an increase of -10.08% and -0.19% by 2030, which is not close to the -15% MIT claims. The high range found in this thesis shows that the growth MIT will see until 2022 is not sustainable to 2030, while the low range represents the lower bound MIT could see until 2030. The true value of MIT's growth until 2030 lies within these bounds.
References
1. Figure 1-1 comes from MIT Class 2.S999 Solving for Carbon Neutrality at MIT, Prof.
Timothy Gutowski
2. Figure 1-3 comes from W.R. Dickson Cogeneration Plant PROJECT 2020 ENERGY FLOW DIAGRAM, MIT Department of Facilities, 09/15/2016
3. EnergizeMIT,ttps://tableau.mit.edu/views/Energize MIT/Energize MIT?%3Aerbed= y&%3AshowShareOptions=true&%3Adisplav count=no&%3AshowVizHome=no&%
3
Aoriginal view=ves#1, accessed 05/08/2019
4. Understanding Energy at MIT, https://sustainability.mit.edu/sites/default/files/resources/ 2018-09/mit-energynarrative_2017.pdf, accessed 05/08/2019
5. Weather Data Depot, http://www.weatherdatadepot.com/, accessed 05/08/2019
![Figure 1-1 MIT's Plan to Reduce Emissions [1]](https://thumb-eu.123doks.com/thumbv2/123doknet/14171956.474739/6.917.126.772.493.871/figure-mit-s-plan-reduce-emissions.webp)
![Figure 1-5 Campus Efficiency Graph [3]](https://thumb-eu.123doks.com/thumbv2/123doknet/14171956.474739/10.917.170.696.361.710/figure-campus-efficiency-graph.webp)
![Figure 1-6 Electricity Usage Graph [3]](https://thumb-eu.123doks.com/thumbv2/123doknet/14171956.474739/11.917.178.666.216.576/figure-electricity-usage-graph.webp)
![Figure 2-1 MIT Greenhouse Gas Emissions Inventory [4]](https://thumb-eu.123doks.com/thumbv2/123doknet/14171956.474739/12.917.133.783.702.993/figure-mit-greenhouse-gas-emissions-inventory.webp)
![Figure 2-2 MIT's Purchased Energy During the Efficiency Phase [3]](https://thumb-eu.123doks.com/thumbv2/123doknet/14171956.474739/13.917.127.747.217.574/figure-mit-s-purchased-energy-efficiency-phase.webp)
![Figure 2-3 Energy Usage Separated by Calendar Year Quarters [3]](https://thumb-eu.123doks.com/thumbv2/123doknet/14171956.474739/14.917.130.727.128.515/figure-energy-usage-separated-by-calendar-year-quarters.webp)