• Aucun résultat trouvé

conjugates as mixed CO/NO-releasing molecules †

N/A
N/A
Protected

Academic year: 2021

Partager "conjugates as mixed CO/NO-releasing molecules †"

Copied!
10
0
0

Texte intégral

(1)

N -Nitrosamine-{ cis -Re[CO] 2 } 2+ cobalamin

conjugates as mixed CO/NO-releasing molecules †

Giuseppe Santoro,

a

Ruben Beltrami,

b

Emmanuel Kottelat,

b

Olivier Blacque,

a

Anna Yu. Bogdanova

c

and Fabio Zobi*

b

Mixed CO/NO-releasing molecules were prepared by conjugation of the 17-electron rhenium dicarbonyl cis-[Re(CO)2Br4]2−complex to N-nitrosamine modified cyanocobalamin (B12) bio-vectors. The species were fully characterized by standard analytical techniques, including X-ray crystallography for cyanocobal- amin-5’-O-pyrazine and (1) and itsN-pyrazine nitrosylated derivative (1a). TheN-nitrosamine B12 deriva- tives are able to liberate low NO doses in buffer solutions and appear to be“activated” towards NO release if in contact with cultured cells. Coordination of the cis-[Re(CO)2Br4]2− complex on the axial cyanide of B12 allows for the combined loss of CO and NO from the conjugates. The mixed CO/NO- releasing molecules show cytoprotection in an ischemia–reperfusion model but no significant enhanced synergistic effects over the relative NORMs and CORMs building constituents.

Introduction

Nitric oxide (NO) and carbon monoxide (CO) are established gasotransmitters involved in multiple signalling pathways in cells and tissues. NO is formed enzymatically as a product of

L

-arginine cleavage by NO synthases (NOS) and upon non-enzy- matic reduction of NO

2

by deoxygenated haemoglobin and myoglobin. CO is produced during the degradation of heme by heme oxygenases (HOs). Crucial importance of NO and CO for living organisms was confirmed by the studies of HOs and NOS in knockout mice. Biochemical parallels between the two gases are particularly striking in the circulation and nervous system where both NO and CO may function as co-transmitters in the same neurons.

1,2

Strong evidence supports the notion that interactions of CO and NO may influence the physiologi- cal responses to each of these gases at the enzyme biosynthetic level via a positive feedback loop mechanism whereby NO elevates the levels of heme oxygenase-1 mRNA and protein,

3–5

and CO increases the steady state level of NO.

6

Uncoupling or dysregulation of NO and CO production results in severe

pathologies such as oncotransformation, hypertension, chemo- reception, cardiovascular diseases etc.

7–9

Restoration of NO/CO bioavailability upon exhaustion of their pools in diseased tissues may be achieved by adminis- tration of NO and CO releasing molecules.

10,11

Nitric oxide releasing molecules (NORMs) have been used for more than 100 years for therapeutic use.

12–14

More recently, CORMs (CO releasing molecules) have been the subject of intense scrutiny.

15–20

Like their nitric oxide-releasing counterparts, CORMs are pro-drugs that upon activation release therapeutic doses of carbon monoxide and display beneficial e ff ects in e.g.

atherosclerosis, vascular constriction, inflammation, cellular protection, hyperoxia-induced injury, and other physiological situations.

21

In light of the akin biological roles of NO and CO, synergistic cytoprotective e ff ects of two gases might be expected. Indeed these were demonstrated in an acute hepatic and vascular injury model.

22,23

Intrigued by these reports, we hypothesized that mixed CO/NO-releasing molecules could provide an advantageous alternative to CORMs and NORMs, as such entities should be able to deliver both gasotransmitters and thus in principle promote, or exploit, the positive feedback loop mechanism now recognized for the two diatomic mole- cules in higher organisms. To the best of our knowledge, a chemical approach to these types of molecules has not yet been described.

To test our hypothesis we prepared mixed CO/NO-releasing molecules from the reaction of the 17-electron organometallic CORM cis-[Re(CO)

2

Br

4

]

2−

complex with N-nitrosamine functio- nalized cyanocobalamin (B12) bio-vectors. The design of the molecules was based on previous findings published by our group. Indeed in the last few years we have shown that d

5

†Electronic supplementary information (ESI) available: Crystal data and struc- ture refinement for1and1a;1H-NMR, UV-Vis, HPLC, IR and high-resolution MS spectra of molecules. CCDC 1054820 and 1054821. For ESI and crystallographic data in CIF or other electronic format

aDepartment of Chemistry, University of Zürich, Winterthurerstrasse 190, CH-8057 Zürich, Switzerland

bDepartment of Chemistry, University of Fribourg, Chemin du Musée 9, CH-1700 Fribourg, Switzerland. E-mail: fabio.zobi@unifr.ch; Fax: (+41) 026 300 9738;

Tel: (+41) 026 300 8785

cInstitute of Veterinary Physiology, University of Zürich, Winterthurerstrasse 260, CH-8057 Zürich, Switzerland

Published in 'DOWRQ7UDQVDFWLRQV±

which should be cited to refer to this work.

http://doc.rero.ch

(2)

carbonyl Re complexes possess features which make them attractive as CORMs

24,25

and if appended to B12 are able to aid the di ff erentiation of embryonic stem cells into energetically- e ffi cient cardiomyocytes which may contribute to functional repair in progressive degenerative cardiac diseases.

26,27

In this contribution we report the synthesis and characterization of the above mentioned mixed CO/NO-releasing molecules and the cytoprotective e ff ects of the same tested on cultured 3T3 fibroblasts under conditions of ischemia – reperfusion mimick- ing settings. While all molecules show cytoprotection in our model, no significant enhanced synergistic e ff ects over the relative NORMs and CORMs building constituents were observed.

Results and discussion

Synthesis and characterization of compounds

With the long-term aim of applying the molecules in vivo, we selected as a biocompatible sca ff old for our chemistry, cyano- cobalamin. NO-releasing molecules (NORMs 1a, 2a and 3a, Scheme 1) were first obtained by N,N-carbonylditriazole (CDT) amide coupling of the desired macrocycle on the ribose 5 ′ -OH functionality, followed by NaNO

2

nitrosation to the corres- ponding N-nitrosamines. Overall, this procedure a ff ords reasonable yields, but the e ffi ciency of the reaction is rather poor, particularly in the case of hexacyclen. Specifically, we found that the critical synthetic step is the first amide coupling with typical isolated yield of ca. 70, 40 and 15%

for pyrazine, tetraazacyclodecane and hexacyclen respectively.

Conversely, nitrosation a ff ords complete conversion of the pre- cursors to species 1a, 2a and 3a. Mixed CO/NO-releasing

molecules (1b, 2b and 3b in Scheme 1) were finally isolated fol- lowing conjugation of the 17-electron cis-[Re(CO)

2

Br

4

]

2−

anion to the axial cyano group of derivatives 1a, 2a and 3a.

26

Coordi- nation of the organometallic species was confirmed by the hypsochromic shift of the ν CN stretching frequency (typical of these metal conjugates)

28–31

and the presence of characteristic ν CO bands in infrared spectra of 1b, 2b and 3b. Inductively coupled plasma/optical emission spectrometry further con- firmed the expected percentage concentration of rhenium in the species, calculated as the fraction of the weight of the samples.

All species were characterized by standard analytical tech- niques, including X-ray crystallography for 1 and 1a (see Fig. 1 and 2 respectively and ESI † for crystallographic details). Com- pound 1 crystallized in the P2

1

2

1

2

1

space group (typical for B12 species) and showed no significant structural di ff erences when compared to B12. Due to low di ff raction of the crystals, and the presence of 11 disordered H

2

O solvent molecules the R

1

value for this species is relatively high when compared to other B12-based solid-state structures (10.4% vs. 7 – 9% on average, see the Experimental section for further details). Com- pound 1a crystallized as a dimer in the P2

1

space group, a rare example of a vitamin B12 monomer whose solid state structure is not found in P2

1

2

1

2

1

(Fig. 2).

32–35

The pyrazine rings in both molecules of the unit cell were found to be disordered, prob- ably due to di ff erent conformations imposed by the high N – NO rotational barrier.

36,37

Interestingly, the NO bond lengths are di ff erent in the two molecules. These are 1.096 (13) and 1.217 (14) for atoms labelled N17 – O16 and N34 – O32 respectively in Fig. 2. This dimer may persist in solution as revealed by the splitting of the pyrazine resonances evidenced by

1

H-NMR spectroscopy (Fig. 2, ESI † ). In general, in comparison

Scheme 1 Synthetic procedure to mixed CO/NO-releasing molecules. Conditions are: (i) DMSO, CDT, 12 h, 60 °C followed by (ii) selected macro- cycle; (iii) AcOH, NaNO2, 2 h, RT; (iv) MeOH, [Et4N]2[Re(CO)2Br4], N2, 1 h, RT.

http://doc.rero.ch

(3)

with the free vitamin, the most significant feature observed in the

1

H-NMR spectra of these species, is a progressive shift to lower magnetic field of the ribose R4, R5a and R5b protons as a consequence of amide coupling of the heterocycles and their subsequent nitrosation. Furthermore, resonances of the heterocycles appear as broad signals which can be attributed to their fluxionality and possibly to tautomerization and inter- conversion of the anchoring nitrogen between its amide and imidic acid forms. To illustrate these features Fig. 3 shows the comparison of the

1

H-NMR spectra of B12, 2 and 3. The shifts of the ribose protons and the broad heterocycle resonances are clearly seen.

CO and NO releasing properties of 1a – 3a and 1b – 3b

The CO releasing profile of the cis-[Re(CO)

2

Br

4

]

2−

species were previously reported and herein confirmed for 1b, 2b and 3b (see the ESI † for a typical spectrum).

26,38

The nitric oxide releasing properties of molecules 1a, 2a and 3a were also evalu- ated via the well-known myoglobin assay.

39

The assay consists of monitoring via UV-visible spectroscopy the conversion of deoxy-myoglobin (deoxy-Mb) with a maximum absorption peak of the Q band at 560 nm, to carboxy-myoglobin (Mb-CO) or nitrosyl-myoglobin (Mb-NO) which show two absorption maxima in the 540 – 548 and 575 – 580 nm for the same band.

40

The reaction between deoxy-Mb and NO was initiated by adding a small aliquot of a freshly prepared concentrated aqueous solution of either 1a, 2a or 3a to a Mb solution in phosphate bu ff er (0.1 M, pH 7.4) previously treated with sodium dithionite

41

(final concentrations: 12 μ M deoxy-Mb and 50 μM for NORM ’ s). Incubation of the deoxy-Mb solution with 1a caused little spectroscopic change over a 5 h monitor- ing period, indicating that the molecule is a poor NO releaser.

However, when 2a or 3a was used in the same assay, the deoxy- Mb spectrum evolved with the expected spectral changes associated with NO release (Fig. 4). Under the experimental conditions Mb-NO concentration reached a maximum within

Fig. 2 X-ray structure (top) of compound 1awith thermal ellipsoids

drawn at 30% probability. Hydrogen atoms are omitted for clarity. Crys- tallographic details are summarized in the ESI.†1H-NMR (5.25–3.8 ppm, D2O, 298 K of (A) vitamin B12, (B) species1and (C) species1a. Peaks labeled Pz# refer to resonances of pyrazine, while R4, R5a and R5b are those of the ribose sugar (see the text further details).

Fig. 3 1H-NMR (5.25–3.8 ppm, D2O, 298 K) of (A) vitamin B12, (B) species2and (C) species 3. Signals enclosed in segmented boxes are those of 1,4,8,11-tetraazacyclotetradecane (tacd) and hexacyclen (hacd) respectively. Peaks labeled R4, R5a and R5b refer to resonances of the ribose sugar.

Fig. 1 X-ray structure of compound1with thermal ellipsoids drawn at 30% probability. Hydrogen atoms are omitted for clarity. Crystallo- graphic details are summarized in the ESI.†

http://doc.rero.ch

(4)

5 h of incubation. After this time, the two Mb-NO absorption maxima at 548 and 583 nm began to steadily decrease while peaks at 505 and 630 nm increased in intensity. The changes are associated with the conversion of Mb-NO to metmyoglobin (met-Mb), due to slow oxygen dissolution in the reaction medium.

In the presence of dioxygen, nitric oxide can catalyze the oxidation of Mb to met-Mb through the formation of a peroxy- nitrite derivative (referred to as met-Mb(OONO)).

42–44

This species is also generally assumed to be the first intermediate of the reaction between oxy-myoglobin (oxy-Mb) and NO. In order to understand if 2a-, 3a-derived NO could also elicit the spectroscopic changes linked to oxy-Mb to met-Mb conversion, a fresh solution of oxy-Mb was prepared according to the method of Bauer and Pacyna and incubated with the mole- cules.

45

As shown in Fig. 4 3a-derived NO provided a clean con- version between the two Mb species. In the presence of 3a, the

two absorption maxima of oxy-Mb at 542 and 579 nm steadily decreased over a 24 h period while the met-Mb peaks at 505 and 630 nm increased. A total of five isosbestic points at 350, 411, 478, 524 and 580 nm accompanied the conversion.

The total amount of NO released by 1a – 3a and 1b – 3b was determined by reductive gas-phase chemiluminescence detec- tion in PBS bu ff er and in cell culture medium overlaying the monolayer of 3T3 fibroblasts (data relative to 100 μ M solutions, see Table 1 and Fig. 5).

46,47

The method entails the oxidation of all NO

x

species in solution to NO

3

followed by its step-wise reduction to NO

2

and NO which is finally carried in a He flow and allowed to interact with O

3

in a reaction chamber. The ensuing reaction is then followed by light emission detected by a photomultiplier (see Experimental for further details). For species 1a – 3a in PBS, 3a released the highest total detectable amount of NO, ca. 7 μ M, while 1a and 2a released about half the same amount. Similar results were found in cell culture. In this case, however, the total amount of NO released by 2a and 3a was twice that determined in PBS (ca. 7 and 15 μ M respecti- vely) while it was constant for 1a. Thus, it appears that 2a and 3a are activated by cultured 3T3 fibroblast towards NO liber-

Fig. 4 Spectrum changes of a deoxy-Mb (top) and an oxy-Mb (bottom) solution (both 12μM) incubated with a 50μM solution of3aover a 24 h period (1 h intervals). Arrows indicate the relative spectroscopic vari- ations. Insets detail changes of the Q band. In the topfigure insert, the initial growth of Mb-NO (overca.5 h) is followed by its disappearance and conversion to met-Mb (over remaining 19 h). See the text for further details.

Table 1 Amount of nitric oxide released by1a–3aand1b–3b(100μM solutions) in PBS buffer and 3T3 cell culture after 30 h of incubation

PBS total (μM)

Cell culture total (μM)

1a 3.7 ± 0.4 4.1 ± 0.9

2a 3.2 ± 0.6 6.9 ± 0.5

3a 7.1 ± 1.1 14.9 ± 2.0

1b 3.9 ± 0.3 4.4 ± 0.8

2b 3.6 ± 0.7 7.7 ± 0.4

3b 8.7 ± 0.9 19.0 ± 1.8

Fig. 5 Reductive gas-phase chemiluminescence detection of NO released by 100μM solutions: of1a(),2a (●) and3a() in (A) PBS buffer ( pH 7.4) and (B) 3T3 cell culture and of1b(),2b(●) and3b() in (C) PBS buffer ( pH 7.4) and (D) 3T3 cell culture.

http://doc.rero.ch

(5)

ation, with relative total concentrations of released NO com- parable to other N-nitrosamine derivatives.

36,37

Mixed CO/NO molecules 1b – 3b released comparable amounts of NO, with 3b giving the highest total measured concentration of the gas (ca. 20 μ M, Table 1).

Cytoprotective properties of 1a – 3a and 1b – 3b

The cytoprotective properties of mixed CO/NO-releasing mole- cules 1b, 2b and 3b were tested in an ischemia – reperfusion model on the 3T3 fibroblast cell culture and compared to NORMs 1a, 2a and 3a and the CO-releasing molecule B12- ReCORM-2 (Fig. 6).

26

The latter a ff orded the pure CORM-only model for direct comparison to the species herein described.

Compounds were administered at reperfusion at a 30 μ M con- centration and responses of cells to metabolic depletion were measured after 48 h as reflected in the percentage of dead cells in the monolayer. Identical sets of experiments were per- formed with two sets of samples, one of which was treated with freshly-dissolved compounds (blue bars in Fig. 6) and the other with compounds, which were in aqueous solution for more than 50 h to release all the gaseous molecules (orange bars in Fig. 6). B12-ReCORM-2 was used to assess the possible additivity of NO and CO for protection from ischemia – reperfu- sion injury. As followed from Fig. 6, the number of dead cells reduced when cells were treated with any of gas-emitting com- pounds compared to that in the non-treated control (grey bar).

The protective e ff ect was lost when compounds were adminis- tered after they released the gases (orange bars). The presence of NO did not result in any additional protection than that pro- vided by B12-ReCORM-2 alone. In agreement with our previous findings,

48

protection accomplished by the combined CO/NO- releasing compounds was associated with prevention from de- attachment of 3T3 cells from the bottom of the petri-dish and

reduction of stress fiber formation. No other significant mor- phological changes could be observed in 3T3 cells treated with our compounds (Fig. 7). The lack of additional cytoprotective e ff ects of NO when applied along with CO suggests that both gases may share similar pathways of cytoprotection in our experimental settings.

49

Conclusions

In summary, we have presented in this contribution the syn- thesis and characterization of the first examples of mixed CO/

NO-releasing molecules based on N-nitrosamine-{cis-Re- [CO]

2

}

2+

cobalamin conjugates. The derivatives were shown to be able to release both gases, albeit NO in relatively small doses. When tested in an ischemia – reperfusion model on 3T3 fibroblast cell cultures, all species a ff orded cytoprotection but we found no significant enhanced synergistic e ff ects over the relative NORMs and CORMs alone. Despite the lack of enhanced cytoprotection exhibited by the mixed CO/NO-releas- ing molecules in the specific model we selected, we believe this new class of compounds may be possibly considered as alternative therapeutic agents along classical NORMs and CORMs.

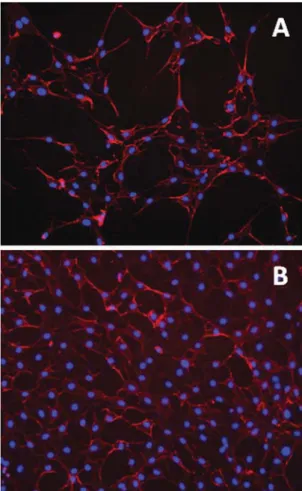
Fig. 7 (A) Representative histochemical staining of (A) untreated 3T3 fibroblasts (control) and (B) the cells treated with 30μM3b. Stained in blue (DAPI) are the nuclei, actinfilaments ( phalloidin) are shown in red.

Fig. 6 Effects of active (blue) and inactive (orange) B12 species1a,2a, 3aand1b,2b,3bon the viability offibroblasts in cell cultures under in an ischemia–reperfusion model. Non-treated control is shown in grey.

Data are means of 8 experiments ±SEM. B12 species concentration is 30μM; incubation time 48 h (see the ESI†for details). * and ** stand for p< 0.05 andp< 0.01 compared to the non-treated control.

http://doc.rero.ch

(6)

Experimental

Chemicals and solvents were purchased from standard sources. Chemicals were of reagent grade and used as pur- chased without further purification. Solvents were of reagent grade or distilled under anaerobic conditions. Water was doubly distilled before use. Reactions in a glove box were per- formed with solvents which were dried and deoxygenated by stirring and refluxing under a nitrogen atmosphere over the appropriate drying agent and, subsequently, distilled o ff . Degassed (not dried) solvents were prepared by freeze – thaw cycles or by sonication under vacuum. All synthetic work was carried out under a nitrogen atmosphere using standard Schlenk techniques. Experiments involving myoglobin and reactions where the CDT coupling was required were prepared in a glove box (Siemens MBraun Labmaster DP) with N

2

as a working gas and automatic oxygen and moisture purifier.

Reaction controls were conducted via HPLC (default gradient as described in method 1, vide infra).

Elemental analyses (EA) were performed on a Leco CHNS-932 elemental analyzer. For EA measurements, samples of the vitamin B12 species were purified via HPLC, lyophilized and subjected to high vacuum for 7 days. Often deviations from expected values were recorded. In these cases addition of vanadium pentoxide (V

2

O

5

) improved the results. UV-visible spectra were performed using a Cary 50 spectrometer, with 1 cm

3

quartz cells. Cuvettes were adapted with silicon septa lids which ensured that samples were maintained under an inert atmosphere. ESI-MS measurements were performed on a Bruker Esquire HCT (ESI) instrument. The solvent flow rate was 5 μ l min

−1

, a nebulizer pressure of 15 psi and a dry gas flow rate of 5 L min

−1

at a dry gas temperature of 300 °C were used. NMR spectra were recorded on Bruker AV2-400, AV2-500 and Bruker DRX-500 spectrometers (

1

H at 400 MHz and 500 MHz respectively). Chemical shifts are reported relative to residual solvent resonance. Inductively coupled plasma/optical emission spectrometry (ICP/OES) measurements were performed on a Perkin Elmer Optima 7300 V HF ICP-OES Spectrometer.

Analytical HPLC methods

Method 1. Hitachi LaChrom L-7000 instrument. Column:

Macherey-Nagel, EC250/3 Nucleosil 100-5 C18. Flow rate 0.5 mL min

−1

. Absorbance monitored at 250 nm. Solutions:

A: 0.1% trifluoroacetic acid in water; B: methanol. Chromato- graphic method: 0 – 5 min: isocratic flow of 75% A – 25%

B (A = TFA 0.1% in water; B = methanol); 5 – 40 min: linear gradient to 100% methanol. Method 2. Hitachi LaChrom L-7000 instrument. Column: Nucleodur 100-5 C18. Flow rate 0.5 mL min

−1

. Absorbance monitored at 250 nm. Solutions:

A: 0.1% trifluoroacetic acid in water; B: methanol. Chromato- graphic method: 0 – 5 min: isocratic flow of 90% A – 10% B;

5 – 35 min: linear gradient to 100% B; 35 – 40 min: isocratic flow of 100% B.

Preparative HPLC method

Preparative HPLC purifications were run either on a Varian Pro Star or a Hitachi LaChrom L-7000 instrument using a Nucleo- dur C18 Gravity column. Gradient used: A: 0.1% trifluoroacetic acid in water; B: methanol; flow rate = 30 ml min

−1

; 0 – 10 min 75% A, 10 – 110 min 25 – 100% B.

Crystal structure determination

X-ray analyses were performed at 183(2) K on an Agilent Technologies Xcalibur di ff ractometer with a Ruby detector

50

using a single wavelength Enhance X-ray source with Mo K α radiation ( λ = 0.71073 Å) from a micro-focus X-ray source and an Oxford Instruments Cryojet XL cooler. Suitable crystals were covered with oil (Infineum V8512, formerly known as Paratone N). Pre-experiment, data collection, data reduction and absorption correction were performed with the program suite CrysAlisPro.

51

Using Olex2,

52

the structures were solved with the ShelXS-97

53

structure solution program and refined with the SHELXL-2014/6

54

program package by full-matrix least-squares minimization on F

2

. Isolated solvent molecules could be identified around the main species but could not be included in the refinement cycles due to serious disorders.

With the use of the PLATON SQUEEZE tool,

55

their contri- bution was calculated as 432 electrons within the cell of 1 and attributed to 44 water molecules (11 molecules per asymmetric unit with Z = 4) and 522 electrons within the cell of 1a attribu- ted to 2 acetone molecules and 46 water molecules (1 and 23 solvent molecules per asymmetric unit with Z = 2, respectively).

CCDC-1054820 (for 1) and CCDC-1054821 (for 1a) contain the supplementary crystallographic data for this paper.

Synthesis of compounds 1 – 3

In a round-bottom flask cyanocobalamin (100 mg, 0.074 mmol) was dissolved in 1 – 5 ml of dry DMSO. A total of 25 mg of N,N-carbonylditriazole (CDT, 0.15 mmol) was added and the resulting mixture was heated to 60 °C for 12 h with constant stirring. The solution was allowed to cool to RT and then a total of 1 mmol of the heterocyclic compound of inter- est (i.e. pyrazine = pz, 1,4,8,11-tetraazacyclotetradecane = tacd and hexacyclen = hacd for 1, 2 and 3 respectively) was added.

The mixture was stirred for 12 h at RT and then slowly added to a rapidly stirring mixture of 150 mL 1 : 1 diethyl ether : chloroform. The red precipitate was collected by vacuum fil- tration, washed with 30 mL of acetone and vacuum dried. The resulting red powder was then purified by preparative HPLC.

Note : for the synthesis of 3, best results are obtained by using 1 ml of dry DMSO.

Analytical data for 1: yield 89 mg, 76%. HPLC (method 1):

retention time 14.9 min. ESI-MS analysis ( positive mode) m/z = 1467.1 [M

+

].

1

H NMR (400 MHz, D

2

O) δ /ppm = (a) (B12 reso- nances) 0.36 (s, 3H), 1.09 (s, 3H), 1.16 (d, 3H), 1.29 (s, 3H), 1.31 (s, 3H), 1.34 (s, 3H), 1.76 (s, 3H), 2.15 (d, 6H), 2.45 (s, 3H), 2.48 (s, 3H), 1.00 – 4.26 (m ’ s, 31H), 4.52 (d, 1H), 4.87 – 4.76 (m, 3H), 5.98 (s, 1H), 6.23 (d, 1H), 6.41 (s, 1H), 6.99 (s, 1H), 7.15 (s, 1H);

(b) ( pz resonances) broad overlapped signals 3.71 – 3.23

http://doc.rero.ch

(7)

(m, 20H). I.r. (solid state, KBr, cm

−1

): ν

CuN

2134. Elemental Anal. Calcd for C

68

H

96

CoN

16

O

15

P (1467.49), C 55.65%, H 6.59%, N 15.27%. Found: C 54.68%, H 6.76%, N 14.77%.

Single crystals suitable for X-ray di ff raction analysis were grown by slow di ff usion of acetone into an aqueous solution of 1.

Analytical data for 2: yield 50 mg, 46%. HPLC (method 1):

retention time 13.3 min. ESI-MS analysis ( positive mode) m/z = 1582.4 [M + H

+

].

1

H NMR (500 MHz, MeOD) δ /ppm = (a) (B12 resonances) 0.42 (s, 3H), 1.17 (s, 3H), 1.23 (d, 3H), 1.34 (s, 3H), 1.36 (s, 3H), 1.43 (s, 3H), 1.86 (s, 3H), 2.26 (d, 6H), 2.51 (s, 3H), 2.56 (s, 3H), 1.00 – 2.63 (m ’ s, 24H), 3.64 (m, 4H), 4.11 (d, 1H), 4.55 – 4.20 (m, 6H), 6.05 (s, 1H), 6.32 (d, 1H), 6.57 (s, 1H), 7.07 (s, 1H), 7.22 (s, 1H); b) (tacd resonances) broad overlapped signals 3.45 – 3.10 (m ’ s, 20H). I.r. (solid state, KBr, cm

−1

): ν

CuN

2134. Elemental Anal. Calcd for C

74

H

110

CoN

18

O

15

P (1581.68), C 56.19%, H 7.01%, N 15.94%. Found: C 54.17%, H 7.26%, N 15.08%.

Analytical data for 3: yield 20 mg, 19%. HPLC (method 1):

retention time 13.7 min. ESI-MS analysis ( positive mode) m/z = 1639.9 [M + H

+

].

1

H NMR (500 MHz, D

2

O) δ /ppm = (a) (B12 resonances) 0.42 (s, 3H), 1.16 (s, 3H), 1.24 (d, 3H), 1.35 (s, 3H), 1.37 (s, 3H), 1.41 (s, 3H), 1.83 (s, 3H), 2.23 (s, 6H), 2.51 (s, 3H), 2.55 (s, 3H), 1.00 – 2.63 (m ’ s, 22H), 2.97 (dd, 1H), 3.16 (d, 1H), 3.29 (dt, 2H), 3.45 (m, 1H), 3.58 (dd, 1H), 3.71 (t, 2H), 3.97 (d, 1H), 4.17 – 4.07 (m, 3H), 4.30 (dd, 1H), 6.05 (s, 1H), 6.32 (d, 1H), 6.47 (s, 1H), 7.03 (s, 1H), 7.19 (s, 1H); (b) (edac resonances) broad overlapped signals 3.54 – 3.16 (m, 24H). I.r. (solid state, KBr, cm

−1

): ν

CuN

2134. Elemental Anal. Calcd for C

76

H

116

CoN

20

O

15

P (1639.77), C 55.67%, H 7.13%, N 17.08%.

Found: C 53.32%, H 7.30%, N 16.63%.

Synthesis of compounds 1a – 3a

The following general synthetic procedure was applied. In a round-bottom flask with a side arm 0.012 mmol of either 1, 3 or 5 were dissolved in 3 ml of acetic acid. A total of 100 mg of NaNO

2

(1.45 mmol) was added and the flask was sealed. NO gas began to evolve immediately. The mixture was stirred at room temperature for 2 hours and then the solution was dried under reduced pressure. The red solid was then purified by preparative HPLC. Caution: During the procedure an over- pressure builds inside the reaction vessel. All precautions should be taken to avoid possible explosions.

Analytical data for 1a: yield 13.7 mg, 71%. HPLC (method 2): retention time 20.4 min. ESI-MS analysis ( positive mode) m/z = 1519.0 [M + Na

+

].

1

H NMR (400 MHz, D

2

O) δ /ppm = (a) (B12 resonances) 0.63 (s, 3H), 1.37 (s, 3H), 1.42 (d, 3H), 1.57 (s, 3H), 1.58 (s, 3H), 1.61 (s, 3H), 2.04 (s, 3H), 2.44 (s, 6H), 2.71 (s, 3H), 2.74 (s, 3H), 1.14 – 4.46 (m ’ s, 32H), 4.50 (m, 2H), 5.06 (m, 1H), 6.23 (s, 1H), 6.47 (d, 1H), 6.69 (s, 1H), 7.28 (s, 1H), 7.43 (s, 1H); (b) ( pz resonances) broad signals 4.58 (m, 2H), 4.11 (m, 2H), 4.00 (broad, 2H), 3.83 (broad, 2H). I.r.

(solid state, KBr, cm

−1

): ν

CuN

2134. UV-Vis (nm, MeOH, ε : cm

−1

M

−1

): 360 (20 334), 397 (4882), 521 (6510), 545 (6533).

Elemental Anal. Calcd for C

68

H

93

CoN

17

O

16

P (1496.49), C 54.58%, H 6.40%, N 15.91%. Found: C 53.83%, H 6.64%,

N 15.52%. Single crystals suitable for X-ray di ff raction analysis were grown by slow di ff usion of acetone into an aqueous solu- tion of 1a.

Analytical data for 2a: yield 15.4 mg, 77%. HPLC (method 2): retention time 21.7 min. ESI-MS analysis ( positive mode) m/z = 1691.3 [M + Na

+

]. I.r. (solid state, KBr, cm

−1

): ν

CuN

2134.

UV-Vis (nm, MeOH, ε : cm

−1

M

−1

): 361 (19 050), 399 (3779), 519 (5635), 549 (6230). Elemental Anal. Calcd for C

74

H

107

CoN

21

O

18

P (1668.68), C 53.26%, H 6.46%, N 17.63%.

Found: C 51.04%, H 6.66%, N 17.05%.

Analytical data for 3a: yield 16 mg, 75%. HPLC (method 2):

retention time 14.6 min. ESI-MS analysis ( positive mode) m/z = 1806.8 [M + Na

+

]. I.r. (solid state, KBr, cm

−1

): ν

CuN

2134.

UV-Vis (nm, MeOH, ε : cm

−1

M

−1

): 361 (20 976), 400 (3238), 518 (5991), 548 (6721). Elemental Anal. Calcd for C

76

H

111

CoN

25

O

20

P (1784.76), C 51.14%, H 6.27%, N 19.62%.

Found: C 48.95%, H 6.52%, N 18.93%.

Contrary to that observed for 1, nitrosation of 2 and 3 gave derivatives (i.e. 2a and 3a) whose NMR spectra were severely complicated not only by the di ff erent conformations of the pending tacd and hacd but also from an equilibrium between the base-on/o ff forms of the vitamin (spectra not shown).

Despite our e ff orts, we could not unambiguously assign specific sets of resonances.

Synthesis of compounds 1b – 3b

The following general synthetic procedure was applied. In a round-bottom flask with a side arm 10 mg of either 1a, 2a or 3a and 10 mg of the [Et

4

N]

2

[Re(CO)

2

Br

4

] salt were added as solids under nitrogen.

24

A total of 6 ml of degassed methanol was added giving a dark purple solution, stirred and then the flask was lowered into an oil bath preheated to 50 °C. The temperature was maintained constant for 1 h and then lowered to 40 °C within 30 min. Heating was stopped and the solvent removed under reduced pressure. The resulting dark red powder was washed several times with CH

2

Cl

2

, acetone and then again with CH

2

Cl

2

until washings (containing a mixture of unreacted [Et

4

N]

2

[Re(CO)

2

Br

4

] and (Et

4

N)Br) were clear.

Analytical data for 1b: HPLC: retention time 30.5 min. I.r.

(solid state, KBr, cm

−1

): ν

CuO

1986, 1890; ν

CuN

2181.

HR-ESI-MS analysis ( positive mode) m/z Calcd = 1900.4171;

Found: 1900.4190. UV-Vis (nm, MeOH, ε : cm

−1

M

−1

): 360 (19 626), 400 (5487), 520 (6117), 545 (6158). Elemental Anal.

Calcd for C

71

H

99

Br

2

CoN

17

O

19

PRe (1930.57), C 44.17%, H 5.17%, N 12.33%. Found: C 46.29%, H 6.37%, N 11.57%.

ICP/OES measurements of Re content by relative weight: calcd 9.65; found 9.28 ± 0.12.

Analytical data for 2b: HPLC: retention time 32.7 min. I.r.

(solid state, KBr, cm

−1

): ν

CuO

1990, 1841; ν

CuN

2183.

HR-ESI-MS analysis ( positive mode) m/z Calcd = 2071.5055;

Found: 2071.5178. UV-Vis (nm, MeOH, ε : cm

−1

M

−1

): 361 (19 041), 403 (4550), 519 (5349), 550 (5957). Elemental Anal.

Calcd for C

77

H

111

Br

2

CoN

21

O

21

PRe (2102.76), C 43.98%, H 5.32%, N 13.99%. Found: C 45.89%, H 5.57%, N 12.46%.

http://doc.rero.ch

(8)

ICP/OES measurements of Re content by relative weight: calcd 8.86; found 8.36 ± 0.24.

Analytical data for 3b: HPLC (method 2): retention time 28.7 min. I.r. (solid state, KBr, cm

−1

): ν

CuO

1989, 1841;

ν

CuN

2183. HR-ESI-MS analysis ( positive mode) m/z Calcd = 2187.5390; Found: 2187.5388. UV-Vis (nm, MeOH, ε : cm

−1

M

−1

): 361 (20 556), 408 (4500), 517 (5556), 549 (6300). Ele- mental Anal. Calcd for C

79

H

115

Br

2

CoN

25

O

23

PRe (2218.83), C 42.76%, H 5.22%, N 15.78%. Found: C 44.25%, H 5.38%, N 14.69%. ICP/OES measurements of Re content by relative weight: calcd 8.39; found 8.08 ± 0.29.

NO detection in PBS bu ff er and the cell culture medium in contact with 3T3 cells

NIH stock solutions (1 mM) of 1a – 3a, and 1b – 3b were prepared in sterile phosphate bu ff er (PBS, pH 7.4) and added either to fresh PBS bu ff er, culture medium which had been previously in contact with cells, or cultured cells to a final concentration of 100 μ M. Aliquots (200 μ L) of the resulting solutions were sampled at 4, 9, 19 and 30 h. For all collections, the samples were filtered through a short C18 column after priming with methanol (1.5 ml), and washing with distilled water (2 ml).

The samples were passed through the column followed by 1 ml of PBS. Samples for each time point were prepared and handled in triplicates. Nitrite and nitrate assessments were performed as previously described.

47,48

Nitrate was quantitat- ively reduced to nitrite using Nitralyzer II kit (World Precision Instruments, Inc.) in which copper-coated cadmium bits were used for reduction. The samples (25, 50 or 100 μ l) were injected into a helium-gassed reducing Brown ’ s solution con- taining 1.62 g KI, 0.57 g I

2

, 15 ml HPLC-grade water and 202 ml acetic acid warmed to 85 °C. Calibration solutions were prepared containing 0, 50, 100, 150 or 200 nM of NaNO

2

dis- solved in distilled water. Nitrite was quantitatively reduced to NO when in Brown ’ s solution and carried in a Helium flow to the reaction chamber of CLD88 nitric oxide analyzer (Eco- Medics Switzerland) in which NO was allowed to interact with O

3

. The ensuing reaction was then followed by light emission detected by a photomultiplier. Final results obtained from samples dissolved in PBS were set as control while data obtained from the addition of 1a, 2a and 3a to the medium in contact with 3T3 cells were normalized to the data obtained from the fresh culture medium alone.

Cell culturing and experimentation conditions during metabolic depletion

Two batches of NIH 3T3 Swiss Albino Mouse Fibroblast cells (ECACC Catalogue number 85022108) were cultured for 4 or 5 passages in Dulbecco ’ s Modified Eagle Medium (DMEM) con- taining 5 mM glucose, 10% fetal calf serum (FCS), and penicillin − streptomycin at pH 7.4. About one million cells were plated per Petri dish of 4.5 cm

2

area and kept proliferat- ing to near confluence at 37 °C in the presence of 95% air and 5% CO

2

as described earlier (see e.g. ref. 17 and 28). All cell culture materials were purchased from Invitrogen (Invitrogen, Life Technologies, Paisley, UK).

The following protocol was used to mimic conditions of ischemia – reperfusion. Ischemia was imitated by placing the cells grown to 60 – 70% confluence and DMEM (GIBCO® Gluta- MAX ™ , Life Technologies, Paisley, UK) to the FCS-free glucose- deprived medium (Invitrogen, Life Technologies, Paisley, UK) and exposing them for 48 h to the atmosphere of 1% O

2

, 94.8% N

2

and 5% CO

2

in the incubator HeraCell 240, Heraeus.

Thereafter the starvation medium was replaced by the DMEM supplemented with 10% FCS and 5 mM glucose without or with B12 species (final concentration 30 μ M), which were either freshly-dissolved or pre-dissolved for 54 h. This simu- lated “ reperfusion ” period lasted for 12 h. Stock 30 mM solutions of B12 species 1a, 2a, 3a and 1b, 2b, 3b were prepared in PBS.

Cell viability was then assessed by means of fluorescent microscopy. To do so the cells were stained for 10 min with a mixture of 1 μ g mL

−1

Hoechst-33342 and 10 μ g mL

−1

propi- dium iodide (PI) (Invitrogen, Molecular Probes) in Ca

2+

/Mg

2+

- free PBS (Gibco, Life Technologies, Paisley, UK). Hoechst- 33342 (excitation and emission maxima of 360 and 450 nm, respectively, Invitrogen, Molecular Probes) is membrane-per- meable and stains the nuclei of all cells by binding to double- stranded nuclear DNA. Membrane-impermeable PI (excitation and emission maxima of 555 and 620 nm, respectively) inter- acts with DNA and RNA of cells with a ruptured plasma mem- brane termed here as “ dead ” . Fluorescent staining was recorded using the Axiovert 200-M fluorescent microscope and analyzed using MCID image analysis software. In each culture dish, cells were counted in 5 predetermined areas of 0.5 mm

2

, totalling 2.5 mm

2

per dish, three dishes tested for each con- dition. Experiments were repeated four times (two 3T3 cell batches, two passages (P4 and P5) each). Data in each experi- ment were normalized to the viability in non-treated control samples and expressed as the means ± SEM. Statistical analysis was performed using GraphPad Instat v.3, GraphPad Software Inc. Following the normality test one-way anova was used with the Dunnett-post-test in which all data were compared to the viability of cells in non-treated control.

Additional batches of cells exposed to ischemia – reperfusion protocol with or without the NO and CO releasing compounds were prepared for staining with 4 ′ ,6-diamidino-2-phenylindole (DAPI) dihydrochloride (0.5 mg ml

−1

) or phalloidin – rhod- amine (Sigma-Aldrich, 1 : 100 in PBS). Staining was performed after washing twice with PBS, fixation with 4% paraform- aldehyde, and permeabilization with 0.2% Triton X-100.

Acknowledgements

Financial support from the SNSF grant PP00P2_144700 is gratefully acknowledged.

Notes and references

1 S. H. Snyder, S. R. Ja ff rey and R. Zakhary, Brain Res. Rev., 1998, 26, 167 – 175.

http://doc.rero.ch

(9)

2 L. Xue, G. Farrugia, S. M. Miller, C. D. Ferris, S. H. Snyder and J. H. Szurszewski, Proc. Natl. Acad. Sci. U. S. A., 2000, 97, 1851 – 1855.

3 R. Foresti, J. E. Clark, C. J. Green and R. Motterlini, FASEB J., 1997, 11, 65 – 65.

4 R. Foresti, J. E. Clark, C. J. Green and R. Motterlini, J. Biol.

Chem., 1997, 272, 18411 – 18417.

5 M. J. Alcaraz, A. Habib, M. Lebret, C. Creminon, S. Levy- Toledano and J. Maclouf, Br. J. Pharmacol., 2000, 130, 57 – 64.

6 S. R. Thom, Y. A. Xu and H. Ischiropoulos, Chem. Res.

Toxicol., 1997, 10, 1023 – 1031.

7 M. Kajimura, R. Fukuda, R. M. Bateman, T. Yamamoto and M. Suematsu, Antioxid. Redox Signaling, 2010, 13, 157 – 192.

8 S. K. Choudhari, M. Chaudhary, S. Bagde, A. R. Gadbail and V. Joshi, World J. Surg. Oncol., 2013, 11.

9 L. Y. Chau, J. Biomed. Sci., 2015, 22.

10 P. Pacher, J. S. Beckman and L. Liaudet, Physiol. Rev., 2007, 87, 315 – 424.

11 S. W. Ryter, J. Alam and A. M. K. Choi, Physiol. Rev., 2006, 86, 583 – 650.

12 P. G. Wang, M. Xian, X. P. Tang, X. J. Wu, Z. Wen, T. W. Cai and A. J. Janczuk, Chem. Rev., 2002, 102, 1091 – 1134.

13 J. L. Burgaud, J. P. Ri ff aud and P. Del Soldato, Curr. Pharm.

Des., 2002, 8, 201 – 213.

14 L. J. Ignarro, C. Napoli and J. Loscalzo, Circ. Res., 2002, 90, 21 – 28.

15 C. C. Romao, W. A. Blattler, J. D. Seixas and G. J. L. Bernardes, Chem. Soc. Rev., 2012, 41, 3571 – 3583.

16 S. H. Heinemann, T. Hoshi, M. Westerhausen and A. Schiller, Chem. Commun., 2014, 50, 3644 – 3660.

17 B. E. Mann, Top. Organomet. Chem., 2010, 32, 247 – 285.

18 U. Schatzschneider, Br. J. Pharmacol., 2015, 172, 1638 – 1650.

19 F. Zobi, Future Med. Chem., 2013, 5, 175 – 188.

20 S. Garcia-Gallego and G. J. L. Bernardes, Angew. Chem., Int.

Ed., 2014, 53, 9712 – 9721.

21 R. Motterlini and L. E. Otterbein, Nat. Rev. Drug Discovery, 2010, 9, 728 – 724.

22 B. S. Zuckerbraun, T. R. Billiar, S. L. Otterbein, P. K. M. Kim, F. Liu, A. M. K. Choi, F. H. Bach and L. E. Otterbein, J. Exp. Med., 2003, 198, 1707 – 1716.

23 K. G. Raman, J. E. Barbato, E. Ifedigbo, B. A. Ozanich, M. S. Zenati, L. E. Otterbein and E. Tzeng, J. Cardiovasc.

Surg., 2006, 44, 151 – 158.

24 F. Zobi, L. Kromer, B. Spingler and R. Alberto, Inorg. Chem., 2009, 48, 8965 – 8970.

25 F. Zobi and O. Blacque, Dalton Trans., 2011, 40, 4994 – 5001.

26 F. Zobi, O. Blacque, R. A. Jacobs, M. C. Schaub and A. Y. Bogdanova, Dalton Trans., 2012, 41, 370 – 378.

27 H. B. Suliman, F. Zobi and C. A. Piantadosi, Antioxid. Redox Signaling, 2015, in press.

28 S. Kunze, F. Zobi, P. Kurz, B. Spingler and R. Alberto, Angew. Chem., Int. Ed., 2004, 43, 5025 – 5029.

29 S. Mundwiler, B. Spingler, P. Kurz, S. Kunze and R. Alberto, Chem. – Eur. J., 2005, 11, 4089 – 4095.

30 P. Ruiz-Sanchez, S. Mundwiler, A. Medina-Molner, B. Spingler and R. Alberto, J. Organomet. Chem., 2007, 692, 1358 – 1362.

31 P. Ruiz-Sanchez, S. Mundwiler, B. Spingler, N. R. Buan, J. C. Escalante-Semerena and R. Alberto, J. Biol. Inorg.

Chem., 2008, 13, 335 – 347.

32 S. N. Fedosov, M. Ruetz, K. Gruber, N. U. Fedosova and B. Krautler, Biochemistry, 2011, 50, 8090 – 8101.

33 S. Murtaza, M. Ruetz, K. Gruber and B. Krautler, Chem. – Eur. J., 2010, 16, 10984 – 10988.

34 K. L. Brown, S. F. Cheng, X. Zou, J. D. Zubkowski, E. J. Valente, L. Knapton and H. M. Marques, Inorg. Chem., 1997, 36, 3666 – 3675.

35 K. L. Brown, S. F. Cheng, J. D. Zubkowski and E. J. Valente, Inorg. Chem., 1996, 35, 3442 – 3446.

36 F. Karaki, Y. Kabasawa, T. Yanagimoto, N. Umeda, Firman, Y. Urano, T. Nagano, Y. Otani and T. Ohwada, Chem. – Eur.

J., 2012, 18, 1127 – 1141.

37 M. Miura, S. Sakamoto, K. Yamaguchi and T. Ohwada, Tetrahedron Lett., 2000, 41, 3637 – 3641.

38 F. Zobi, A. Degonda, M. C. Schaub and A. Y. Bogdanova, Inorg. Chem., 2010, 49, 7313 – 7322.

39 R. Motterlini, B. E. Mann, T. R. Johnson, J. E. Clark, R. Foresti and C. J. Green, Curr. Pharm. Des., 2003, 9, 2525 – 2539.

40 E. Antonini and M. Brunori, Hemoglobin and Myoglobin in Their Reactions with Ligands, North-Holland, Amsterdam, 1971.

41 S. McLean, B. E. Mann and R. K. Poole, Anal. Biochem., 2012, 427, 36 – 40.

42 K. J. Koebke, D. J. Pauly, L. Lerner, X. Liu and A. A. Pacheco, Inorg. Chem., 2013, 52, 7623 – 7632.

43 P. C. Ford and I. M. Lorkovic, Chem. Rev., 2002, 102, 993 – 1017.

44 J. Su and J. T. Groves, Inorg. Chem., 2010, 49, 6317 – 6329.

45 C. Bauer and B. Pacyna, Anal. Biochem., 1975, 65, 445 – 448.

46 U. Hendgen-Cotta, M. Grau, T. Rassaf, P. Gharini, M. Kelm and P. Kleinbongard, Methods Enzymol., 2008, 441, 295 – 315.

47 M. Grau, U. B. Hendgen-Cotta, P. Brouzos, C. Drexhage, T. Rassaf, T. Lauer, A. Dejam, M. Kelm and P. Kleinbongard, J. Chromatogr., B: Anal. Technol. Biomed. Life Sci., 2007, 851, 106 – 123.

48 F. Zobi, L. Quaroni, G. Santoro, T. Zlateva, O. Blacque, B. Sarafimov, M. C. Schaub and A. Y. Bogdanova, J. Med.

Chem., 2013, 56, 6719 – 6731.

49 H. Haugaa, H. Gomez, D. R. Maberry, A. Holder, O. Ogundele, A. M. B. Quintero, D. Escobar, T. I. Tonnessen, H. Airgood, C. Dezfulian, E. Kenny, S. Shiva, B. Zuckerbraun and M. R. Pinsky, Crit. Care, 2015, 19, 184 – 195.

50 Y. Agilent Technologies (formerly Oxford Di ff raction), Oxford- shire, England, 2012.

51 Agilent Technologies, Yarnton, Oxfordshire, England, Crys- AlisPro, 1.171.36.20 edn., 2012.

http://doc.rero.ch

(10)

52 O. V. Dolomanov, L. J. Bourhis, R. J. Gildea, J. A. K. Howard and H. Puschmann, J. Appl. Crystallogr., 2009, 42, 339 – 341.

53 G. M. Sheldrick, Acta Crystallogr., Sect. A: Fundam. Crystal- logr., 2008, 64, 112 – 122.

54 G. M. Sheldrick, Acta Crystallogr., Sect. A: Fundam. Crystal- logr., 2015, 71, 3 – 8.

55 A. L. Spek, Acta Crystallogr., Sect. C: Cryst. Struct. Commun., 2015, 71, 9 – 18.

http://doc.rero.ch

Figure

Fig. 3 1 H-NMR (5.25 – 3.8 ppm, D 2 O, 298 K) of (A) vitamin B12, (B) species 2 and (C) species 3
Fig. 4 Spectrum changes of a deoxy-Mb (top) and an oxy-Mb (bottom) solution (both 12 μ M) incubated with a 50 μ M solution of 3a over a 24 h period (1 h intervals)
Fig. 7 (A) Representative histochemical staining of (A) untreated 3T3 fi broblasts (control) and (B) the cells treated with 30 μ M 3b

Références

Documents relatifs

1993: Creation of an Integrated Breast Diseases Course Learning Needs, Learning Objectives, and Course Content The breast diseases integrated course was introduced in the 4th year

SETAC primarily focuses on the development of the science underlying LCA; the Inter- national Society of Industrial Ecology (ISIE) focuses on the scientific

Rate constants for these processes were measured over the 50 - 296 K temperature range using a Laval nozzle reactor coupled with pulsed laser photolysis to produce C(

As it is known that NO and NO* are photochemically linked through the reaction of nitric oxide with ozone and the photodissociation of NO, by the solar

In this paper, the algorithm will be applied to the power spectrum of time series provided by a VHF ST radar with the aim of estimating the shift between two different echoes

If we accept a model for the visual perception of objects that is rooted in sub- jective vision then in what way can we consider systems of digital visual- ization

En effet : (a) plusieurs types de sites d’adsorption, correspondant à des énergies d’adsorption différentes, peuvent coexister à la surface des agrégats ; (b) l’énergie