Publisher’s version / Version de l'éditeur:
Cold Regions Science and Technology, 131, pp. 1-9, 2016-08-11
READ THESE TERMS AND CONDITIONS CAREFULLY BEFORE USING THIS WEBSITE. https://nrc-publications.canada.ca/eng/copyright
Vous avez des questions? Nous pouvons vous aider. Pour communiquer directement avec un auteur, consultez la Questions? Contact the NRC Publications Archive team at
PublicationsArchive-ArchivesPublications@nrc-cnrc.gc.ca. If you wish to email the authors directly, please see the first page of the publication for their contact information.
NRC Publications Archive
Archives des publications du CNRC
This publication could be one of several versions: author’s original, accepted manuscript or the publisher’s version. / La version de cette publication peut être l’une des suivantes : la version prépublication de l’auteur, la version acceptée du manuscrit ou la version de l’éditeur.
For the publisher’s version, please access the DOI link below./ Pour consulter la version de l’éditeur, utilisez le lien DOI ci-dessous.
https://doi.org/10.1016/j.coldregions.2016.08.002
Access and use of this website and the material on it are subject to the Terms and Conditions set forth at New friction mechanisms revealed by ice crushing-friction tests on high-roughness surfaces
Gagnon, Robert E.
https://publications-cnrc.canada.ca/fra/droits
L’accès à ce site Web et l’utilisation de son contenu sont assujettis aux conditions présentées dans le site LISEZ CES CONDITIONS ATTENTIVEMENT AVANT D’UTILISER CE SITE WEB.
NRC Publications Record / Notice d'Archives des publications de CNRC: https://nrc-publications.canada.ca/eng/view/object/?id=aaeee823-1462-4c3a-a40b-1eb39f276c91 https://publications-cnrc.canada.ca/fra/voir/objet/?id=aaeee823-1462-4c3a-a40b-1eb39f276c91
New Friction Mechanisms Revealed by Ice Crushing-Friction
Tests on High-Roughness Surfaces
Robert E. Gagnon
Robert E. Gagnon
Ocean, Coastal and River Engineering National Research Council of Canada Box 12093, Station A
St. John’s, NL, A1B 3T5 Phone: 709-772-2475 FAX: 709-772-2462
Abstract
Ice crushing occurs to varying degrees in many situations including those that involve a sliding frictional component, such as in sports involving ice contact, ice interaction with bridges, piers, ship hulls, vehicle wheels, rock beds under glaciers and ice-on-ice sliding/crushing interaction within glaciers and extraterrestrial ice masses (on Saturn’s moon Enceladus). Here results of ice crushing-friction experiments on high-roughness surfaces with regular arrays of small prominences are presented. Friction coefficients were extraordinarily low and were proportional to the ratio of the tangential sliding rate and the normal crushing rate. The behaviors are explained by the melting and erosive action of a thin squeeze-film slurry layer of ice particles and liquid between the intact ice and the surfaces, the very low friction on flat surfaces attributable to the squeeze-film slurry layer, and the flow of the slurry through channels that developed between leeward-facing facets of the prominences and the moving ice.
The frictional behavior of ice has been studied in many contexts, such as in relation to cold-environment sports involving friction on sled runners 1, skate blades 2 and curling
rocks 3, in the automotive industry concerning rubber tire performance on ice 4, in
shipping regarding friction on hulls of icebreaking ships 5 and other vessels in cold
regions, in construction regarding the friction of moving ice on concrete 6 such as piers,
bridges and other fixed river and marine structures, in the movement of glaciers 7
regarding on-rock and on-ice friction, and even in relation to extraterrestrial ice-on-ice friction in tectonically active regions of the icy Saturnian moon Enceladus 8.
Over the past few decades ice crushing and indentation have also been studied intensively, mostly in relation to ice engineering associated with offshore oil and gas resources. The main characteristics of the ice behavior consistently recur during field and lab studies and at various scales 9. While ice friction in nature often involves some
degree of crushing, as in most of the cases above, only a few studies have been
conducted specifically on the topic of ice crushing friction where substantial crushing is an integral component 10. Here we present results from ice crushing-friction tests (e.g.
Fig. 1a, b, c, d), using novel apparatus (Fig. 2a), on high-roughness surfaces (Fig. 2b) that reveal new friction mechanisms where the friction coefficient depends on both the normal crushing rate and the lateral sliding rate, and is extraordinarily low.
Preliminary considerations
Consider an ice feature crushing against a surface where no lateral sliding of the ice feature is involved. Many studies 9, 11, 12 have shown that during the crushing there are
regions of relatively intact ice, small compared to the nominal contact area, in the contact zone that are surrounded by crushed ice which flows away from the intact zones (Fig. 3a). The peripheral crushed ice is essentially the debris of shattered spalls that have previously broken away from the intact hard zone. Thin section analysis from lab tests confirmed the intact nature of the ice 13 and thin and thick sections from the
Hobson’s Choice Ice Island indentation tests 14 showed similar features. The pressure on the intact ice zones (hard spots) is very high (30-70 MPa) and changes abruptly to low values (0-10 MPa) when crossing the boundary between intact ice and the crushed material at the perimeter. The high-pressure zones have been shown to be regions where a thin squeeze-film slurry layer of pressurized melt and ice particles is present between the intact ice and the surface (Fig. 3). The viscous flow of this slurry layer generates heat that accounts for the rapid melting component of the removal of ice from the hard zones during ice crushing. A similar process occurs at ice-on-ice contact 15 of
ice fragments in the surrounding crushed ice matrix as it flows away from the high-pressure zones.
We have surmised from various previous studies that the slurry layer thickness in the present tests is somewhere in the approximate range of 0.02 mm to 0.17 mm, and the liquid fraction of the layer is about 15%. The slurry layer may be thought of as a self-generating squeeze film that is powered by the energy supplied by the loading system that causes the ice crushing.
To explain how ice particles can be created and entrained in the flow we speculate that tiny liquid Tyndall melt figures nucleate at the surface of the ice that is in contact with the pressurized slurry layer (similar to that observed by Gagnon et al. [16]) and extend to a small depth in the ice during the rapid adiabatic increases in pressure that occur in ice during and between repetitive spalling events 13, 17. The Tyndall figures could etch a
fine texture of prominences on the ice surface that would break off, due to the shearing force of the flowing slurry, and become entrained in the flow.
Test results and discussion
Fig. 1a and b shows the vertical crushing load and horizontal sliding force for a typical test using the platen with the array of square columns. The vertical crushing rate and horizontal sliding rate were both 10 mm/s. Fig. 1c shows a plot of friction force versus vertical crushing load for the test, where the linear fit to the data yields the friction coefficient. The R squared value for this fit is reasonably good. Generally, as is
common in ice crushing experiments, there was ice crushing-induced vibration in the apparatus that produced oscillatory scatter in the plots that lowered the R squared values (~ 0.6 on average), however the fits to the data still yield reliable friction coefficients since the oscillatory noise does not bias the data, as will be evident below in the consistency of the values for repeated tests.
Fig. 4a and b show the friction coefficient results for the tests conducted using the crushing platen with the array of pyramids. The relatively good consistency of repeated test results is evident. Noteworthy observations from Fig. 4a are: (1) The friction
coefficients are extraordinarily low given the high degree of roughness of the crushing platen. For comparison Fig. 4a includes two data points corresponding to two low-roughness unprepared flat steel plates, where each point represents the average friction coefficient value of two tests. (2) The friction coefficient increases with the horizontal sliding speed for any given vertical crushing rate. For the data corresponding to the 10 mm/s vertical crushing rate the friction coefficient dependence on sliding speed is roughly fitted by a line. (3) The friction coefficient is constant for the tests conducted at a constant ratio of vertical crushing rate and sliding speed, e.g. where the vertical crushing rate and the horizontal sliding rate ratios are (10 mm/s : 10 mm/s), (20 mm/s : 20 mm/s), and (30 mm/s : 30 mm/s). (4) The slopes of the three fit lines on the chart for the pyramids platen diminish as the vertical crushing rate increases.
Most of the experiments were conducted using the platen with the array of pyramids. Some tests were performed using the platen with the array of square columns (Fig. 4a), including a few using columnar-grained freshwater ice that yielded very similar results (not included in Fig. 4a). The friction values and slope of the fitted line are greater than that for the platen with the pyramid array. This is due to the higher roughness value for the platen with the square columns (0.375 mm) as opposed to 0.075 mm for the
pyramids platen.
Fig. 5 shows five sets of two images from the high-speed image record (Supplementary Video 1) of a test using the crushing platen with the array of square columns. The view is through the transparent acrylic crushing platen and the grid of small square columns is apparent. The high-speed digital camera captured images at 500 images/s, however the figure shows five non-sequential pairs of images at 2.869 s, 2.943 s, 3.005 s, 3.073 s and 3.081 s where each of the first four pairs captures a single spalling event. We see a roughly centrally-located horizontally-elongated dark hard zone that consists of
relatively intact ice where the pressure is high. The relatively intact hard zone appears dark because a thin sheet of black plastic was placed between the actuator head and the ice holder so that the black sheet was visible through the translucent ice sample and ice holder in areas where there was no opaque crushed ice (the white material). As a
verification, a rough measurement of the pressure on the hard zone was obtained by estimating the area of a hard-zone piece (3.84x10⁻⁵ m2) that broke away during a
spalling event (Fig. 5, images at 3.005 s and 3.017 s) and using the associated drop in load (2.3 kN) as indicated on the load record in Fig. 1d, to calculate a pressure of ~ 53 MPa, assuming that the shattered spall could support 12% of what it formerly supported when intact 13. The elongated shape of the hard zone is due to the shape of the original
ice sample (a horizontal wedge) that provides confinement governed by its geometry 18.
The hard zone is surrounded by white material that consists of low-pressure (0-10 MPa) pulverized spall debris that is flowing away from the high-pressure region, generally extruding along the channels between the columns.
Small spalls intermittently break away from the hard-zone region at various locations along its elongated shape. Fig. 5 shows three of the more distinctive small spalling events (indicated by arrows) that occur over the period of time 2.869 s to 3.017 s. The small spalling events arise because the columns act as nucleation sites for fracture and spallation. For any given short time interval, at locations where a spall is not forming, the hard zone continues to expand in size, due to the increasing load from the vertical actuator movement, the broadening shape of the ice behind the platen/ice interface (Fig. 3a and b) and because the ice is being continuously removed from the interface through the melting and erosive action of the thin squeeze-film slurry layer. In the last pair of
images in Fig. 5, where no spalling events occurred, one can perceive the increase in vertical breadth of the hard zone between 3.081 s and 3.117 s. Ultimately, however, it is the spalls that determine the shape of the hard zone because spalls will eventually occur at every location on the hard zone several times over the course of the crushing test. Occasionally a single large spall that encompasses a significant portion (e.g. ½) of the hard zone breaks away (Fig. 5, images at 3.073 s and 3.081 s) and causes a substantial drop in load (Fig. 1d). That type of spalling event is what generally occurs when ice is crushed against a flat surface with no significant roughness 9, 13
The ice sample is sliding horizontally (to the right in the images) at the same rate (10 mm/s) as it is crushing vertically against the platen. During the time interval (~ 0.25 s) between the first and last image of Fig. 5 the ice sample has moved to the right, relative to the crushing platen, by about 2.5 mm. The same processes described above for the ice crushing against the platen in the vertical direction apply to the ice crushing horizontally against the vertical walls of square columns facing the encroaching ice. For the intact hard zone to move horizontally to the right the thin squeeze-film slurry layer must be effectively removing hard-zone ice that is contacting the vertical walls of the square columns.
Fig. 3b shows a 2D schematic depicting ice crushing against a surface with square columns. Fig. 3c shows a 3D view of a smaller portion of that shown in Fig. 3b, containing only one square column. Although most of the data presented here is for the case of the platen with the square pyramids, we focus on the platen with square columns in the illustrations and associated discussion because the geometry and discussion are easier to depict and follow. The principles at play that are inculcated in the discussion, however, are the same in both cases. As discussed above the ice/surface contact consists of relatively-intact centrally-located hard-zone ice that is surrounded by crushed ice, i.e. shattered spall debris, at the sides of the hard zone. Between the hard zone and the underlying surface, either at the flat base of the platen or a vertical wall of a square column, is the heat-generating thin squeeze-film slurry layer that melts and erodes hard-zone ice as it flows. The slurry wets the crushed ice in its vicinity wherever it exits the high-pressure zone. The squeeze-film slurry dissipates the majority of the actuator energy supplied to the system because the load is mostly borne on the hard-zone ice. Consequently the energy dissipation rate of the slurry is directly proportional to the rate of crushing on whatever surface the ice crushes against, i.e. at horizontal surfaces or vertical surfaces of the platen.
We have shown from the flow characteristics of the ice/liquid slurry, the geometry of the gaps that form at the leeward faces of the square columns, standard flow theory and the friction data that the following expressions hold:
Ffriction P – (ΔP/2 + Pcrush) 50 MPa – 50 MPa x (Amax– A)/ Amax (1)
Ffriction 1 – (Amax - (horizontal sliding speed) / (vertical crushing rate))/ Amax (2)
Where Ffriction is the net horizontal force on a square column, P (~ 55 MPa) is the slurry
(squeeze-film) pressure on the column face on which ice is encroaching, ΔP is the pressure drop of the flowing slurry in the gap, Pcrush (~ 5 MPa) is the pressure of the
crushed ice at the gap exits, Amax is a constant and A is the cross sectional area of the
gap. Equations (1) and (2) are essentially stating that the friction force (and friction coefficient) is directly proportional to the gap cross sectional area A, as is evident in Fig. 4b.
Qualitative aspects of the data presented in Fig. 4a are reflected in equation (2). If the vertical crushing rate increases for any particular horizontal sliding speed the friction force will decrease. For any particular vertical crushing rate the friction force increases in a roughly linear fashion as the horizontal sliding speed increases. If the vertical
crushing rate and horizontal sliding rate change by the same relative amount then the friction coefficient does not change. If we apply a fixed range of sliding speed (4.14 – 30 mm/s) to the range of vertical crushing rate, (10 - 30 mm/s), we will observe a decrease in the slope of friction coefficient vs sliding speed as the vertical crushing rate increases. This occurs because the increase in gap cross sectional area, and decrease in gap slurry pressure, over the sliding speed range is greater at the low end of the vertical crushing rate range (Δ area ≈ 1.3 mm2) than for the high end (Δ area ≈ 0.45 mm2
). Hence, the change in friction force over the sliding speed range, i.e. the slope of friction force vs sliding speed, is greater for the lower vertical crushing rate.
Equation (1) implies that the horizontal force on a single column cannot exceed ~ 50 MPa x the area of a column face (2 mm2), i.e. ~ 100 N. Hence, the contribution that a
unit area of the platen (Fig. 3c) can make to the total friction force over the whole contacted area is < 100 N. The geometry of Fig. 3b further implies that at (sliding speed) : (vertical crushing rate) ratios greater than 2 the slope of friction coefficient verses sliding speed diminishes because bottom portions of the encroached column faces will not experience high-pressure ice crushing since the gaps at the leeward faces will have stretched out to the right to encompass the bottom portions of adjacent encroached faces.
In hypothetical cases where a hard zone is wide, or not elongated, the gaps that are fully encompassed by hard-zone ice will experience much lower pressure gradients within the hard-zone coverage than gaps that have access to crushed ice at the periphery of the hard zone. Therefore higher exit pressures and lower flow rates through the gaps that are fully encompassed by hard-zone ice would be expected, and they would play a lesser role in creating the imbalance of slurry forces on forward and rear-facing column walls that ultimately generates a friction force. The gaps located at the periphery of the hard zone, however, will still be in the vicinity of low-pressure crushed ice that enables low exit pressures and high slurry flow rates through the gaps that creates a friction force. A large number of fully encompassed columns within the hard zone might still, as a group, contribute to the frictional force depending on the relative numbers of
peripheral and encompassed columns.
Conclusions
The generation and flow characteristics of a thin ice/liquid slurry layer with respect to the regular array of protrusions on the platen surfaces explains the low magnitudes and the trends in the friction data. On flat relatively smooth surfaces the squeeze-film slurry layer causes extremely low friction forces. Other solid materials may exhibit similar behaviours when crushed at high homologous temperatures.
These results have beneficial consequences for the potential use of scaled-up panels with arrays of protrusions 19 that could be used to reduce ice-induced vibration of
structures (e.g. offshore wind turbines and oil platforms) without causing undesirable high friction forces. Conversely, rough surfaces designed to have a high friction coefficient (e.g. anti-slip surfaces on wheels or tracks) may have unexpectedly low friction coefficients when ice is crushed against them. During earthquakes complex behaviors, including frictional melting, occur in fault regions 20, 21. Similar frictional
processes to those discussed here might occur at various scales at rough interfaces of faults where dissimilar segments with differing hardness and melting temperature interact. The flow of glaciers 7 may be influenced by the friction mechanisms described
here at the glacier bases where ice slides over uneven rock surfaces. It was noted that the flowing slurry layer served to clean corrosion from the surfaces of unprepared steel plates. There may be specialized cleaning applications of natural or prepared hard surfaces, with low or high degrees of roughness, where ice crushing and sliding across the surface would be effective.
The presence of a thin squeeze-film layer of ice/liquid slurry produced by ice crushing on flat aluminum and acrylic surfaces in this study specifically led to extremely low friction coefficients. This should be considered when attempting to explain the frictional behavior of skate blades 2, sled runners 1 and curling stones 3 where local crushing on
ice asperities and/or small-scale ice unevenness, and due to gouging/plowing, occurs. By the term ‘ice crushing’ we include the production of the thin squeeze-film slurry layer both during spalling events and in the time intervals between spalling events.
Methods
Setup and experiments
Fig. 2a show a photograph of the test setup where the ice, confined in a rigid holder, is pressed in the vertical direction at a fixed rate against a transparent acrylic crushing platen (2.5 cm thickness) in a testing frame. The crushing platen is backed by a
secondary polished acrylic support plate (5 cm in thickness). The ice holder is attached to the top face of a 2.5 cm thick metal plate. The plate has four commercial
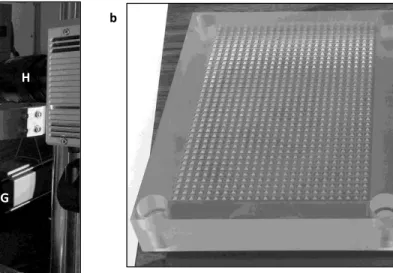
‘frictionless’ ball-bearing cars attached under it that ride on two metallic rails in the horizontal direction parallel to the long axes of the ice specimen and the crushing platen. An electric actuator is used to move the plate and ice holder at controllable fixed rates. High-speed images of the ice-platen contact region are recorded by viewing through both the support plate and the crushing platen by means of a mirror situated between the supporting posts for the plate and platen. Each of the two platens discussed here had either an array of small regular square pyramids machined onto its surface (Fig. 2b) or an array of square columns with the same base dimensions, height and spacing as the pyramids. The pyramids were 1 mm in height and 2 mm wide at the base.
The space between each adjacent pyramid was 2 mm. The arithmetic average of the high-roughness profiles for the surfaces of the two platens were 0.075 mm (square pyramids) and 0.375 mm (square columns).
Most of the ice samples were prepared from freshwater granular ice blocks grown in the lab (grain size ~ 4 mm). Some ice samples were prepared from a columnar-grained freshwater ice sheet grown in a basin (column diameter ~ 5 mm). During tests the columnar grains were orthogonal to the vertical crushing direction and the long axis of the ice sample. Each ice sample was approximately 7 cm in height, and 12 cm by 6.5 cm at its base. The top of the samples was given a rounded-wedge shape. Each sample’s base was freeze-bonded to an ice holder consisting of an acrylic plate with a rectangular band of steel (2 cm in height) attached to it that encompassed the base of the ice
specimen. The ~ 1 cm gap between the ice sample and the confining steel band was filled with snow and then saturated with water near 0 oC so that, when frozen, it
provided confinement at the base of the ice sample to prevent it from shattering during testing. Tests were carried out at –10 oC and the load data from the vertical crushing actuator and the lateral sliding actuator were acquired at 6144 samples per second. The vertical crushing rates used for these tests were 10, 20 and 30 mm/s. The horizontal sliding rates used were 4.14, 10, 12.42 and 20 and 30 mm/s. All ice samples were crushed to a depth of ~ 35 mm.
Clarifications regarding the friction force
Note that the ice crushing friction coefficient of a flat polished acrylic or aluminum surface is extremely low, virtually not resolvable with this apparatus, as indicated in the few tests that were conducted on flat acrylic and aluminum platens. Therefore we may ignore the contribution to the friction force that arises from ice crushing against the machined (near-polished) flat base of the platens in the areas between the square columns or square pyramids.
Also note that the wetted flowing crushed ice exiting normal to the long sides of the hard zone has negligible sheer strength and consequently does not oppose the sliding motion of the platen. At the ends of the elongated hard zone, however, the extruding crushed ice does apply a small compressive force against the square columns in its path but the associated force on a square column face is roughly ten times less than that applied to a column face by hard-zone ice since the hard zone can exert a pressure of roughly 55 MPa whereas the crushed ice may exert roughly 5 MPa. Furthermore, only a few square columns interact with crushed ice exiting at the right and left ends of the hard zone (Fig. 5) whereas many square columns interact with hard-zone ice over the whole contact area of the hard zone. Hence the contribution to the friction force from the crushed ice is negligible compared to that of the hard-zone ice.
Slurry layer details
Details of the thin layer have been the subject of investigation in a few studies. In one case the liquid portion of the layer through-thickness, amounting to about 21 microns during significant spalling events and 3 microns during time intervals between spalling events, was determined from electrical conductance measurements between two
conductors on the surface of an ice crushing platen 17. In another study, using very high
speed imaging (30,000 images/s), a direct visual estimate for the layer thickness (~ 0.17 mm) was obtained by measuring the thickness of a small thin plate of ice that formed at, and was ejected from, the periphery of a hard zone at high speed (15 m/s) during a significant spalling event in a crushing test 22. Hence, when comparing the liquid
fraction of the layer thickness during the spalling event from the electrical conductance measurement with the thickness from the direct measurements it is clear that ~ 11 % of the layer is liquid and the rest must consist of ice particles. Another piece of evidence that roughly fits this perspective is that if one estimates the amount of energy that is expended by the apparatus in removing the volume of hard-zone ice through the viscous flow of the thin squeeze-film slurry layer, as has been done by Gagnon [13], it is seen that there is enough energy during a spalling load drop to melt about 19% of the ice that is removed, implying that the layer through-thickness is about 19% liquid. Taking the average of this estimate and the former one determined from the conductance
measurement and visual observation we get 15% as the through-thickness fraction that is liquid during a spalling event. We can apply the same liquid-fraction ratio for the intervals between spalling events to obtain a slurry layer thickness of ~ 20 microns, since the liquid fraction is 3 microns. The information above gives a general view of the nature of the slurry layer during crushing for tests at a similar scale to that of the present ones. Hence, we can surmise that the slurry layer thickness in the present tests is
somewhere in the approximate range 0.02 mm and 0.17 mm, and the liquid fraction of the layer is about 15%. We may think of the slurry layer as a self-generating squeeze film that is powered by the energy supplied by the loading system that causes the ice crushing.
Gap formation and slurry flow effects
In Fig. 3b the ice crushes against the platen in the downward direction at a fixed rate and the ice is sliding horizontally to the right at a fixed rate. Since the actual movement of the ice relative to the platen is in the direction shown and since the ice is being melted and eroded on the tops of the square columns the shape of the ice in the space between two adjacent square columns will have a gap at the trailing left side, in the shape of a right wedge. The top angle of the right wedge is equal to the arctangent of the horizontal sliding speed divided by the vertical crushing rate. Hence the cross sectional area of the gap is proportional to the horizontal sliding speed divided by the vertical
crushing rate. The gap will be filled with flowing slurry since pressurized slurry will enter from the top of the square column and from the base of the platen in front of the gap, where the contacting hard-zone ice is melting/eroding, and will exit the gap at its sides where the pressure is lower, that is, in and out of the view of the figure. More detail on this is given below. In Fig. 3b the difference in pressure on the square column walls that face the oncoming ice and the lower pressure on the column walls on the leeward side of the oncoming ice, where the slurry-filled gaps are, accounts for the friction force. To give a better perspective of the gap, Fig. 3c shows a 3D view of a smaller portion of that shown in Fig. 3b, containing only one square column. This represents a unit area on the platen surface.
Fig. 3c is a simplified schematic of what in reality is a highly dynamic situation. We recall that during a crushing-friction test a typical hard zone grows in size for certain time intervals and also suddenly, and frequently, diminishes in size by small amounts whenever small spalls break away from it at various locations. Furthermore, the hard zone is quite mobile (Supplementary Video 1) in the vertical sense of Fig. 5 while remaining centrally located on average. In reality, due to these factors, the patterns and directions of flow of the pressurized slurry layer varies considerably both spatially and temporally, hence Fig. 3c represents a simplified time average of events. The slurry fluid flows out of the sides of the gap where pressure is low because there is frequently
low-pressure crushed ice in the immediate vicinity of one or both sides of the gap. This is due to the narrow width (a few times the width of a square column) and elongated shape of the high-pressure zones, as seen in Fig. 5. The average pressure the slurry exerts on the column face within the gap is roughly given by the exit pressure
(associated with the crushed ice) plus one half the pressure drop value within the gap.
In the time-averaged sense, the gap acts somewhat as a short length of pipe or channel through which slurry flows. The flow is driven by the ‘pressure drop’ along the length of the gap, remembering that crushed ice is present at the exit locations. However, the geometry in Fig. 3c is clearly more complex than that of a simple channel and we would not expect that standard theory for flow within a channel would apply. Indeed in the present case all we know is that fluid enters the gap (channel) from the top of the column and base of the platen and exits at the sides of the gap. A complicating factor is that the pressurized slurry is entering the gap (channel) along its whole length, a very different scenario from fluid entering one end of a channel and exiting at the other end. Similar to the latter case, according to standard theory for flow in a circular pipe
(Hagen-Poiseuille) the pressure drop within the pipe is inversely proportional to the square of the pipe’s cross sectional area and directly proportional to the volumetric flow rate. Although a pressure-drop dependence of some sort on gap cross sectional area would be expected in the present scenario, due to the complexities of the geometry and
flow entry characteristics the analytical derivation of an expression for the pressure drop as a function of the cross sectional area of the gap from first principles is beyond the scope of this work. Fortunately, however, all of the friction data in Fig. 4a for the platen with the square pyramids turns out to be proportional to the cross sectional area (A) of the gap (Fig. 4b), where A ≈ ½ (horizontal sliding speed)/(vertical crushing rate) mm2
. Of course, the same would apply for the platen with square columns. This implies that the volumetric flow rate through the gap in these tests is constant and that the average pressure the slurry exerts on the column face within the gap (i.e. the exit pressure plus one half the pressure-drop value) is proportional to a constant minus the cross sectional area of the gap. Hence, we may write a simple expression governed by the fluid
dynamics of the slurry flow within the gap that qualitatively explains the relationships and trends in the friction data shown in Fig. 4a. Recall that the frictional force that occurs on the surface of the platen arises from the imbalance of opposing forces on vertical walls of the square columns that face the encroaching ice and the opposite walls that are in the lee of the moving ice. To simplify matters we assume that the crushing load, and consequently the hard zone area, is constant. Therefore the number of square columns (n) in the hard zone region is fixed and the net friction force is given by n times the force on a single square column. For a single square column in the hard-zone area we have:
Ffriction P – (ΔP/2 + Pcrush) 50 MPa – 50 MPa x (Amax– A)/ Amax (1)
Where Ffriction is the net horizontal force on the square column, P (~ 55 MPa) is the
slurry (squeeze-film) pressure on the column face on which ice is encroaching, ΔP is the pressure drop of the flowing slurry in the gap, Pcrush (~ 5 MPa) is the pressure of the
crushed ice at the gap exits, Amax is a constant, and A is the cross sectional area of the
gap.
The production and flow rate of the slurry on horizontal and vertical surfaces of the platen is in general directly proportional to the crushing rate normal to the surfaces. For example, the data shows that if the vertical crushing rate, and consequently slurry production rate on horizontal surfaces, is a certain value then a certain relatively small fraction of the vertical crushing force (i.e. as indicated by the friction coefficient) will be required to slide the platen horizontally at a uniform speed facilitated by the melting and erosion of ice caused by the crushing-induced production and flow of slurry on the encroached columnar vertical wall faces. If both the vertical crushing rate and sliding rates are doubled then the slurry production rate is doubled on the horizontal surfaces of the platen and vertical walls of the columns, where the latter facilitates the sideways sliding at double the speed for the same fraction of the vertical load as before, that is, the friction coefficient does not change. Furthermore, since the average vertical
crushing load during the tests appeared to be independent of the vertical crushing rate we may say that if the vertical crushing rate doubles then the sliding rate will also double for the same sliding force applied in the former case. These points make intuitive sense if we consider the slurry layer produced at, and that flows between, the on-coming ice and the vertical face of a square column. Doubling the crushing rate and slurry flow rate at the vertical column face will double the amount of energy available per unit time to melt and erode the ice encroaching on the column face. This enables the ice to move against the column wall at double the rate for the same fraction of the vertical crushing load.
Since we know that the gap cross sectional area is directly proportional to the horizontal sliding speed divided by the vertical crushing rate equation (1) reduces to:
Ffriction 1 – (Amax - (horizontal sliding speed) / (vertical crushing rate))/ Amax (2)
Or more simply stated:
The earlier expression in equation (1) was formulated from the perspective of fluid flow through a channel, and how that leads to a friction force on the platen.
References
1. Poirier, L., Lozowski, E.P., Maw, S., Stefanyshyn, D.J. & Thompson, R.L.
Experimental analysis of ice friction in the sport of bobsleigh. Sports Engineering,
14(2), 67–72, (2011).
2. Lozowski, E., Szilder, K. & Maw, S. A model of ice friction for a speed skate blade.
Sports Engineering, 16(4), 239–253, (2013).
3. Maeno, N. Dynamics and curl ratio of a curling stone. Sports Engineering, 17(1), 33–41, (2014).
4. Klein-Paste, A. & Sinha, N.K. Comparison between rubber-ice and sand-ice friction and the effect of loose snow contamination. Tribology International , 43(5-6), 1145-1150, (2010).
5. Scarton, H.A. On the role of bow friction in icebreaking. Journal of Ship Research,
19(1), 34-39, (1975).
6. Møen, E., Høisetha, K.V., Leirab, B., & Høyland, K.V. Experimental study of concrete abrasion due to ice friction — Part I: Set-up, ice abrasion vs. material properties and exposure conditions. Cold Regions Science and Technology, 110, 183–201, (2015).
7. Cohen, D., Iverson, N. R., Hooyer, T. S., Fischer, U. H., Jackson, M. & Moore, P.L. Debris-bed friction of hard-bedded glaciers. Journal of Geophysical Research,
110 (F02007), 1-15, (2005).
8. Nimmo, F., Spencer, J. R., Pappalardo, R. T. & Mullen, M. E. Shear heating as the origin of the plumes and heat flux on Enceladus. Nature, 447(7142), 289–291, (2007).
9. Gagnon, R. E. Consistent observations of ice crushing in laboratory tests and field experiments covering three orders of magnitude in scale. Proceedings of POAC-99, 2, 858-869 (1999).
10. Gagnon, R.E. & Mǿlgaard, J. Crushing friction experiments on freshwater ice.
Proceedings of the IUTAM/IAHR Symposium on Ice/Structure Interaction, 405-421,
(1989).
11. Riska, K., Rantala, H. & Joensuu, A. Full scale observations of ship-ice contact.
Laboratory of Naval Architecture and Marine Engineering, Helsinki University of Technology, Report M-97, (1990).
12. Fransson, L., Olofsson, T. & Sandkvist, J. 1991. Observations of the failure process in ice blocks crushed by a flat indentor. Proceedings of the 11th International
Conference on Port and Ocean Engineering Under Arctic Conditions, 1, 501-514.
13. Gagnon, R.E. Generation of melt during crushing experiments on freshwater ice.
14. Gagnon, R.E. Analysis of visual data from medium scale indentation experiments at Hobson’s Choice Ice Island. Cold Regions Science and Technology, 28, 45-58, (1998).
15. Gagnon, R.E. High-speed imaging of ice-on-ice crushing. Proceedings of POAC
2013, Paper No. 159, (2013).
16. Gagnon, R.E., Tulk, C. & Kiefte, H. Internal melt figures in ice by rapid adiabatic compression. Journal of Glaciology, 40(134), 132-134, (1994).
17. Gagnon, R.E. Melt layer thickness measurements during crushing experiments on freshwater ice. Journal of Glaciology, 40 (134), 119-124 (1994).
18. Spencer, P.A. & Masterson, D.M. A geometrical model for pressure aspect-ratio effects in ice-structure interaction. Proceedings of OMAE 1993, 4, 113-117, (1993). 19. Gagnon, R.E. Large scale spallation inducing ice protection. US Patent 9,181,670
B2, Nov. 10, (2015).
20. Di Toro, G., Hirose, T., Nielsen, S., Pennacchioni, G. & Shimamoto, T. Natural and Experimental Evidence of Melt Lubrication of Faults During Earthquakes. Science,
311(5761), 647-649, (2006).
21. Lavallée,Y., Hirose, T., Kendrick, J.E., Hess, K. & Dingwell, D.B. Fault rheology beyond frictional melting. PNAS, 112(30), 9276-9280, (2015).
22. Gagnon, R.E. Liquid/solid jets from ice crushing experiments and implications for plumes on Enceladus. Proceedings of the XIIth International Symposium on the
Physics and Chemistry of Ice, 345-354, (2010).
Supplementary information
A video file (Supplementary Video 1) of a crushing-friction test has been included with the submission. The original images were acquired at 500 images/s using a high-speed imaging camera. The default playback rate for Supplementary Video 1 is 25 images/s.
Acknowledgements
The author would like to thank OCRE/NRC for its support of this research. The author is also grateful to Austin Bugden for technical assistance during the test program.
Author contribution statement
I (Robert Gagnon) am responsible for all the experimental techniques, data, analysis, discussion and conclusions presented here, and for the preparation of the manuscript.
Competing financial interests declaration
I (Robert Gagnon) declare that I have no competing interests as defined by Nature Publishing Group, or other interests that might be perceived to influence the results and/or discussion reported in this article.
Figure Legends
Figure 1. Data plots from a crushing-friction test using the platen with the array of square columns. (a) Vertical crushing load; (b) Horizontal sliding force; (c) Friction force versus crushing load for the time segment from ~ 1.0 s to 3.3 s; (d) A highly expanded view of the load record shown in Fig. 4a. The load drop associated with the spalling event (Fig. 5, images at 3.005 s and 3.017 s) that was used to obtain an estimate of the hard-zone pressure is indicated. Also indicated is the large spalling event shown in Fig. 5, images at 3.073 s and 3.081 s. The vertical crushing rate and horizontal sliding rate were both 10 mm/s. The test was conducted at –10 oC and the sample consisted of granular freshwater ice.
Figure 2. Test apparatus photographs. (a) Photograph of the crushing-friction test setup. (A) Vertically-oriented test-frame load cell for measuring the normal load; (B) Mirror; (C) Acrylic crushing-platen; (D) Ice specimen in ice holder; (E) Rail-car assembly; (F) Load cell used to measure the horizontal friction force; (G) Linear actuator used to slide the rail-car and ice sample horizontally; (H) High-speed imaging camera. (b)
Photograph of the acrylic platen with the array of small regular square pyramids on its surface (platen dimensions: 166 mm x 129 mm x 25 mm). The pyramids were 1 mm in height and 2 mm wide at the base. The space between each adjacent pyramid was 2 mm. The arithmetic average of the high-roughness profile for the surface of the platen was
0.075 mm.
Figure 3. Schematics showing aspects of the ice behavior during the crushing-friction experiments. (a) Schematic showing the essential characteristics of ice crushing against a flat rigid surface. (b) A 2D schematic depicting ice crushing against a platen surface with square columns. The ice has both a vertical and a horizontal component of
movement relative to the crushing platen, where the resultant movement is as indicated. (c) A 3D schematic showing a small portion, a unit area containing one square column, of the view of the ice and platen shown in Fig. 3b. The schematic depicts the time-averaged general flow characteristics of the self-generating squeeze-film slurry as it moves from high-pressure regions, where it is generated, into the lower-pressure gap space and eventually out through the gap exits where low-pressure crushed ice is present.
Figure 4. Main friction coefficient results for the tests using the crushing platen with the array of square pyramids. Tests corresponding to three vertical crushing rates and five horizontal sliding rates were conducted. The included data points corresponding to the tests conducted using the two flat steel plates represent averages of two tests in each case, where the vertical crushing rate and horizontal sliding speed were both set at 10 mm/s. Six data points are included from tests using the platen with square columns.
Scatter in the data, that is inherent in ice crushing and friction experiments, amounted to about ± 15% (s.d.). Granular ice was used for all these tests.
Figure 5. Five sets of two images from the high-speed image record (Supplementary Video 1) of a test using the crushing platen with the array of square columns. The view is through the transparent acrylic crushing platen. The grid of small square columns is apparent. Time stamps are included on the images. A horizontally-elongated dark hard zone that consists of relatively intact ice where the pressure is high is visible in each image. The hard zone is surrounded by crushed ice (the white material). The high-speed digital camera captured images at 500 images/s, however the figure shows four non-sequential pairs of images at 2.869 s, 2.943 s, 3.005 s and 3.073 s, where the first three pairs each capture a single small spalling event (indicated by arrows) and the fourth pair captures a large spalling event along the whole length of the hard zone. The fifth image pair (at 3.081 s) illustrates the growth of the hard zone during a time interval between two spalling events. The images in any pair are not sequential. The width of each image is ~133 mm.
0 10,000 20,000 30,000 40,000 50,000 0.5 1.0 1.5 2.0 2.5 3.0 3.5 V e rti ca l C ru sh in g L o a d ( N ) Time (s)
Large spall event
0 500 1,000 1,500 2,000 2,500 0.5 1.0 1.5 2.0 2.5 3.0 3.5 H o ri zo n ta l F ri ct io n F o rc e (N ) Time (s) y = 0.0632x R² = 0.865 0 400 800 1,200 1,600 2,000 0 5,000 10,000 15,000 20,000 H o ri zo n ta l F ri ct io n F o rc e (N )
Vertical Crushing Load (N)
5,000 10,000 15,000 20,000 25,000 2.98 3.00 3.02 3.04 3.06 3.08 3.10 V er ti ca l C ru sh in g L o a d ( N ) Time (s)
Large spall event
Spall event used for pressure measurement
Figure 1. Data plots from a crushing-friction test using the platen with the array of square columns. (a) Vertical crushing load; (b) Horizontal friction force; (c) Friction force versus crushing load for the time segment from ~ 1.0 s to 3.3 s; (d) A highly expanded view of the load record shown in Fig. 1a. The load drop associated with the spalling event (Fig. 5, images at 3.005 s and 3.017 s) that was used to obtain an estimate of the hard-zone pressure is indicated. Also indicated is the large spalling event shown in Fig. 5, images at 3.073 s and 3.081 s. The vertical crushing rate and horizontal sliding rate were both 10 mm/s. The test was conducted at –10 oC and the sample consisted of granular freshwater ice.
a
d c
a A b B C D E F G H
Figure 2. Test apparatus photographs. (a) Photograph of the crushing-friction test setup. (A) Vertically-oriented test-frame load cell for measuring the normal load; (B) Mirror; (C) Acrylic crushing-platen; (D) Ice specimen in ice holder; (E) Rail-car assembly; (F) Load cell used to measure the horizontal friction force; (G) Linear actuator used to slide the rail-car and ice sample horizontally; (H) High-speed imaging camera. (b) Photograph of the acrylic platen with the array of small regular square pyramids on its surface (platen dimensions: 166 mm x 129 mm x 25 mm). The pyramids were 1 mm in height and 2 mm wide at the base. The space between each adjacent pyramid was 2 mm. The arithmetic average of the high-roughness profile for the surface of the platen was 0.075 mm.
a b A B G H c
Figure 3. Schematics showing aspects of the ice behavior during the crushing-friction experiments. (a) Schematic showing the essential characteristics of ice crushing against a flat rigid surface. (b) A 2D schematic depicting ice crushing against a platen surface with square columns. The ice has both a vertical and a horizontal component of movement relative to the crushing platen, where the resultant movement is as indicated. (c) A 3D schematic showing a small portion, a unit area containing one square column, of the view of the ice and platen shown in Fig. 3b. The schematic depicts the time-averaged general flow characteristics of the self-generating squeeze-film slurry as it moves from high-pressure regions, where it is generated, into the lower-pressure gap space and eventually out through the gap exits where low-pressure crushed ice is present.
Gap-exit flow to low-pressure region
Vertical ice movement
Square column
Platen Base
Platen sliding direction relative to ice Hard-zone ice
Squeeze-film slurry layer exerting high pressure on platen surface
Slurry flow lines
Low pressure slurry-filled gap
Slurry flow lines
Gap filled with ice/liquid slurry
Wet crushed ice (soft zone)
Intact ice (hard zone)
Horizontal ice movement
Vertical ice movement Resultant ice movement
Squeeze-film ice/liquid slurry layer
Crushing platen
1 mm
2 mm Vertical ice movement
Wet crushed ice (soft zone)
Intact ice (hard zone)
Squeeze-film ice/liquid slurry layer
Crushing platen Flow direction
B H y = 0.0072x + 0.0002 R² = 0.9547 y = 0.0035x - 0.0249 R² = 0.9234 y = 0.0023x - 0.0161 R² = 0.9798 y = 0.0045x + 0.0009 R² = 0.9703 0 0.04 0.08 0.12 0.16 0 5 10 15 20 25 30 35 Fric tion Coeff ic ie nt
Horizontal Sliding Speed (mm/s) Vertical Crushing Rate (Square Pyramids Platen)
10 mm/s (+) ; 20 mm/s (♦) ; 30 mm/s (X)
Square Columns Platen (10 mm/s) Flat Steel Plate 1
Flat Steel Plate 2
y = 0.0935x - 0.0032 R² = 0.9579 0 0.04 0.08 0.12 0.16 0 0.25 0.5 0.75 1 1.25 1.5 Fr ict ion Coe ffic ie n t
Gap Cross Sectional Area (sq. mm)
Figure 4. Main friction coefficient results for the tests using the crushing platen with the array of square pyramids. (a) Tests corresponding to three vertical crushing rates and five horizontal sliding rates were conducted. The included data points corresponding to the tests conducted using the two flat steel plates represent averages of two tests in each case, where the vertical crushing rate and horizontal sliding speed were both set at 10 mm/s. Six data points are included from tests using the platen with square columns. Scatter in the data, that is inherent in ice crushing and friction experiments, amounted to about ± 15% (s.d.). (b) Friction coefficient versus gap cross sectional area. Granular ice was used for all tests shown in this figure.
2.869 s 3.005 s 2.953 s 2.943 s 2.879 s 3.073 s 3.017 s 3.081 s 3.081 s 3.117 s
Figure 5. Five sets of two images from the high-speed image record (Supplementary Video 1) of a test using the crushing platen with the array of square columns. The view is through the transparent acrylic crushing platen. The grid of small square columns is apparent. Time stamps are included on the images. A horizontally-elongated dark hard zone that consists of relatively intact ice where the pressure is high is visible in each image. The hard zone is surrounded by crushed ice (the white material). The high-speed digital camera captured images at 500 images/s, however the figure shows four non-sequential pairs of images at 2.869 s, 2.943 s, 3.005 s and 3.073 s, where the first three pairs each capture a single small spalling event (indicated by arrows) and the fourth pair captures a large spalling event along the whole length of the hard zone. The fifth image pair (at 3.081 s) illustrates the growth of the hard zone during a time interval between two spalling events. The images