Publisher’s version / Version de l'éditeur:
Building and Environment, 44, 4, pp. 723-735, 2009-04-01
READ THESE TERMS AND CONDITIONS CAREFULLY BEFORE USING THIS WEBSITE.
https://nrc-publications.canada.ca/eng/copyright
Vous avez des questions? Nous pouvons vous aider. Pour communiquer directement avec un auteur, consultez la
première page de la revue dans laquelle son article a été publié afin de trouver ses coordonnées. Si vous n’arrivez pas à les repérer, communiquez avec nous à PublicationsArchive-ArchivesPublications@nrc-cnrc.gc.ca.
Questions? Contact the NRC Publications Archive team at
PublicationsArchive-ArchivesPublications@nrc-cnrc.gc.ca. If you wish to email the authors directly, please see the first page of the publication for their contact information.
NRC Publications Archive
Archives des publications du CNRC
This publication could be one of several versions: author’s original, accepted manuscript or the publisher’s version. / La version de cette publication peut être l’une des suivantes : la version prépublication de l’auteur, la version acceptée du manuscrit ou la version de l’éditeur.
For the publisher’s version, please access the DOI link below./ Pour consulter la version de l’éditeur, utilisez le lien DOI ci-dessous.
https://doi.org/10.1016/j.buildenv.2008.06.024
Access and use of this website and the material on it are subject to the Terms and Conditions set forth at
A novel approach to estimate the wind uplift resistance of roofing
systems
Baskaran, B. A.; Ko, S. K. P.; Molleti, S.
https://publications-cnrc.canada.ca/fra/droits
L’accès à ce site Web et l’utilisation de son contenu sont assujettis aux conditions présentées dans le site LISEZ CES CONDITIONS ATTENTIVEMENT AVANT D’UTILISER CE SITE WEB.
NRC Publications Record / Notice d'Archives des publications de CNRC:
https://nrc-publications.canada.ca/eng/view/object/?id=e9084f36-9a4b-4bc7-b0a8-13784017b41d https://publications-cnrc.canada.ca/fra/voir/objet/?id=e9084f36-9a4b-4bc7-b0a8-13784017b41dhttp://irc.nrc-cnrc.gc.ca
A nove l a pproa c h t o e st im a t e t he w ind uplift re sist a nc e of roofing
syst e m s
N R C C - 4 8 1 7 7
B a s k a r a n , B . A . ; K o , S . K . P . ; M o l l e t i , S .
2 0 0 9 - 0 4 - 0 1
A version of this document is published in / Une version de ce document se trouve dans: Building and Environment, v. 44, no.4, April 2009, pp. 723-735, DOI:
10.1016/j.buildenv.2008.06.024
A Novel Approach to Estimate the Wind Uplift Resistance of Roofing
Systems
Bas. A. Baskaran
Corresponding Author and Senior Research Officer
National Research Council, 1200 Montreal Road, Ottawa, ON, Canada, K1A OR6 Phone: 613-990-3616, Fax: 613-998-6802,Email:bas.baskaran@nrc.ca
Steven Kee Ping Ko, Technical Officer and Suda Molleti, Research Officer
Abstract
Roof wind design consist of three parts: determination of wind loads, evaluation of wind uplift resistance and correlating the resistance with the design load such that the resistance is higher than the load requirement. Wind uplift resistance of a system with its respective components is evaluated in laboratory testing. This paper presents a novel approach to estimate wind uplift resistance when components are substituted during field application. Wind dynamics, on a mechanically attached single ply roofing assembly, lift the membrane and cause fluttering, introducing stresses at the attachment locations. In such assemblies, the fastener deck interface is a critical design factor. First, by taking steel deck as a component this paper systematically characterize the various steel decks that are commonly used in low slope application. Second component, namely the fasteners and its engagement strength with deck have been quantified for variations of its design, size and sources. Based on this component characterization, fastener pullout resistance (FPR) is identified as a verification factor for system wind resistance estimation. When variations occur in the fastener-deck interface between the proposed and the existing configurations, the present research through case studies has proved that: “as long as the FPR of the
proposed configuration is higher than the existing configuration then wind uplift ratings can be
maintained”. This is valid as long as both the configurations have all the remaining roofing components
similar with comparable layout. Based on this verification, the study recommends that the testing lab should report the FPR along with the wind uplift resistance such that FPR can be used as a verification factor to accept design/field alternatives.
Key words
1.Introduction
Recent, natural wind hazard damages are dramatic, incurring losses of life and property around the world. Wind induced roof failure is one of the major contributors to insurance claims, and it is rising. Recently, members of the Roofing Committee on Weather Issues (RICOWI) completed two major wind investigation projects on Hurricane Charley and Katrina, documenting extensive factual data on roof damages, which once again proved that wind induced roof failures, is still a major concern [1] and [2].
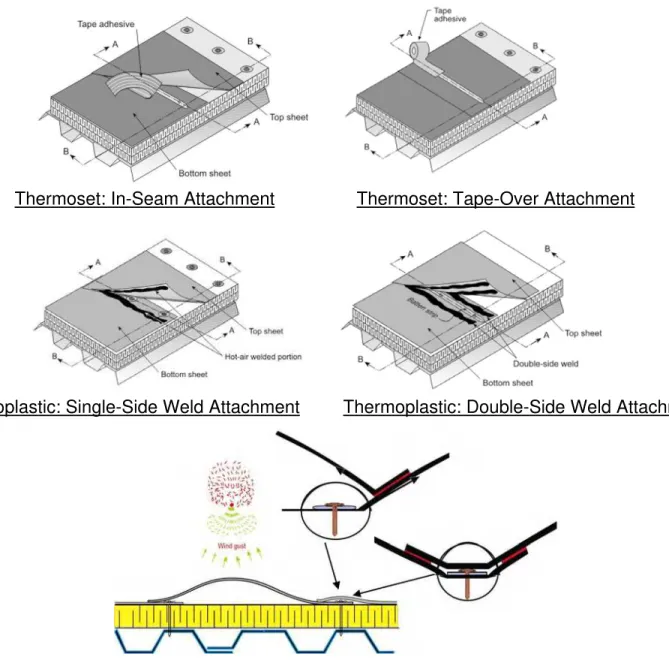
In North America over 50% of low slope applications are mechanically attached single-ply roof systems (MAS). Market survey indicates that there is continuous growth for the MAS. In MAS the waterproof membrane is attached to the deck using mechanical fasteners. Steel deck is commonly used as decking material for the MAS. Waterproofing membrane attachment mechanism varies depending on the type of membrane being used. Figure 1 illustrates the different modes of membrane attachments. MAS with thermoset membranes, the attachment can be done two ways: as inseam attachment or as topside (bar over) attachments. MAS with thermoplastic membranes, the attachment can be done either as one side weld or as double-side weld attachment.
Figure 1: Wind Induced Fastener Forces on Various Mechanically Attached Roofing System
The wind dynamics on MAS causes deflection of the membrane and thereby inducing tension in the membrane. This membrane tension is resisted by the fastener-deck attachment. The wind loading on the fastener can be asymmetrical as in spot - fastened systems or symmetrical as in bar-over attachment as shown in the Figure 1. When the fasteners are exposed to multi-directional wind forces, rotation and rocking occurs. These effects cause fatigue deformation on the metal deck. Ultimately, this prolonged fatigue weakens the deck fastener engagement and leads to a reduction in the fastener pullout resistance (FPR). When the resistance reaches below the design load requirement, failure occurs on the assembly [3].
This paper presents a novel approach to estimate wind uplift resistance when components are substituted during field application. In MAS, the fastener deck interface is a critical design factor. First, by taking steel deck as a component this paper systematically characterize the various steel decks that are commonly used in the low slope application. Second component, namely the fasteners and its engagement strength with deck have been quantified for variations of its design, size and sources. Based on this component characterization, fastener pullout resistance (FPR) is identified as a verification factor for system wind resistance estimation. Through case studies, it has been proved that: “as long as the FPR of the proposed
configuration is higher than the existing configuration then wind uplift ratings can be maintained”. Based
on this verification, the study recommends that the testing lab should report the FPR along with the wind uplift resistance such that FPR can be used as a verification factor to accept design/field alternatives.
2. Evaluation of Steel Deck Properties
The two common properties of steel deck that influences FPR are gauge / thickness and tensile strength. Steel decking is available in 22 and 20 gauge thickness at Grade 33 and 80. These grades represent the yield strength of the decks i.e. 33 ksi and 80 ksi. These are commonly used decks in low slope roofing applications. Present study through component evaluation, characterizes the physical and mechanical properties and compares them with published (nominal) values.
2.1 Experimental Setup and Data
The experiments were carried out as per the following three standards.
• ASTM E8-03 – Standard test methods for tension testing of metallic materials [4]
• ASTM A370-03a – Standard test methods and definitions of mechanical testing of steel products [5]
• ASTM A653/A 652M-03–Standard specifications for steel sheet, zinc coated (galvanized) or zinc-iron-alloy-coated (galvannealed) by the hot-dip process [6]
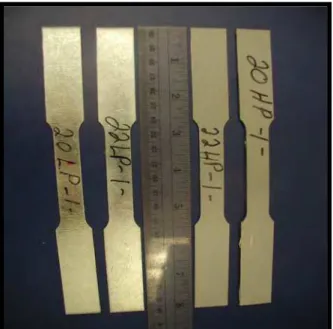
As shown in Figure 2, the steel deck coupons in the shape of dog-bone with dimensions of 18” x 3/4” (203 mm x 19 mm) having a middle tapering section of 1/2” (13 mm) were cut from the male flutes (top flange) of the steel decks. Ten coupons for each of the deck types, namely 22 Ga-33, 22 Ga-80, 20 Ga-33 and 20 Ga-80 was cut. All the four decks were obtained from the same manufacture.
Figure 2: Steel Deck Coupons for Property Evaluation
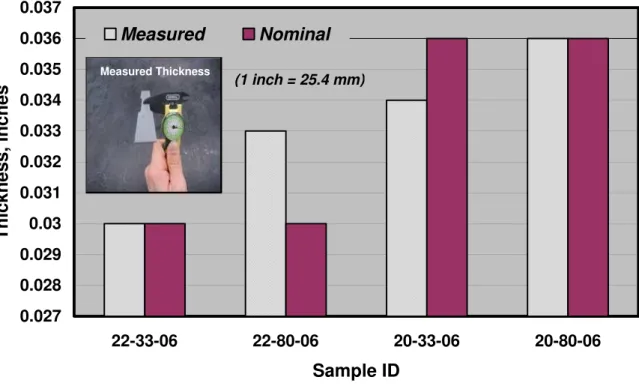
Gauge (thickness) of the steel deck coupons was measured using vernier calipers as shown in Figure 3. The vernier caliper had an accuracy of 0.01” (0.254 mm). Thickness measurements were made at three locations for each sample and the obtained values were averaged to obtain the mean thickness of the sample. Figure 3 presents the comparison between the averaged measured thickness and the nominal (published) thickness of the tested samples. As shown in the Figure 3, for the 22 Ga-33 and 20 Ga-80 the measured and the nominal thickness are similar. However, for the 22 Ga-80 the measured was 10% greater than the nominal and for 20 Ga –33, the measured was 6% lower than the nominal thickness.
Figure 3: Measured vs. Nominal thickness of the Steel Decks
Strength is a general term that refers to the capacity of the structure to resist loads. The common parameter with which the steel deck is referenced in the roofing industry is the yield strength. Yield strength is the magnitude of the load required to cause yielding in the deck or the maximum stress (force/area) that can be applied without permanent deformation of the steel deck. In other words, it is the limit strength on the stress-strain curve, i.e., the stress level at which the linear portion of the curve ends. The yield strength is different from the ultimate strength, which represents the ultimate load or failure load. Present practices use the yield strength to represent the tensile strength. To demonstrate the differences, the tensile strength of the above four steel deck types were evaluated and compared with the published (nominal) values.
Steel deck coupons, as shown in Figure 4, were subjected to tensile stress using INSTRON Model 4502 machine. As shown, ends of the coupon having wider widths were gripped on the top and bottom grips of the computer - controlled INSTRON. The bottom jaw is fixed. The movable top jaw applies a force at the rate of 674 lbf/min (3000 N/min). While the experiment is running, the software records the stress vs. strain curve. At the completion of the test, data were stored in an ASCII file for further analysis.
Figure 4 also shows two typical stress-strain curves obtained from the tensile testing of the two deck types. Clear differentiation can be observed from the stress-strain plots between the Grade 33 and Grade 80 decks. In the case of the Grade 33 deck, the stress-strain plot has three distinctive characters identified as: yield strength, ultimate tensile strength and fracture/failure point. The yield point is followed by large plastic strains. This is an important characteristic of structural steel. It is used to classify the steel deck as ductile or brittle. This phenomenon of ductility can be observed from the failure coupons of Grade 33 decks also shown in the Figure 4, where the narrow region of the coupon has been stretched/necked that resulted in the reduction of the area of the coupon. However, in the case of the Grade 80 decks, this pronounced differentiation between the yield strength and ultimate strength is not observed. The reduction in area in the narrow region of the coupon is insignificant and the failure happened close to the tapering section of the narrow part of the coupon. It failed very abruptly without any prior warning. This failure mode was quite contrary as compared to Grade 33 deck coupons. To determine the yield point of the Grade 80 deck, as suggested in [18], the theory of 0.2% offset yield point was applied. The yield stresses thus calculated were around 80 ksi for different coupons. Comparing the physical properties between the two deck grades, the Grade 80 deck has very high yield stress as shown on the Y-axis (80 ksi vs 45 ksi) and relatively low values of strain (3.5% vs 30%) as shown on the X-axis. This comparison clearly indicates that the Grade 80 decks are not as ductile as the Grade 33 decks.
Figure 4: Yield Strength Measurement of Steel Decks
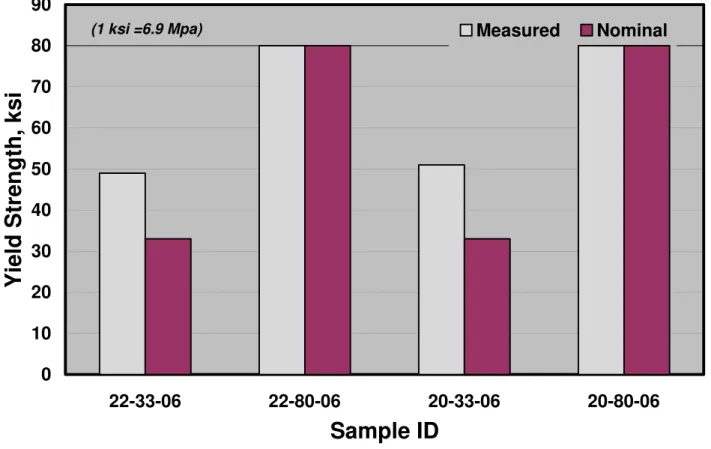
The yield strength measured from the 10 coupons of each deck type has been averaged and the mean values of the yield strength are compared to their nominal (published) values as shown in Figure 5. The
nominal yield strength values of the Grade 33steel decks are lower than the measured data. In the case of the Grade 33 deck, the measure yield strength was on average 51% greater than their nominal value. For the Grade 80 deck, the measured yield strength is almost similar to their nominal value.
Figure 5: Measured vs. Nominal Yield Strength of the Steel Decks
3. Evaluation of Fastener Pullout Resistance
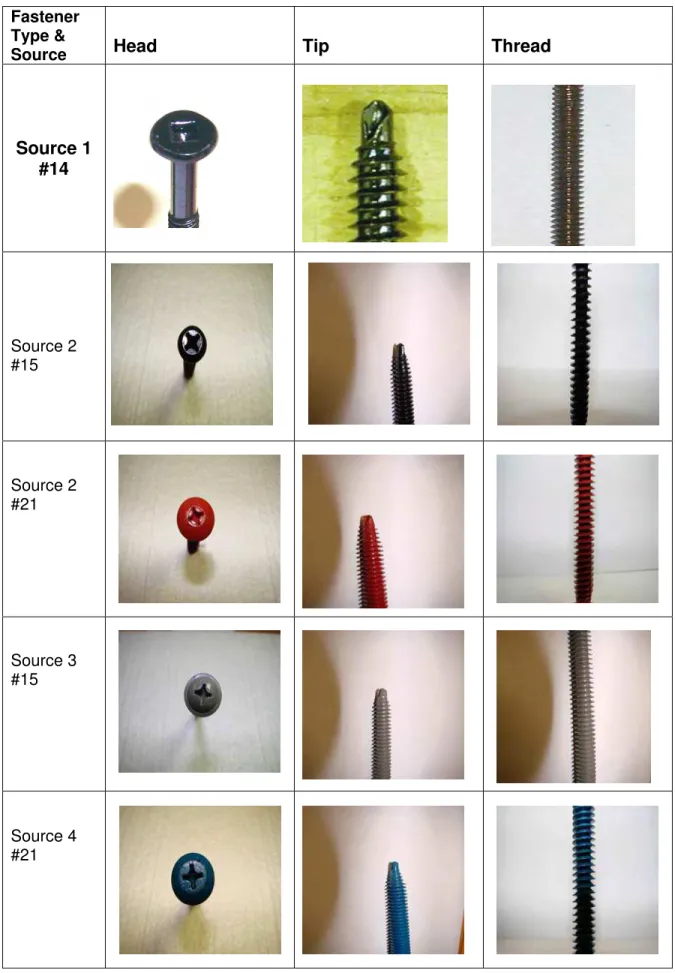
In MAS, membranes and insulations are attached to the steel deck using fasteners. The strength of fastener-deck interface is a very important parameter in the design of roofing assembly. To evaluate this interface three fastener sizes (#14, #15 and #21) are obtained from four sources (S1, S2, S3 and S4). Figure 6 presents the physical characteristics of the tested fasteners in terms of fastener head, tip and shank thread. For quick reference, the fastener-source combination can be named as #14-S1, #15-S2, #21-S2, #15-S3 and #21-S4
o #14-S1 had a thread diameter of 0.170” (4.37mm) and head diameter of 0.43” (11.0mm) o #15-S2 had a thread diameter of 0.281” (7.13mm) and head diameter of 0.44” (11.2mm) o #15-S3 had a thread diameter of 0.261” (6.62mm) and head diameter of 0.44” (11.2mm) o #21-S2 had a thread diameter of 0.331” (8.41mm) and head diameter of 0.66” (16.8mm) o #21-S4 had a thread diameter of 0.332” (8.43mm) and head diameter of 0.67” (16.9mm)
As shown in the Figure 6, differences exist among the fasteners in the head, thread, and tip design that could contribute to the pullout resistance. Closer examination reveals the differences among the fasteners’ thread design, namely distance between the thread and its angle to the shank. This observation is not only true for different fastener sizes and also valid for the same fastener size from different sources.
Figure 6: Physical Characteristics of the Tested Fasteners
3.1 Experimental Setup and Data
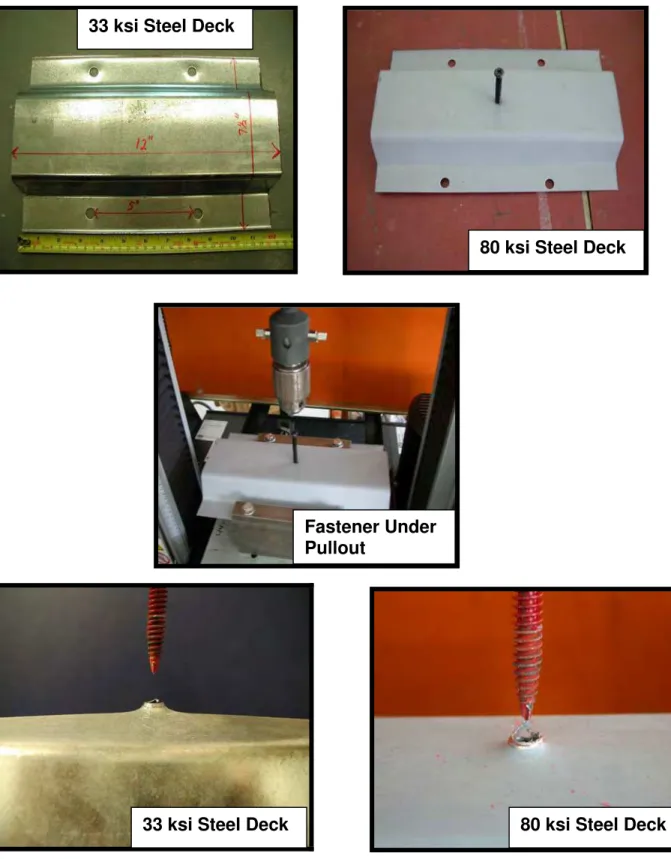
To quantify the FPR, experiments were carried out as per the “ANSI/SPRI FX-1” [7]. Steel deck samples were prepared by cutting the decks in dimensions of 7.5” (191 mm) in width and 12” (305 mm) in length as
shown in Figure 7. It was necessary to use these dimensions, since samples tested with shorter lengths 3.5” by 6” and 6” x 6” (89 by 152 mm and 152 by 152 mm) provided inaccurate results owing to excessive sheet deformation. On the other hand, samples tested with 12” by 12” (305 by 305 mm) do not affect the pull out resistance of the fasteners. The fasteners were centered with respect to length and installed with a minimum penetration depth of ¾” (19 mm) to a maximum depth of 1” (25mm). Testing was carried out on INSTRON Model 4502. To accommodate the samples in the INSTRON a steel attachment base was designed and the sample was held down along its female ribs through the predrilled holes. With the sample in position, a constant upward force was applied by pulling the fastener at a speed of 2”/min (51 mm/min). All the samples were tested following the same procedure. While the experiment is running, the software records the load vs. displacement curve in kilograms and millimeters. At the completion of the test, data were stored in an ASCII file for further analysis.
Figure 7: Experimental Setup for Fastener Pullout Measurements
Figure 7 also shows conditions of 22 Ga-33 and 80 decks after the pull out of # 21 fasteners. In the case of grade 33 decks, the fastener was gradually pulled out of the deck causing sheet deformation along the fastener's perimeter or area of influence in a conical shape as shown in Figure 7. The sheet deformation around the fastener was approximately 0.15” (4 mm) vertically. However in the grade 80 decks, the fastener pulled out with a small conical deformation around the fastener’s perimeter without any sheet deformation of the deck. This was the same trend observed for all the tested fastener types when tested on grade 33 and 80 decks. This phenomenon of sheet deformation in grade 33 decks can be related to their ductility property as discussed in the section 2. Due to this ductile property, the fastener while pulling out pulls and stretches the steel deck along with it, which leads to the deformation of the steel deck. For the fasteners tested on grade 80 decks, the failure pattern was sudden and the fastener pulls out on a snap without deforming the steel deck.
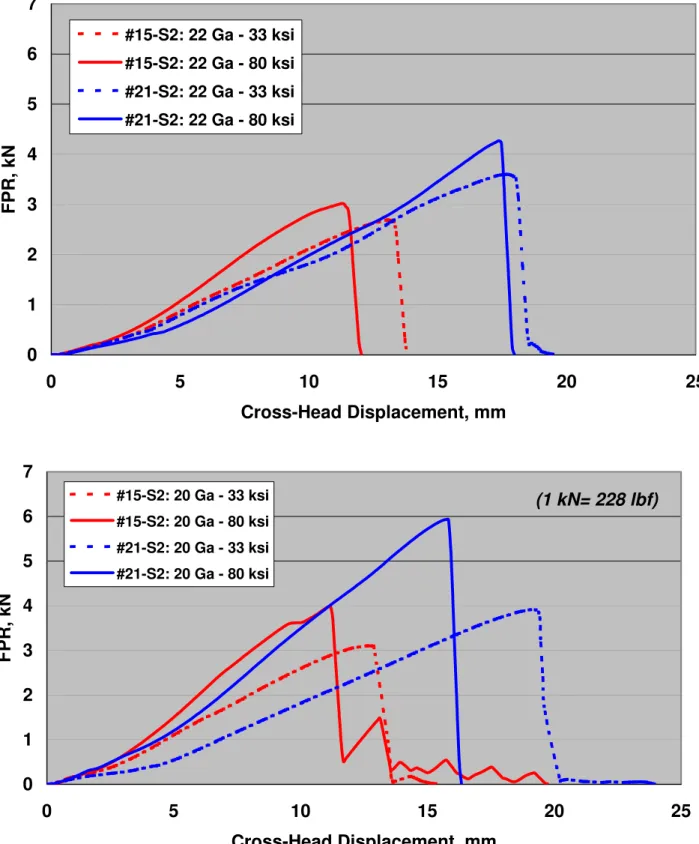
Figure 8 shows the typical load versus displacements recorded during the fastener pullout testing. The graph refers to results obtained from testing fasteners #15-S2 and #21-S2 on 22 33ksi and 22
Ga-80ksi steel decks. The dotted lines refer to the load-displacement curves on grade 33 decks and the solid lines refer to grade 80 decks. A quick inference that can be made from these load displacement curves is, irrespective of the fastener type, fastener pull out on grade 33 decks has lower load while fastener pullout on grade 80 decks has higher load.
Figure 8: Load versus displacements curves during the fastener pullout testing.
Average FPR along with deviation bars are shown in Figure 9. The plotted FPR data represents the average value of ten independent pullout tests for each fastener-deck combination. The standard deviations are also calculated and shown in the figure. From the plotted graph the following observations are noted:
• Irrespective of the deck type and fastener source, fastener # 21 yields the highest FPR followed by #15 and #14 respectively, indicating that greater the thread diameter resulted in to higher fastener pullout resistance.
• Within the steel decks having same gauge the measured data indicates that higher FPR is obtained on higher yield strength decks. For example, #15-S2 fasteners showed an increase of 60% in pullout resistance when engaged with 22 Ga-80 decks compared to 22 Ga-33 decks. This was the same trend for all the other cases with the variation in magnitude from one fastener-deck combination to the other.
• The effect of deck gauge on FPR is very clear for the grade 33 decks, where the data indicated that by increasing the deck thickness one could obtain higher FPR. For example, #14-S1 showed an increase of 15% from 22 Ga-33 to 20 Ga-33, while # 15-S2 and #21-S2 measured an increase of 21%, and #15-S3 and #21-S4 showed an increase of 12% respectively.
• Similar trend in the FPR is also observed in the case of the grade 80 decks with a maximum increase of 30%.
• Within the same fastener type but from two different sources there was marked difference in the measured FPR values. For example, fastener #21 was obtained from S2 and S4. The measured
FPR values on 22-80 decks indicate that #21-S2 measured 15% higher than #21-S4. Though both these fasteners have industry classification of #21 the tip designs of these fasteners are quite different as shown in Figure 6, which could be the reason for this variation in the FPR values. Similarly, the #15 fasteners obtained from S2 and S3 had different dimensional characteristics especially the thread diameter and tip design. Fastener #15 from S2 has a greater thread diameter (0.281”) when compared to S3 (0.261”), which could be the contributing factor for measuring higher FPR values with #15-S2.
From the above discussion, one can conclude that the component evaluation data revealed that the FPR could vary when component type or component physical property or source varies.
Figure 9: Comparison of the Fastener Pullout Resistance for Different Deck Types
4. A Novel Approach to Verify System Wind Uplift Performance
Section 2 of this paper documented the variation in deck properties by comparing the nominal (published) values with the measured data. These comparisons considered four different decks that are commonly used in low slope application with mechanically attached roof assemblies. It concluded that irrespective of the deck types the measured data are always higher than the published values. Section 3, on the other hand, investigated the fastener pullout resistance (FPR). Three different fasteners from four different sources are considered that are commonly used in low slope application with mechanically attached roof assemblies. It concluded that higher the fastener shank diameter higher the FPR. This is true irrespective of the deck types.
These component investigations provided valuable data, however they are limited when one wants to quantify their influence on system performance. These limitations can impact the wind uplift rating design of roof systems in several ways:
• It is rather challenging for a designer to account for similarities for all components between design and construction. As one can expect, the probabilities are high during the construction to substitute similar components.
• Normally, roof systems are tested in the lab conditions to obtain wind uplift rating [8] and [9]. However, during the field installation the deck type may be different from that of the one used in the lab. Question arises whether the deck difference between the field and lab will influence the wind uplift rating. If so, how much?
• Along the similar thought process, roof systems are tested in the lab with a particular fastener type, and situations in the field may warrant use of a different fastener type or fastener from different source or fasteners with different design. This can challenge the system supplier to justify that the wind uplift rating will not be compromised due to this change.
• Also, it would be not be economical for system suppliers to test for wind uplift rating each time when components are varied or substituted.
• The above discussions can get complicated in the case of re-roofing/recovering situations. Normally, only above deck components will be re-roofed/recovered by keeping the existing deck. How much the wind uplift rating is affected if the existing deck is not same as that of the tested ones? How one can avoid deck replacement at the same time maintain the similar wind uplift ratings? Also, in re-roofing there is a need to replace only certain segments of the degraded decks. Then also the above questions are equally valid.
Proposing a practical design solution that can account for these variations would be beneficial for the roofing community during the wind uplift design. Based on the extensive experimental research carried out at the Dynamic Roofing Facility (DRF) of the National Research Council of Canada, the present study identifies a single parameter, namely, the fastener pullout resistance (FPR) as a verification parameter when variations occur in the fastener-deck interface. If the components of the fastener-deck interface are varied, one should compare the FPR between the two sets. Through case studies, it has been proved that: “as long as the FPR of the proposed configuration is higher than the existing configuration then wind
roofing components similar with comparable layout. For example, a system is tested in a lab obtained a wind uplift rating of 60 psf (2.9 kPa). For this system, the FPR of the fastener-deck combination is 400 lbf (1760 N). During the field installation the deck is different from the one used in the lab. Nevertheless, the FPR of the field fastener-deck combination is higher than 400 lbf (1760 N). Then irrespective of the deck variation, the designer can expect similar wind uplift rating in the field. This has been demonstrated through case studies in the following section.
5. Proposal Validation Through Case Studies
Design Dilemma 1
• A roofing system tested at the DRF in accordance to the CSA A123.21-04 [10] obtained a wind uplift rating of 90 psf (4.3 kPa) as an indication of its wind uplift performance. Let the Lab System be referred as LS1.
• A building needs reroofing and based on the wind load calculation in accordance to the NBCC [11], it requires a system with a wind uplift rating of 90 psf (4.3 kPa).
• Manufacturer X proposes the LS1 as a viable option to meet the design requirement.
• When reviewing the lab report, the designer noticed that the LS1 was tested on 22 Ga-33 decks. However, the existing deck in the field has a 22 Ga-80 deck. This raises the question whether this variation in deck can affect the wind uplift rating. Let this Field System be referred as FS1.
Solution 1
• According to the present study’s practical solution, “as long as the FPR of the proposed
configuration is higher than the existing configuration then wind uplift ratings can be maintained”.
• Based on this design solution, the verification factor FPR was determined for the fastener-deck interface of the LS1 and FS1 in accordance to the ANSI/SPRI FX 1 [7]. LS1 yielded a FPR of 420 lbf (1820N). Where as the FPR of FS1 was 660 lbf (2900N).
• Even though, there is a variation in the deck type, the FPR of FS1 is higher than the LS1, therefore it is expected that wind uplift rating can be maintained between these two systems.
Validation Experiment 1
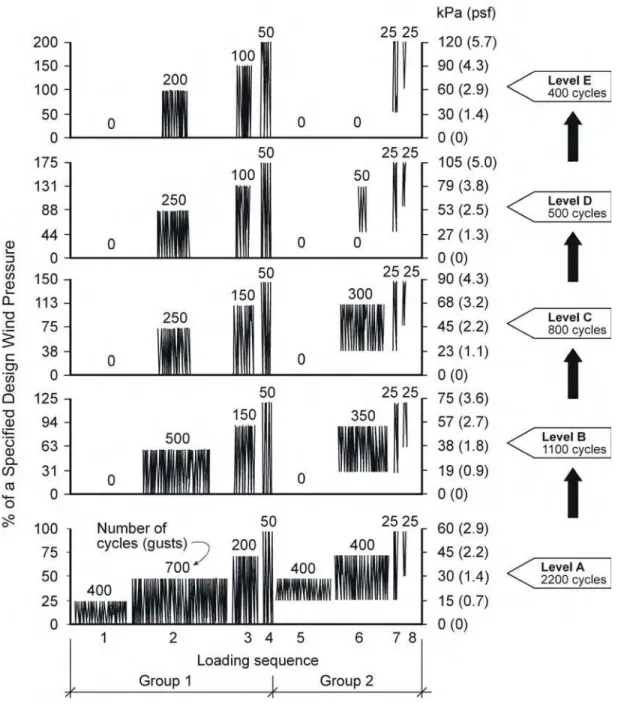
All the experimental works were carried out at the DRF. The DRF features are given in Baskaran et al. [12]. All assemblies were subjected to the simulated wind dynamics in accordance to CSA A 123.21-04 standard [10]. Figure 10 shows the CSA load cycle and it has five rating levels (A to E). The test pressure on the Y-axis corresponds to the design pressure, in accordance with local building codes or wind standards. The CSA load cycle is more detailed in Baskaran et al. [13]
Figure 10:CSA Dynamic Load Cycle
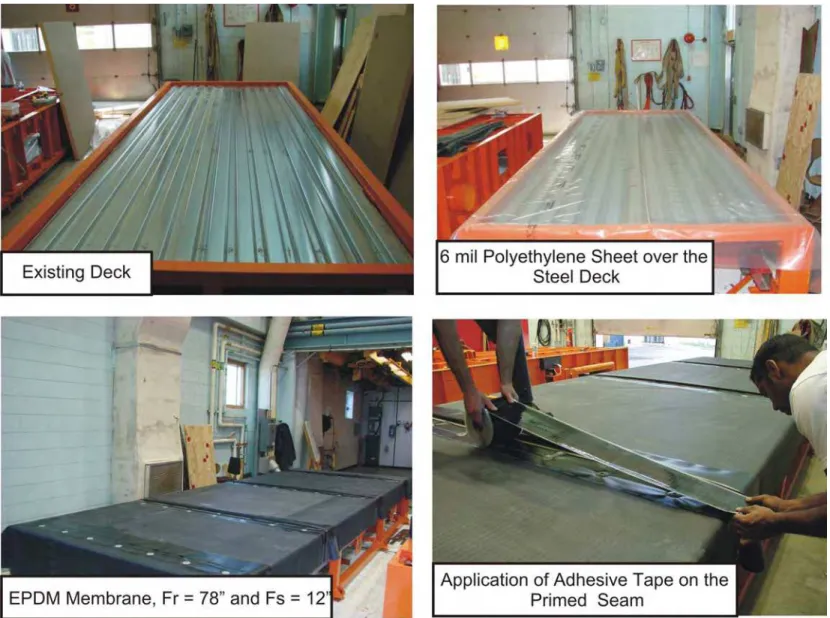
Using a thermoset waterproofing membrane, two full-scale system mockups, LS1 and FS1 were constructed and tested. The system layout details are shown in Figure 11. LS1 had 22 Ga-33ksi deck as the structural substrate. In the DRF bottom frame, two full sheet of 36” (914 mm) wide and a cut sheet of 24” (610 mm) wide steel decks were installed along the length of the test frame. A 6-mil polyethylene sheet was installed as the barrier over the deck in loose laid condition. The insulation configuration comprised of a layer of 2” (51 mm) thick boards. Four full boards of 48” x 79” (1219 mm x 2006 mm) and one partial board of 44” x 79” (1118 mm x 2006 mm) installed with the long edges perpendicular to the steel deck flutes. The boards were mechanically fastened to the steel deck with 8 fasteners /board. The membrane layout comprised of three EPDM membrane sheets, which were laid on top of the insulation and were fastened with #14 fasteners at a fastener row spacing (Fr) of 78” (1981 mm) and fastener spacing (Fs) of 12” (305 mm) along the seam. The fastening plates were 2” (51 mm) diameter polymer plates. The membrane seam, which had an overlap of 6” (152 mm) was primed and adhered to form overlap seam with an adhesive tape as shown in Figure 11. This type of attachment is known as in-seam attachment as referenced in the Figure 1.
To duplicate the field condition, all the above components were maintained constant as that of the LS1 with the exception of the deck. A second mock up with 22 Ga-80 decks was installed in the DRF bottom frame and labeled as Field System – FS1.
Figure 11: System Details for Benchmarking Experiment 1
Both LS1 and FS1 were subjected to the CSA A123.21-04 [10] load cycle and Figure 12 shows the system response. The measured wind uplift resistance data indicates that LS1 passed the first three levels (60, 75 and 90 psf – 2.9, 3.6 and 4.3 kPa) of the CSA load cycle. Since the system failed at Level D sequence 4, LS1 obtained a wind uplift rating of 90 psf (4.3 kPa). In the case of FS1, the wind uplift rating is 105 psf (5 kPa) as the FS1 successfully sustaining all four levels (60, 75, 90 and 105 psf -2.9, 3.6, 4.3 and 5 kPa) and failed during the sequence 4 at Level D of the CSA load cycle. As proposed by the present study, since the verification factor FPR of the FS1 is higher than the LS1, the deck variation does not influence the required 90-psf (4.3 kPa) wind uplift rating.
Figure 12: Validation of the Lab System Performance with Field System for Benchmarking Experiment 1
To generalize the concept of the FPR as verification factor, it has been decided to investigate further on systems with different water proofing membrane, namely a system with thermoplastic membrane. The primary difference in the system construction using a thermoset or a thermoplastic membrane is the seam attachment mechanism as discussed in the Figure 1. The following case studies demonstrate the viability of the verification factor FPR for systems having thermoplastic membrane.
Design Dilemma 2
• A roofing system with thermoplastic membrane was tested at the DRF in accordance to the CSA A123.21-04 [10] obtained a wind uplift rating of 157 psf (7.5 kPa). This is referred as LS2.
• Similar to the “Design Dilemma 1”, this roof system needs to be installed in field, which has requirement of 150 psf (7.2 kPa).
• Comparing the components used in the lab with the arrangements available in the field, it has been noticed that variation exists in the thickness (gauge) of the deck i.e. the deck used in the lab was 22 Ga and whereas the deck in the field is 20 Ga. Note that the as discussed in the Section 2, difference in thickness of deck can result difference in yield strength. Nevertheless, the question is whether this component variation will affect the overall system wind uplift rating.
• Let the thermoplastic field system be referred as FS2
Solution 2
• The fastener-deck interface of LS2 (#15 – 22 Ga) yielded a FPR of 685 lbf (3014 N), while FS2 (#15 – 20 Ga) had a FPR value of 890 lbf (3930 N)
• Even though there is a variation in the deck thickness, the verification factor FPR of FS2 is higher than the LS2, therefore it is expected that similar wind uplift rating can be maintained between these two systems.
Validation Experiment 2
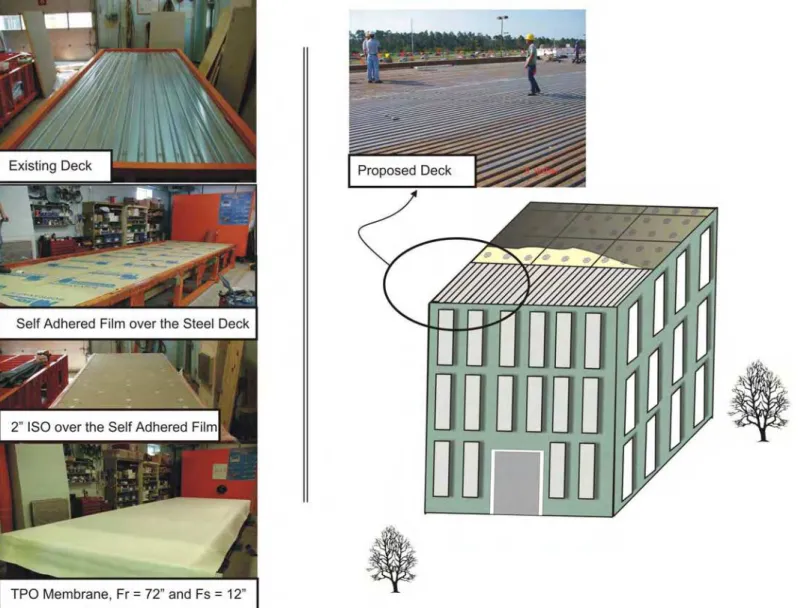
As shown in Figure 13, a mechanically attached thermoplastic system (TPO) was selected. In LS2 the steel deck layout comprises of 22 Ga. With steel deck installed, self-adhered membranes were laid on top of it as the barrier. A layer of 2” (51 mm) thick insulation with four full boards of 48” x 79” (1219 mm x 2007 mm) and one partial board of 44” x 79” (1118 mm x 2007 mm) was installed with the long edges perpendicular to the steel deck flutes. The boards were mechanically fastened to the steel deck with 8 fasteners /board. The TPO membrane sheets were installed at a row spacing (Fr) of 70.5” (1791 mm) and were fastened at 12” (305 mm) spacing (Fs) along the seam, resulting in 7 fasteners per seam. A typical double-side weld (DSW) seam as shown in the Figure 1 was adopted as the seam attachment mechanism. It was done by fastening the seam overlap portion of the bottom sheet to the deck using # 15-5” long fasteners with polymer batten bars of 1” (25 mm) wide. Hot air welding was used to seam the top membrane to the bottom one. FS2 construction and components were similar to that of LS2 with the exception of the deck used.
When subjected to CSA dynamic wind loading cycle, the measured wind uplift resistance data indicate that LS2 sustained 90 psf (4.3 kPa) of wind uplift rating while FS2 sustained a wind uplift rating of 105 psf (5 kPa). From the system responses shown in Figure 14, the concept of FPR as a verification factor to estimate wind uplift performance of a roof system is validated.
Figure 14: Validation of the Lab System Performance with Field System for Benchmarking Experiment 2
Design Dilemma 3
• For the above-discussed scenario, during the field construction, due to various reasons the manufacture was not able to supply the same type of fastener (#15) for one segment of the roof. A substitute fastener type (# 21) was proposed and it had a FPR of 1148 lbf (5050 N). Again, the question is how this will impact on the wind uplift rating?
Solution 3
• Even with the fastener substitute, the verification factor FPR is higher than the LS2’s FPR; therefore one can conclude the fastener substitution will not impact the wind uplift rating.
Validation Experiment 3
By keeping all the components constant, a third mock up was constructed at the DRF. For this mock up – labeled as FS3 – the substitute fastener (#21) was used to attach the membrane with the deck. FS3 was also subjected to the CSA A123.21-04 [10] load cycle and Figure 15 compares the system wind uplift ratings. FS3 had a wind uplift rating of 175 psf (8.4 kPa). This once again validates the present study proposal of using the FPR as a verification factor.
Figure 15: Validation of the Lab System Performance with Field System for Benchmarking Experiment 3
In addition to the above validation it has also been observed that an increase in the FPR can increases the wind uplift rating. LS2 with FPR of 685 lbf (3014 N) had a wind uplift rating of 157 where as the wind uplift rating is increased to 180 psf as FPR increases to 1148 lbf (5050 N). To understand this observation, the measured fasteners forces were further analyzed and presented in Figure 16. The figure 16 compares the measured fastener force at various pressure levels for LS2, FS2 and FS3. Data corresponding to the Group one of the CSA load sequences (refer the Figure 10) was used. Irrespective of the deck type, the maximum measured fastener load is less than the fastener pullout resistance. For fastener/deck combination used on LS2 and FS3the 22 Ga deck, the pullout resistance from component testing was 685 lbf (3014 N) and 1143 lbf (5050 N) respectively. The measured fastener lads were about 640 lbf (2810 N) and 672 lbf (2950 N) respectively from the system testing. In the case of FS2, respective value was 893 lbf (3930 N) compares to 706 lbf (3106 N).
Currently, the generic equation force divided by area is a common practice to calculate the system resistance, i.e.,
System resistance = Fastener pullout value/ Fastener spacing x Fastener row spacing. (1)
Equation (1) is not true representation of the wind-induced dynamic effects on the MAS. To demonstrate this, linear regression lines were obtained for the LS2, FS2 and FS3 data. As discussed previously, all three systems used same fastener spacing and fastener row spacing. In other words, tributary area was constant. However as shown below, regression equations had difference in slope as follows:
YLS2 = 3.2 X (2)
YFS2 = 3.5 X (3)
YFS3 = 3.7 X (4)
From the above equations, it is clear that as the FPR increases, the slope increases, as does the wind uplift rating. Thus system resistance is a combined performance outcome of all components used in the system.
Figure 16: Load Verification for Evaluating Systems Performance
During the review process of this paper two related issues were raised. First the influence of the testing table size effect on the wind uplift resistance of the system or the influence of table edge effect on the wind uplift rating of the roofing system. Table edge effect is a phenomenon, which affects the uplift performance of roofing system when systems are tested in laboratory conditions using testing table smaller than the required table size. Authors [14] and [15] and other researchers [16] and [17] addressed this issue in the past. Fastener load is one of the critical design factors that will be influenced when systems are tested in a narrow table. Authors developed correction factors to overcome this issue and those developments are now part of the Canadian national standard CSA A123.21-04 [10]. The contribution of the present paper is to illustrate the relative comparison of the systems performance. Thus the issue of table edge effect can be eliminated and the FPR could still be applicable as a verification tool. The second issue raised focus on the cost benefit analysis. As it can be agreed, documentation of the cost benefit analysis needs expertise and knowledge beyond technical investigations and data. To tackle this issue for making some conceptual and qualitative recommendations, attempts were made by the author elsewhere [9].
Conclusion
Fastener Pullout Resistance (FPR) is a function of the strength of the fastener-deck interface. To characterize the fastener-deck engagement strength, commonly used fastener-deck combinations were investigated by conducting pullout testing. With the obtained results, further investigation was conducted on full-scale roof systems with the same fastener deck combinations, and attempts were made to relate the FPR with the wind uplift resistance of the roof system. Based on the presented results and discussions, the following conclusions can be drawn:
1. FPR is characterized by three parameters namely, deck thickness, tensile strength and the physical properties of the fastener. The physical properties of the fastener include: shank diameter, thread angle and tip design. FPR can be increased either by increasing the yield strength and gauge thickness of the deck or by engineering the fastener design.
2. FPR is identified as a verification factor for system wind resistance estimation. When variations occur in the fastener-deck interface between the proposed and the existing configurations, the present research through case studies has proved that: “as long as the FPR of the proposed
configuration is higher than the existing configuration then wind uplift ratings can be maintained”.
This is valid as long as both the configurations have all the remaining roofing components similar with comparable layout.
3. During the wind uplift evaluation of a roof assembly, FPR of the fastener-deck interface should be reported along with the system wind uplift rating. This will provide designers an understanding of the deck interface properties used at the system testing in comparison to the fastener-deck interface available in the field. Based on the FPR, design/field alternatives can be accepted.
Acknowledgements
The presented research is being carried out for a consortium - Special Interest Group for Dynamic Evaluation of Roofing Systems (SIGDERS). SIGDERS was formed from a group of partners who were interested in roofing design. These partners included:
Manufacturers Atlas Roofing Corporation, Canadian General Tower Ltd., Carlisle Syn
Tec., GAF Materials Corporation, GenFlex Roofing Systems, Firestone Building Products Co., IKO Industries Ltd., ITW Buildex, Johns Manville, Sarnafil Roofing, Soprema Canada, Stevens Roofing, Tremco and Trufast
Building Owners Canada Post Corporation, Department of National Defence, Public Works and Government Services Canada.
Industry Associations Canadian Roofing Contractors' Association, Canadian Sheet Steel Building Institute, National Roofing Contractors’ Association and Roof Consultants Institute.
References
[1] RICOWI, Inc. (2006), “Hurricanes Charley and Ivan Wind Investigation Report”. Roofing Committee on Weather Issues Inc., McDonough, Georgia, March, pp 286
[2] RICOWI, Inc. (2007) Hurricane Katrina Wind Investigation Report, Powder Springs, and Georgia: Roofing Industry Committee on Weather Issues, Inc. Pp. 183, August 01
[3] Baskaran, A., Smith, T.L., (2005), “A Guide for the Wind Design of Mechanically Attached Flexible Membrane Roofs” National Research Council Canada, Ottawa, Ontario, Canada, K1A 0R6
[4] ASTM E8-03 – Standard test methods for tension testing of metallic materials
[5] ASTM A370-03a – Standard test methods and definitions of mechanical testing of steel products [6] ASTM A653/A 652M-03 –Standard specifications for steel sheet, zinc coated (galvanized) or
zinc-iron-alloy-coated (galvannealed) by the hot-dip process
[7] SPRI (2006), “Standard Field Test Procedure for Determining The Withdrawal Resistance of Roofing Fasteners”, ANSI/SPRI FX-1 2006.
[8] Baskaran, A., Lei, W. and Richardson C. (1999), “Dynamic Evaluation of Thermoplastic Roofing Systems for Wind Performance,” Journal of Architectural Engineering, ASCE, vol. 5, No 5, pp. 16-24. [9] Baskaran, A and KO S.K.P. (2006), “Optimizing the Wind Uplift Resistance of Mechanically Attached Roof Systems”, Accepted by The Journal of Architectural Engineering, ASCE, Will be published in September 2008.
[10] CSA Number A123.21-04 (2004),”Standard test method for the dynamic wind uplift resistance of mechanically attached membrane-roofing systems, Canadian Standards Association, Canada. [11] National Research Council Canada (2005), National Building Code of Canada User’s Guide –
Structural commentaries (Part 4), Ottawa, Ontario, Canada, K1A 0R6.
[12] Baskaran, A. and Lei, W. (1997), "A New Facility for Dynamic Wind Performance Evaluation of Roofing Systems", Proceedings of the Fourth International Symposium on Roofing Technology, NRCA/NIST, Washington, D.C., U.S.A., pp. 168 -179.
[13] Baskaran, A.; Chen, Y.; and Vilaipornsawai, U. (1999) "A New Dynamic Wind Load Cycle to Evaluate Flexible Membrane Roofs”, Journal of Testing and Evaluation, ASTM, vol.27, No 4, pp.249 -265.
[14] Baskaran, A. and Borujerdi, J. (2001), “Application of Numerical Models to Determine Wind Uplift Ratings of Roofs,” Journal of Wind and Structures, 4, (3), June, pp. 213-226.
[15] Baskaran, A. and Molleti S. (2005), “Application of Numerical Models to Determine Wind Uplift Ratings of Roofs – Part II,” Journal of Wind and Structures.,8,(3),May,pp. 213-233
[16] Prevatt, David. O., Schiff, D. Scott and Malpezzi, Joseph A., (1997) “Investigation of Chamber Size for Uplift Performance Testing of Single-Ply Roof Systems,” Proceedings of the Fourth International Symposium on Roofing Technology, NRCA/NIST, Washington, D.C., U.S.A., pp. 163-167.
[17] Prevatt, David. O., Schiff, D. Scott., Stamm,S.Joshua and Kulkarni S. Amolprasad., (2008) “Wind Uplift Behaviour of Mechanically Attached Single-Ply Roofing Systems: The Need For Correction Factors in Standardized Test” Journal Of Structural Engineering., 134(3) ,March, pp 489-498.
[18] Gere, M.James, (2001) “ Mechanics of Materials- Fifth Edition”, Chapter 1, Section 1.3, Boooks/Cole Thomson Learning Academic Resource Center.
Figure Captions
Figure 1: Wind Induced Fastener Forces on Various Mechanically Attached Roofing System Figure 2: Steel Deck Coupons for Property Evaluation
Figure 3: Measured vs. Nominal thickness of the Steel Decks Figure 4: Yield Strength Measurement of Steel Decks
Figure 5: Measured vs. Nominal Yield Strength of the Steel Decks Figure 6: Physical Characteristics of the Tested Fasteners
Figure 7: Experimental Setup for Fastener Pullout Measurements
Figure 8: Load versus displacements curves during the fastener pullout testing. Figure 9: Comparison of the Fastener Pullout Resistance for Different Deck Types Figure 10: CSA Dynamic Load Cycle
Figure 11: System Details for Benchmarking Experiment 1
Figure 12: Validation of the Lab System Performance with Field System for Benchmarking Experiment 1 Figure 13. System Details for Benchmarking Experiment 2
Figure 14: Validation of the Lab System Performance with Field System for Benchmarking Experiment 2 Figure 15: Validation of the Lab System Performance with Field System for Benchmarking Experiment 3 Figure 16: Load Verification for Evaluating Systems Performance
Thermoplastic: Single-Side Weld Attachment
Thermoplastic: Double-Side Weld Attachment
Figure 1: Wind Induced Fastener Forces on Various Mechanically Attached Roofing Systems
Thermoset: Tape-Over Attachment
Thermoset: In-Seam Attachment
0.027 0.028 0.029 0.03 0.031 0.032 0.033 0.034 0.035 0.036 0.037 22-33-06 22-80-06 20-33-06 20-80-06
Sample ID
Thickness, inches
Measured
Nominal
Measured Thickness (1 inch = 25.4 mm)Instron Machine Region of necking Region of fracture Region of fracture
22-Ga (33 ksi) 22-Ga (80 ksi)
Figure 4: Yield Strength Measurement of Steel Decks 0 10 20 30 40 50 60 70 0 10 20 30 4 Te ns ile Strain, %
Tensile Stress, ksi
0 22 Ga -33 k si Fracture Ultimate Tensile Strength Yield Strength 0 20 40 60 80 100 120 0 0.5 1 1.5 2 2.5 3 3.5 4 Tensile Strain,% Te ns ile Stre s s , k s i 22 Ga –80 ksi 0.2% Offset Yield Strength Ultimate Tensile Strength
0
10
20
30
40
50
60
70
80
90
22-33-06
22-80-06
20-33-06
20-80-06
Sample ID
Yield Strength, ksi
Measured
Nomina
(1 ksi =6.9 Mpa)
l
Fastener Type &
Source
Head
Tip
Thread
Source 1
#14
Source 2 #15 Source 2 #21 Source 3 #15 Source 4 #2180 ksi Steel Deck
33 ksi Steel Deck
Fastener Under
Pullout
80 ksi Steel Deck
33 ksi Steel Deck
0
1
2
3
4
5
6
7
0
5
10
15
20
25
Cross-Head Displacement, mm
FPR, kN
#15-S2: 22 Ga - 33 ksi #15-S2: 22 Ga - 80 ksi #21-S2: 22 Ga - 33 ksi #21-S2: 22 Ga - 80 ksi0
1
2
3
4
5
6
7
0
5
10
15
20
25
Cross-Head Displacement, mm
FPR, kN
#15-S2: 20 Ga - 33 ksi #15-S2: 20 Ga - 80 ksi #21-S2: 20 Ga - 33 ksi #21-S2: 20 Ga - 80 ksi(1 kN= 228 lbf)
0
200
400
600
800
1000
1200
1400
#14-S1
#15-S2
#15-S3
#21-S2
#21-S4
Fastener ID
FPR, lbf
22-33 ksi
20-33 ksi
22-80 ksi
20-80 ksi
1 lbf = 4.4 N
(b) Field System 2
Figure 12: Validation of the Lab System Performance with Field System for Benchmarking Experiment 2 (1 psf = 47.88 Pa) Pr e s su re , p s f Pr e s su re , p s f 0 30 60 90 120 0 30 60 90 120 0 10000 20000 30000 40000 Time, sec 15 30 46 61 30 46 61 38 57 77 57 77 46 70 93 70 92 54 82 109 Pt = 60psf 070627Pref 0 10000 20000 30000 40000 Time, sec 15 30 45 60 30 45 60 38 56 74 56 75 45 67 90 68 90 53 79 104 Pt = 60psf 59 89 070619Pref (a) Lab System 1
P ress u re, p s f Pr e s s u re , p s f
Figure 14: Validation of the Lab System Performance with Field System for benchmarking Experiment 2 (1 psf = 47.88 Pa) 0 30 60 90 120 150 180 21 0 30 60 90 120 150 180 21 0 0 0 10000 20000 30000 40000 Time, sec Pt = 90psf 23 46 68 90 46 68 90 59 86 113 86 114 70 102 102 136 136 77 118 160 89 136 180 040107-Pref 0 10000 20000 30000 40000 Time, sec Pt = 90psf 25 47 71 93 92 47 71 60 85 87 113 115 71 102 104 138 138 80 11 16 040209-Pref 7 0 162 90 137 180 (b) Field System 2 (FS2) (a) Lab System 2 (LS2)
157 180 175 0 20 40 60 80 100 120 140 160 180 200 Sustained Pressure, psf (1 psf = 47.88 Pa) Dec k Variati on Fastener Var iation
Lab System 2 Field System 2 Field System 3
Figure 15: Validation of the Lab System Performance with the Field System for Benchmarking Experiment 3
y = 3.7x y = 3.2x y = 3.5x
0
100
200
300
400
500
600
700
800
0
50
100
150
200
Pressure, psf
Measured Fastener Load, lbf
Figure 16: Load Verification for Evaluating Systems Performance (1 psf = 47.88 Pa) (1 lbf = 4.4 N) FS3 FPR = 1148 lbf FS2 FPR = 893 lbf LS2 FPR = 685 lbf