ASSESSMENT METHODOLOGY FOR ENVIRONMENTAL IMPACT OF
BRIDGES
By
Rosalie
J.
Bianquis
B.S. Civil Engineering
School of Engineering, Ecole Speciale des Travaux Publics, 2014
ARCHIVES
MASSACHUSETTc fNQT1T ITE OF TECHNOLOLGY
JUL 02 2015
LIBRARIES
SUBMITTED TO THE DEPARTMENT OF CIVIL AND ENVIRONMENTAL
ENGINEERING IN PARTIAL FULFILLMENT OF THE REQUIREMENTS OF THE
DEGREE OF
MASTER OF ENGINEERING
AT THE
MASSACHUSETTS INSTITUTE OF TECHNOLOGY
JUNE 2015
( 2015 Rosalie
J. Bianquis. All rights reserved
The author hereby grants to MIT permission to reproduce and to distribute publicly paper and
electronics copies of this thesis document in whole or in part in any medium now known or
hereafter created.
Signature of Author:
Certified by:
Accepted by
Signature redacted
Department of Civil and Eonmental
jngin
}/. ay 8:W
Signature redacted
John
A. Ocl1sndorfProfessor of Civil and Environmental Engineering and Architecture
j
j#
Tbis Supervi or
Signature redacted
W'eiai qepf
Donald and Martha Harleman Professor of Civil and Environmental Engine
g
Chair, Department Committee for Graduate Students
Assessment Methodology for Environmental Impact of Bridges -2015
Assessment Methodology for the Environmental Impact of
Bridges
By
RosalieJ.
BianquisSubmitted to the Department of Civil and Environmental Engineering
On May 8, 2015 in Partial Fulfillment of the
Requirements for the Degree of Master of Engineering in Civil and Environmental Engineering
ABSTRACT
Residential and commercial buildings and transportation represent 21% of the global greenhouse gas emissions in the world. In the United States, this percentile goes up to 38% of the greenhouse gas emissions of the country. Since the structures account for the highest material weight in buildings, any reduction in the emissions due to structures (their construction, operation, maintenance, and end of life) can have a real impact on the total emissions of greenhouse gases in the world.
Many rating systems have been established to evaluate the performance of buildings and their environmental impact. However, less work has been done for bridges. The existing ratings system for buildings cannot yet be adapted to bridges because of the different use of these structures. Indeed, while a building would have important emissions during the operation phase, a bridge would have practically none. Moreover, the bridge creates a shorter path for cars to travel and therefore it can actually reduce some emissions due to the cars and other vehicles. Many other differences show that to evaluate the environmental impact of bridges and their part in the global warming, a new set of studies needs to be conducted.
This thesis will develop a methodology to evaluate the environmental impact of bridges, mainly focusing on road bridges: first, by developing a methodology assessing embodied carbon of bridges instead of buildings, second by applying this method to fifteen footbridges and six road bridges, and third by including traffic, operation and maintenance into carbon accounting and conducting three cases studies. The results show that the footbridges emit on average 419 kgco2e/m2. Road bridges emit on average 1347 kgco2e/m2 for road bridges with a length under
1000m
and 3446kgco2r/m2 for the others. Finally, it shows how important the operation phase is compared to the maintenance phase.Thesis Supervisor: John A. Ochsendorf
Assessment Methodology for Environmental Impact of Bridges -2015
Assessment Methodology for Environmental Impact of Bridges
-
2015
ACKNOWLEDGEMENTS
I would like to start by thanking some people without whom this thesis would not have been
possible.
First, I would like to thank my advisor Professor John Ochsendorf who always pushed me
further and challenged me to do better. His knowledge and his expertise were priceless during my
research.
I also would like to thank PhD student Catherine De Wolf for her guidance and her great
help from the beginning to the end of this project. Her experience and insight during this year have
been a key for me to pursue my research.
I would like to thank Professor Pierre Ghisbain and Professor Jerome Connor who taught me
more about structural engineering than any other teacher did.
Thank you to Emily Spencer whose friendship has been irreplaceable during this year at MIT.
Her moral support, her humor and her kindness will always be my best memory.
In addition, I would like to thank my parents, Patricia Chapuis and Jean-Philippe Bianquis,
along with my sister Clara and my brother Gaspard who encouraged me and believed in me, even
when I did not.
Finally, I would like to thank my classmates from the Master of Engineering program for
their friendship and their support during this year at MIT.
Assessment Methodology for Environmental Impact of Bridges -2015
Assessment Methodology for Environmental Impact of Bridges - 2015
TABLE OF CONTENTS
A bstract
...
3
A cknow ledgem ents
...
5
N otations
...
11
1
Introduction
...
13
1.1
M otivations
...
13
1.2
Problem Statem ent
...
15
1.3
D efm itions
...
16
1.3.1
Sustainability
...
16
1.3.2
G reenhouse G ases
...
16
1.3.3
G lobal W arm ing Potential
...
17
1.3.4
Life Cycle A ssessm ent
...
18
1.3.5
E m bodied and O perational Carbon
...
19
1.3.5.1
Em bodied Carbon
...
19
1.3.5.2
O perational Carbon
...
20
1.4
O rgani*zation of Thesis
...
20
2
Literature Review
...
21
2.1
Existing Rating System s of Bridges
...
21
2.1.1
G
reenroadSTM ...
21
2.1.2
H unt's rating system
... 22
2.1.3
Sim os' rating system
... 23
2.2
Em bodied Energy and Carbon
... 24
2.3
O perational E nergy and M aintenance
... 25
3
M ethodology
... 27
4
E m bodied Carbon
... 28
4.1
M ethodology
... 28
4.2
Em bodied Carbon Coeffi cients
... 29
Assessment Methodology for Environmental Impact of Bridges -2015
4.4
Road Bridges ...
34
4.5 Comparison with other database of embodied carbon coefficients... 38
5 O peration and M aintenance ... 40
5.1 M ethodology for a w hole life cycle carbon assessm ent... 40
5.1.1 Construction Stage... 40
5.1.1.1 Em ission due to structural m aterials ECMat . ... ... . .... ... 41
5.1.1.2 Em ission due to the use of m achines Ecmac ... 41
5.1.1.3 Emission due to the transportation of the materials ECTan... 42
5.1.1.4 Em ission due to other factors Ecoth... 43
5.1.2 O peration stage ... 43
5.1.2.1 Em ission due to light E oig ... 44
5.1.2.2 Em ission due to the tollbooth EOToI... 44
5.1.2.3 Em ission due to other factors... 47
5.1.3 M aintenance stage... 47
5.1.3.1 Emission due to the replacement of structural materials and the use of machines EMMat and EM ac... 48
5.1.3.2 Em ission due to the perturbation of traffic E
mT
... 485.1.4 Benefits of the bridge... 52
5.1.5 Conclusion ... 53
5.2 Cases studies... 53
6 Conclusion...57
6.1 Sum m ary of results... 57
6.2 D iscussion of the results ... 57
6.3 Future research ... 58
6.3.1
A dding data...58
6.3.2 Cradle -to -grave assessm ent m ethodology... 58
6.3.3 D evelopm ent of a rating system s ... 59
7
A ppendix ...
60
7.1 A ppendix A : Pedestrian Bridges Inform ation... 62
Assessment Methodology for Environmental Impact of Bridges
-
2015
7.2
Appendix B: Pedestrian Bridge Normalized Material Quantities ...
65
7.3
Appendix C: Pedestrian Bridge Global W arm ing Potential...
66
7.4
Appendix D : Road Bridges Inform ation ...
68
7.5
A ppendix E: Road Bridge N orm alized M aterial Q uantities ...
68
7.6
Appendix F: Road Bridge G lobal W arm ing Potential...
69
7.7
A ppendix G : Consum ption of gasoline ...
71
7.8
A ppendix H : Em ission factor for transportation...
71
7.9
Appendix I: Service Life of different com ponents ...
71
7.10
Appendix J:
G olden G ate Bridge...
73
7.11
A ppendix K : M illau Viaduct...
76
7.12
Appendix L: Sydney H arbour Bridge ...
79
Table of Figures ...
82
Table of Tables...
82
Table of Equations ...
84
Table of G raphs ...
85
8
References ...
86
8.1
D ocum entation...
86
8.2
Im ages ...
87
Assessment Methodology for Environmental Impact of Bridges -2015
Assessment Methodology for Environmental Impact of Bridges
-
2015
NOTATIONS
CEQR
-City Environmental Quality Review
EC -
Embodied Carbon
ECC
-
Embodied Carbon Coefficient
EPA
-Environmental Protection Agency
GHG - Greenhouse Gases
GWP
-Global Warming Potential
ICE -
Inventory of Carbon and Energy
LCA - Life Cycle Assessment
LCCA
-
Life Cycle Cost Assessment
LEED
-
Leadership in Energy and Environmental Design
NMQ
-Normalized Structural Material Quantities
SMQ
-Structural Material Quantities
Assessment Methodology for Environmental Impact of Bridges -2015
Assessment Methodology for Environmental Impact of Bridges -2015
1
INTRODUCTION
1.1
MOTIVATIONS
Treat the earth well it was not given toyou by your parents, it was loaned toyou byyour children. We do not
inherit
the Earthfivm our ancestors, we bormw itform our children.
This ancient American proverb, pronounced centuries ago, makes even more sense in the society we are living in today. It means that every action that harms the earth and its nature, is an action taken against our children's future. In addition, this is why, feeling concerned about the greenhouse gases (GHG) emission is imperative.
According to the United States Environmental Protection Agency (EPA), transport (road, rails, air and marine) and buildings represents 21% of the global GHG emission in the world (Figure 1-1). If we look only at the United States, this number is even bigger: the transportation and the building sector stand for 38%, more than a third, of the total emission in the year 2012 (Figure 1-2). As a civil engineer, the purpose is to make progress in the domain of residential & commercial buildings as well as in the infrastructures (roads, bridges, tunnels). When it comes to buildings, a lot of rating systems for sustainable buildings have been created and a decent amount of research and reports have been made on how to evaluate and measure the sustainability of a building. In contrary, very few studies have been made on infrastructures.
Waste and wastewater Ar Co COimmercial buildings 8%
Assessment Methodology for Environmental Impact of Bridges
-
2015
Bridges are an important part of those infrastructures. According to the United State
Department of Transportation, in 2013 there were around 600,000 bridges in total in the United
States and each year thousands of new bridges are constructed (Figure 1-3).
60 000 50 000 40 000 30 000 210 000 0 Y1 RS
Figure 1-3 -Number of Bridges built in the U.S.
As mentioned before, there are already a number of rating systems and studies completed to
measure the sustainability of buildings. Why are bridges so different from buildings? First, a major
distinction comes from who decides to build them. Indeed, when it comes to buildings the client is
most of the time a private company or a private investor, whereas for bridges the client is often the
government or a public administration (a city, a state, a region etc.). The main consequence is the
budget, which is usually more limited coming from the government than from the private sector.
Moreover, because the bridge is reducing the route for the cars, there are fewer expectations about
how sustainable it is. The users of the bridges are more concerned about its financial cost to their city,
state or country, which they are indirectly paying for through tax money than they are about its
sustainability. When a company creates a new building if they get a sustainable certification it sells
their company as one who cares about the environment. The image of the company is important.
Being a company that cares about the environment will benefit this company.
A second major difference is the purpose of the structure. Indeed, most buildings are either
apartment buildings or office buildings. The facade and the architecture of the building is a "bonus"
compared to its fundamental aim. For the bridge, the initial aim is to link to part of a city or create a
shorter route for drivers. At the same time, there is an important social purpose: on one hand, by
making two parts of the world closer than before (in time of travel) and, on the other hand, because
bridges can often be compared to a piece of art, and they define a city. Everyone knows the Golden
Assessment Methodology for Environmental Impact of Bridges -2015
Gate Bridge belongs to San Francisco (Figure 1-4), or the Tower bridge to London (Figure 1-5). This is an important part of your city that can also have an economic intention by bringing tourism.
Figure 1-4 -Golden Gate Bridge, San Francisco Figure 1-5 -Tower Bridge, London
One last distinction is the GHG emissions "saved" by the presence of the bridge. Indeed, adding a bridge and especially a road bridge helps reducing the emissions of GHG. For the road bridges, it creates a new road for the cars and possibly a shorter route to get from a point to A to a point B. This alternative road allows drivers to have a reduced time on the road and to emit less
GHG. When it comes to pedestrian bridges, it is less obvious how they reduce the emission of GHG.
It can reduce those emissions by influencing people to walk to a place they would usually take their car to go to. This thesis will illustrate this with some examples of such bridges.
All these different properties of a bridge makes it more difficult to create a suitable rating
system. This system would have to take into account the construction, the operation, the maintenance and the demolition of the bridge but also its social impact, its economic impact as well as its efficiency to create a simpler and shorter path for cars and/or pedestrians.
1.2
PROBLEM STATEMENT
There is a gap in knowledge in the sustainability of bridge design. Indeed, very little
information is available on the material used, the dimensions but also maintenance and operation. Almost no studies have been conducted on the occurrence of maintenance and its consequences. Is the bridge still open during maintenance, if yes, how many lanes are in service compared to when it is fully functional, and if not what bypass route is suggested? This knowledge could help characterizing the bridge and its sustainability.Assessment Methodology for Environmental Impact of Bridges -2015
The main literature on the maintenance and operation of bridges comes from economic studies. Indeed, for some bridges, a Life Cycle Cost Analysis (LCCA) has been conducted. The LCCA takes into account the traffic, the different tollbooths and other factors that are important for any infrastructures. Adapting this method to GHG emissions and considering the operation and maintenance phases of a bridge's life cycle will be one of the main goals of this thesis.
The aim of this thesis is to create a benchmark for embodied carbon for bridges (for road bridges as well as for pedestrian bridges) and to develop a methodology to take into account maintenance and operation by expanding LCCA methodology to carbon emissions. Thanks to these contributions, a new assessment and conception of sustainable bridges could be developed.
1.3
DEFINITIONS
1.3.1
Sustainability
The definition given by the EPA is "Sustainability is based on a simple principle: Everything that we need for our survival and well-being depends, either directly or indirectly, on our natural environment. Sustainability creates and maintains the conditions under which humans and nature can exist in productive harmony, that permit fulfilling the social, economic and other requirements of present and future generations." In other words, as defined in the Brundtland report, "sustainable development is development that meets the needs of the present without compromising the ability of future generations to meet their own needs."
Sustainable development is a way of thinking by taking into account the consequences, direct or indirect of our actions. The consequences could affect the world in a month, a year or a century but they still exist and making sure that they do not disturb the planet so much that they destroy it, is a sustainable development.
1.3.2 Greenhouse Gases
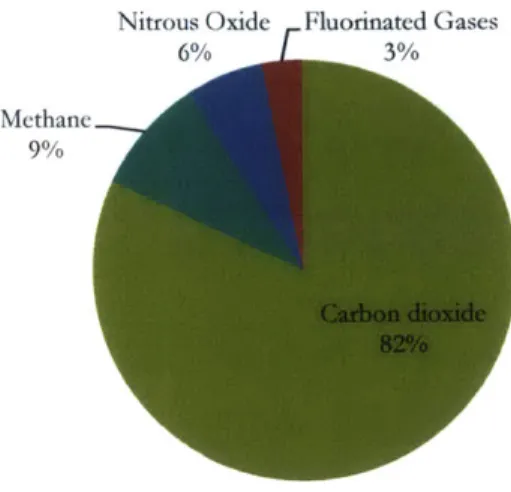
The emissions of GHG are the main anthropogenic contribution to the global warming of the planet. The main greenhouse gas is the carbon dioxide as illustrated in Figure 1-6. However, other gases are considered as gases that impair the planet and the ozone layer such as methane, nitrous
Assessment Methodology for Environmental Impact of Bridges -2015
oxide and fluorinated gases. The latest are emitted in small amounts, though, they have an important effect on the earth and are sometimes referred as High Global Warming Potential Gases (EPA, 2012).
Nitrous Oxide Fluorinated Gases
6% 3%
Methane___
9% A
Figure 1-6 -Greenhouse Gases
The presence of these gases in the earth atmosphere has increased since the Industrial
Revolution due to different human activities. These different activities are listed in the Table 1-1.
Burning solid waste
Burning trees and wood products Certain chemical reactions Production, transport of coal Production, transport of natural gas Production, transport of oil
Livestock and other agricultural practice Agricultural and industrial activities Combustion of fossils fuels Combustion of solid waste jVariety of industrial process
Table 1-1 -Greenhouse Gases Source of Emissions
1.3.3 Global Warming Potential
The global warming potential (GWP) is a measure that compares the energy absorbed by gas over a certain amount of years (usually, 100 years) to the one absorbed by the carbon dioxide
Assessment Methodology for Environmental Impact of Bridges -2015
(EPA,2012). The carbon dioxide has a GWP of exactly one because it represents the reference. In
Table 1-2, the GWP of methane and nitrous oxide are shown as an example.
21
310
Table 1-2
-Global
Warming Potential of some Greenhouse Gases
1.3.4
Life Cycle Assessment
Life cycle assessment (LCA) is the process of evaluating the effects that a product has on the environment over the entire period of its life cycle (UNEP, 1996). As shown in the Figure 1-7, an
LCA is divided in four stages: 1. Goal Definition and Scope 2. Inventory Analysis (LCI)
3. Impact assessment
4. Interpretation
Lye Cycle
A
al-s-m--
F
k
Figure 1-7 -Life Gycle Assessment Framework
The EPA gives definition of these different phases.
Goal definition and scoping is the phase of the LCA process that defines the purpose and method of including life cycle environmental impacts into the decision-making process.
Assessment Methodology for Environmental Impact of Bridges -2015
The life cycle inventory is the process of quantifying energy and raw material requirements, atmospheric emissions, waterborne emissions, solid wastes, and other releases for the entire life cycle of a product, process, or activity.
The Life Cycle Impact Assessment (LCIA) phase of an LCA is the evaluation of potential human health and environmental impacts of the environmental resources and releases identified during the
LCI.
Life cycle interpretation is a systematic technique to identify, quantify, check, and evaluate information from the results of the LCI and the LCIA, and communicate them effectively.
The life cycle assessment is a systematic study and can be applied to any product or good. Different software have been created to simplify those assessments, for example GaBic or Athenac.
1.3.5
Embodied and Operational Carbon
1.3.5.1
Embodied Carbon
There is an important difference between the embodied energy and the embodied carbon.
The embodied energy is the quantity of energy required by all activities associated with the production of a material (Treloar, 1994). It takes into account the energy needed from extracting the material to the final manufacture of the product. It is measured in Joules.
The embodied carbon and the embodied energy are not the same measures. The embodied carbon corresponds to the emitted GHG to produce the embodied energy (De Wolf, 2014). The embodied carbon is going to be measured in kilograms of carbon dioxide equivalent. It will take into account the fuel used while the material is being process but also the carbon emitted and/or absorbed during that phase.
For buildings, the embodied energy and the embodied carbon also takes into account the maintenance and the end of life stages (De Wolf, 2014).
For the analysis of a bridge, the embodied carbon is taken into account during the construction phase.
Assessment Methodology for Environmental Impact of Bridges -2015
1.3.5.2
Operadonal Carbon
The operational carbon corresponds to the emitted GHG during the life of the bridge. It includes the emission due to maintenance and operation of the bridges. As opposed to buildings, in bridges the maintenance is considered as a part of the operational carbon, as it is linked to traffic obstruction affecting the use of the bridge. Moreover, if the bridges have lights, the emissions due to the electricity used will enter the operational carbon.
1.4
ORGANIZATION OF THESIS
After this introduction, and the definition of some useful notions to fully understand this thesis the third chapter will focus on the literature review. The latter will focus on three main subjects: the rating systems of bridges, the embodied carbon coefficients and the embodied energy, and the maintenance and operation of bridges.
The fourth chapter will focus on the embodied carbon in bridges: the emissions occurring during the construction phase of the bridge. It will give values of those emissions and compare about twenty bridges. An embodied carbon benchmark will be established for both road and pedestrian
bridges.
The fifth chapter will concentrate on the operation and maintenance phase of the bridge: the emissions of GHG, linked to it, and how to consider them. It will not only develop a methodology, but will also carry out case studies.
Finally, chapter 6 and chapter 7 will conclude this thesis by summarizing and discussing all the results and suggest different paths for future research.
Assessment Methodology for Environmental Impact of Bridges
-
2015
2
LITERATURE REVIEW
The literature review will be divided into three sections. The first section identifies the main rating systems for bridges; the second section focus on the limited on embodied energy and carbon research; and finally the last section presents studies on the maintenance and operation of bridges which will provide data necessary for this thesis.
2.1
ExISTING RATING SYSTEMS OF BRIDGES
One of the main sustainable rating system that certifies bridges is called GreenroadsTM. However, there has been attempts to create a sustainable rating system for bridges by different people around the word.
2.1.1
GreenroadsTMGreenroadsTM (Figure 2-1) is originally a rating system for roads in the United States. However, it can be applied to road bridges since they represent a special type of roads. As the sustainable rating system for buildings such as the Leadership in Energy and Environmental Design (LEEDTM), it is a point system. According to the number of points at the end, the project can get different level of certification or no certification at all. All the different certifications are represented
in Figure 2-2.
Grosro-I
---
ieas
loaftse
Ieee
tertftled
s rtifle
certified
certified
Figure 2-1 -GreenroadsTM
logo
Figure 2-2 -GreenroadsM CertificationThis current bridge certification only takes into account the road pavement and not the environmental impact of the complete structure. This is the main gap in this system.
Assessment Methodology for Environmental Impact of Bridges -2015
2.1.2 Hunt's rating system
In 2004, Lauren Hunt established different criteria a bridge should meet for a newly developed bridge rating system by using both criteria recycled from LEEDTM and her own original ones. After her list becomes final, Hunt weighs each criterion with a certain number of points based on its impact to the environment. These criteria and their weights are shown in Table 2-1.
She tests her rating system on three bridges, certifying if it gets at least 10 points. Out of the three chosen existing bridges, two of them acquire certification. She concludes that her system should be adapted so that the certification is more rigorous. Indeed, creating a rating system for sustainable bridges has first goal to encourage designers to do better than current practice.
Even so, I believe it does establish useful criteria on how to study bridges. However, there is no reference on how to evaluate each of these points. For instance, the "Material Reduction" criterion does not assign any number for material quantities. Moreover, each material has different embodied carbon linked to it, which mean that they do not have the same impact. This is also the case for the LCA required: it has to be compared to other numbers to establish whether the bridge
should get the points or not.
Rosalie Bianquis
Erosion and Sedimentation Control 1
Brownfield Redevelopment 2
Historic Site Improvements 1
Footin and Pier Location
1
Lane Adaptability
3
HOV Lanes & Transit ways 2
Bike and Pedestrian Lanes 1 or 2
Tollbooth Transponders 1 or 2
Storm water Management
1
Green Power
1
Life Cycle Assessment Re uired
Construction Waste Management 1
Material Reduction 1 Regional Materials 1
Certified Wood
1
Gray Water 1 Cement Replacement 1 Innovation in Design 1-3Table 2-1 -Rating Systemfor Sustainable Bridges, by Iauren R.
Hunt
Assessment Methodology for Environmental Impact of Bridges -2015
2.1.3
Simos' rating system
In 2013, another attempt to create a rating system for sustainable bridges was conducted by Mohamed Marzouk, Ahmed Nouth, and Moheeb El-Said from Cairo University. The paper describes a three-phase process that began with a literature review to identify existing criteria that are used to identify whether or not a bridge is sustainable, and the result of this phase was a list of criteria. The next phase was the review of this list by nine bridges construction expert. Each of them specified the most important criteria affecting the sustainability of a bridge. Finally, the last phase involved giving the experts a questionnaire and asking them to rate each criterion in order of importance. From this survey, any criterion with an average rating of five or less (over ten) was eliminated from the list, trimming the list down to a reasonable length. Using Sismos' procedure, which is a simple weighting method, the criteria were weighted. The final list is shown in Table 2-2.
Lifecycle Cost Analysis 4
Noise Mitigation Plan 3
Waste Management Plan 4
Pavement Management Plan 4
Site Maintenance Plan 3
Potential for Innovations 4
On-site Renewable Energy 4
Habitat Restoration 6
Sustainable sites selection 7
Res ect for historic sites 8
Intelligent Transportation Systems 5
Providing a Bridge User Guide 4
Pedestrian/Bicycle Access 5
Transit Access 5
Visual Enhancements 4
Equipment Emission Reduction 3
Stora e/Separation areas 4
Pavement reuse 4
Earthwork Balance 5
Recycled Materials Reuse 4
Regional Materials 5
Long-Life Pavement 5
Assessment Methodology for Environmental Impact of Bridges -2015
Again, as in Hunt's paper, carbon emissions are not directly considered during the construction, operation and maintenance of bridges. As my study will demonstrate, it is the key to evaluate bridges.
This literature review illustrates the following gaps. First, the difference between bridges and buildings is not always taken into account. Bridges cannot be studied with the same criteria used for buildings. Moreover, to make it possible to evaluate bridges, reference in the emission of carbon during the entire life of the bridge is crucial.
2.2
EMBODIED ENERGY AND CARBON
Research on embodied energy and carbon started a bit more than a decade ago. Since then, different studies have been made to find a way to take this embodied energy and carbon into account during the conception of buildings.
The main challenge concerning the embodied carbon is the Embodied Carbon Coefficients
(ECC) expressed in kgco2e/kg. Indeed, those coefficient needs to be constant for each material so it is
easy to use them to calculate the embodied carbon of a structure but they also need to be accurate. In her thesis,
Material quantities in building structures and their environmental impact,
Catherine DeWolf (2014) studies challenges and opportunities in estimating GHG emissions of structures. The first contribution is the summary of the existing literature on ECC's. The second contribution is the creation of a global database of buildings with their material quantities and their embodied carbon. The name of the database is DeQo and it contains 200 buildings until now. To find the embodied carbon of one material, a formal LCA has to be completed. However, doing an LCA for each material of the project takes a lot of time and having these coefficients would be a great asset to have the embodied carbon of an entire structure. The other major contribution of De Wolf's thesis is the development of a methodology to calculate the embodied carbon of structures using the ECC's. This methodology will be adapted to bridges in this thesis.
Another type of information that would be useful is the LCA of the different structural materials that can lead to establishing the ECC's. One material that would only be used for bridges and roads but not for buildings is the pavement. Santero and Al (2011) have conducted an LCA on this material in
Methods, Impacts and Opportunities in the Concrete Pavement Life Cycle.
This thesis addresses the current gaps on the sustainability of bridges in literature. The key contribution of this thesis will be to use the methodology to calculate the embodied carbon on 20
Assessment Methodology for Environmental Impact of Bridges -2015
footbridges and 10 road bridges. This would give a general idea on a baseline for benchmarking regarding bridges and their embodied carbon.
2.3
OPERATIONAL ENERGY AND MAINTENANCE
The operation phase and maintenance of bridges are different from the ones of a building. For this reason, another methodology has to be created.
Many papers have already been written on the whole life cycle of bridges including the operation and maintenance phase. Most of them are based on examples of real bridges, such as the paper written by Yoshito Itoh,
Using
CO2Emission Quantities in Bridge
jfecle
Anaysis
(2002). In thispaper, three bridges are studied from construction to end of life with a clear methodology. However, in most papers, including the previous one, do not take into account the cars emissions in the study.
Currently, there is no real methodology on how to take into account the emissions due to the cars. Those emissions could be define as the emissions "saved" by the presence of the bridge, by creating a shorter path for cars to travel, but also the added emissions due to the presence of a tollbooth or during maintenance, the traffic delays or the use of a bypass route.
The literature on that subject is almost inexistent. However, traffic on bridges are studied in an economic way. Indeed, the delays, or the bypass route lose time for people, and it has a price. Different information can be found on those studies of traffic.
The most accurate information is actually given by the government or any highway company. An important source is the City Environmental Quality Review (CEQR) Technical Manual. In the issue of 2014, chapters 16 to 19 treat the aspect of transportation and GHG emissions. However, it is not specifically about bridges but it gives numbers and it is for the city of New York. Nevertheless, it
gives data that can be used for case study and information on how to take the emission of cars into account.
The last category of papers on operation energy and maintenance would be the LCCA of bridges. For example,
The Real Price
-Holistic Cost-Eficieng Considerations in Design and Construction of
Infrastructure Projects, by Olivier Fisher, is studying the cost of traffic delays and bypass route during the
maintenance phase of bridges.
The key contribution of this thesis will be to develop the methodology to take into account the traffic in the operation and maintenance phase of a bridge. Thanks to the different LCCA and reports
Assessment Methodology for Environmental Impact of Bridges -2015
from the government, this methodology will be adapted from cost analysis, and case studies will be conducted.
Assessment Methodology for Environmental Impact of Bridges -2015
3
METHODOLOGY
As explained previously this thesis has two main goals: establishing a benchmark of embodied carbon for pedestrian bridges and road bridges separately and to develop a methodology to assess the operational carbon of road bridges including the consequences on car traffic. To achieve those goals the following methodology was used.
The first step was to gather as many information on as many bridge possible. This information include the structural material quantities, the dimension of the bridge (total length, width, span) but also the number of cars per day crossing the bridge, the lighting used, and the presence of a toll. This information can be found on the bridge website for famous bridges, on papers wrote about the bridges or by contacting the engineer or architect companies that were involved with the bridge. When it comes to the traffic, contacting highway agencies is also a good source of information.
The second step was to calculate the embodied carbon of the bridges studied. For this step, the methodology will be detailed in the next chapter. This step achieve the first goal of this thesis: creating a benchmark.
The third step was to develop the methodology for a whole life cycle carbon assessment. To achieve this step, the life cost assessment of bridges were studied. Indeed, for life cycle cost assessment (LCCA) the traffic delay, or the need of a bypass road are taken into account. The new methodology is adapted from the LCCA. In this step, three bridges will be studied and compared using the developed methodology. This step will achieve the second goal of this thesis.
A more detailed methodology for each part of the life cycle will be given at the beginning of
Assessment Methodology for Environmental Impact of Bridges - 2015
4
EMBODIED CARBON
4.1
METHODOLOGYIn this the chapter, seventeen footbridges and six road bridges will be studied. The embodied carbon represents the GHG emission during the construction stage. The following methodology has been applied to each bridge. In this phase, the same methodology is used for footbridges and road bridges.
1. Find the structural material quantities (SMQ). This a major step. Indeed, finding accurate structural material quantities for already built bridges is a challenge. However, the main aim of this methodology is so designers, architects and engineer evaluate their bridge during their process of design or just after completion. In those cases, having the material quantities will not be a challenge. The quantity of the structural material i will be SMQi.
2. Normalize the structural material quantity (NMQ). Normalizing the material quantities allows the comparison between bridges. The normalized quantity of the structural material i will be NMQi. The normalization for this methodology is to have the weight of structural material per meter squared:
SMQL [ kg ]
NMQi[kg/m2
]
Length[m]
*Width[m]
Equation 4-1 -NormaliZedMaterialQuanfiy3. Calculate the embodied carbon of each structural material (EC). To calculate the embodied carbon of each material, we need to multiply this quantity by the embodied carbon coefficient of this material. The embodied carbon of each material will be ECi and the embodied carbon coefficient of each material will be ECCi.
ECi[kgc
0~em
2 2] =NMQi[kg/m
2]
* ECCi[kgc02e/kg] Equation 4-2 -Embodied Carbon of eachmaterial
4. Calculate the global warming potential of the bridge. This is the last step to calculate the embodied carbon of the bridge. The global warming potential of the bridge is the sum of the embodied carbon of each material. The global warming potential will be GWP.
GWP
[kgco
2elm2]
= ECi[kgco
2 e/m 2]
Equation 4-3 -Global warming potential of the bfidge
Assessment Methodology for Environmental Impact of Bridges
-
2015
4.2
EMBODIED CARBON COEFFICIENTS
There are multiple database giving values for the embodied carbon coefficients. The one used
in this thesis is the database established by the University of Bath in the United Kingdom. In the last
part of this chapter, the global warming of each bridge will be recalculate using other database and
compared to the results established in this chapter.
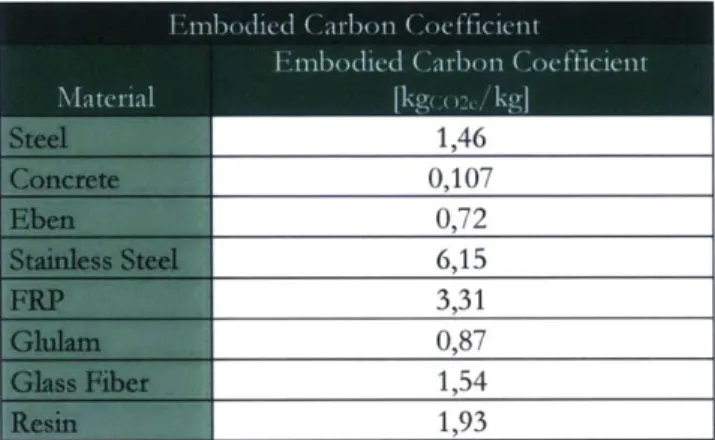
The coefficient used in the analysis are shown in the Table 4-1.
Table 4-1 -Embodied Carbon Coeficient
4.3
PEDESTRIAN BRIDGES
To be able to create a benchmark for embodied carbon for pedestrian bridges, seventeen
bridges have been compared. The details of the each bridge's material quantity and dimensions are
shown in appendix A. The foundations are not taken into account, and the bridge will not be named
to protect anonymity. Each bridge will be called using its type (Truss, girder, arch etc.).
The Graph 4-1 shows the normalized material quantities of all the bridges per floor area. The
bridges are ordered from the smallest to the largest span. There is not a clear trend between the span
of the bridge and the material quantities used. The table giving the details is in appendix B.
Assessment Methodology for Environmental Impact of Bridges
-
2015
Normalized Material Quantities
900 800 700 600 500 tk 400300
i
S200 M x N\q \11 \ N 2- -81" - '\N Cy ' 6Sse Z C Y SC~ 9Glass Hbir CRP S Timbfcrct StRIiCturMi SIMdGraph 4-1 -Normai
Zed
MaterialQuanities, per SpanNow that the normalized material quantities for each bridge has been established, the global warming of each bridge can be calculated. The Graph 4-2 shows the global warming potential of each
bridges, ordered from the smallest to the largest span. Details can be found in appendix C.
Global Warming Potential
2500
1000
1500
1000 500 '-C, '~
A. -1Graph 4-2 -Pedestrian Bridges Global Warming Potential
As the Graph 4-2 shows, there is not any direct trend between the span of the bridge and the Global Warming Potential of the bridge. Different conclusions can be drawn from this graph. First, there is no direct link between the material quantity used and the global warming of the bridges. For example, the girder bridge 8 has the highest total weight in material quantity; however, its global warming potential is especially low. To go into more details, the Graph 4-3 is showing the global warming potential of each pedestrian bridge by showing the impact of each material.
Assessment Methodology for Environmental Impact of Bridges
-
2015
Global Warming Potential
2500 Glass Fiber 2000 1500
1000
3
Stainless Steel3
500 . 'Timber 0 N Concrete 1$ Structural SteelGraph 4-3 - Pedestrian Bridges Global Warming Potentialper Material
Two bridges stand out in the last two graphs: the girder bridge 4 and the double helix. This is mainly due to the material used more than to the quantity of material used. Indeed, the girder bridge 2 is entirely built out of fiber-reinforced plastic (FRP). This material has a high embodied carbon coefficient, which means that many emissions of GHG are created during its production. The same way, the double helix bridge has been made partially out of stainless steel. Stainless steel also has an important ECC. Those materials are used for different reasons: a better performance, no maintenance and so on. Looking only at the construction stage does not give us enough information of their efficiency. Indeed, it is possible that in the future, no maintenance will be needed on the double helix bridge and less emissions of GHG will occur during the maintenance stage than for the other bridges. Since these two bridges stand out, they will not be taken into account in the rest of the study. When it comes to the use of FRP, it will supposedly increase the life span of the bridge. However, this is a new material and nothing has been fully established yet.
The Graph 4-4 shows the global warming potential of the different pedestrian bridges.
Thanks to this graph, an average of global warming potential per pedestrian bridge can be established. The average value of global warming for pedestrian bridges is 419 kgco2e/m
2
.
Another way to establish a benchmark would be to analyze each type of bridge separately or
Assessment Methodology for Environmental Impact of Bridges
-
2015
Global Warming Potential
1200 1000 800 600 L 400 200Graph 4-4 -Pedestrian Global Warming Potential without extremities
The Graph 4-5 shows the global warming potential range per type of bridges. However since there is only one hybrid bridge no conclusion can be taken for that type of bridge. The more interesting range concerns the girder bridge since seven of them have been studied and it is the most common type of pedestrian bridges. The average global warming potential for that type of bridge is
569kgco2e/m2. It is above the average define for all pedestrian bridges. Moreover, the range goes from 200 kgco2e/m2 to almost 1000 kgco2e/m2. This shows that there is not any real trend between the type of bridge and the global warming potential link to it.
Assessment Methodology for Environmental Impact of Bridges
-
2015
Global Warming Potential
-
Per
type
0 1200 1000 5 800 1 600 400 200 0
-o
10-?
bt~-o
HGraph 4-5 - Pedestrian Bridge Global Waning Potential/ Per Type of Bridge
The main conclusion that can be drawn from the Graph 4-5 is the efficiency of a truss bridge
compared to any other bridge. This is mainly because truss bridge are more efficient towards their
material use than any other type of bridge.
The Graph 4-6 shows the range of GWP for pedestrian bridges by range of span. There is
a
clearer trend than for the previous graph. Indeed, this graph shows that the GHG emissions increase
with the span of the bridge. It means that having more piles and smaller span may be an advantage
when it comes to the global warming potential of the bridge. However, as stated as the beginning of
this chapter, the material quantities of each bridge are given without the foundation. Adding more
piles requires more material quantities and most of the time, more concrete. If the conditions of
the
ground are not advantageous than it can be the most important part of the project.
In conclusion, to be able to drawn any results from the Graph 4-6 it would be essential to have
the material quantities of the piles of each bridge.
Assessment Methodology for Environmental Impact of Bridges
-
2015
Global Warming Potential
-
Per Span
1 200
1000
800 A I 6000
400 200 0 -- ---- - - ---- --- -V1 V1 ViGraph 4-6 -Pedestrian Bridge Global Waming Potential!/ Per Span
When it comes to pedestrian bridges, the benchmark established is 419 kgco2e/m
2. However,
different studies can be made to have benchmarks
more
appropriate to each bridge and its properties.
Indeed, a truss bridge would probably have higher expectations when it comes to global warming
than a girder bridge. Each of this parameter has to be taken into account; nonetheless, to be able to
establish these different values, each category requires its own study.
4.4 ROAD BRIDGES
To be able to create a benchmark for road bridges, the same methodology is used. Indeed,
while calculating the GWP of a bridge there is not much difference between a pedestrian bridge and a
road bridge since it only takes into account the construction stage. Six bridges are studied and
compared in this section. Moreover, in the case of the road bridges the foundation are taken into
account because more data is available on road bridges than on pedestrian bridges. Finally, in the case
of the road bridges all the bridges are called by their name because all the information used is public.
The details of each bridge material quantities are given in appendix D.
Assessment Methodology for Environmental Impact of Bridges
-
2015
The Graph 4-7 shows the normalized material quantities of each bridge. The bridges are
ordered from the smallest to the largest span. Like for the pedestrian bridges there is not a clear trend
between the span and the material quantities. However, it seems that two categories stands out. For
the span under 1000 m (all bridges until the Sydney Harbour bridge included) the material quantities
are under 6000 kg/m
2and for the span above 1000 m (the Golden Gate Bridge and the Akashi
Kaikyo Bridge) the material quantities are above 10 000 kg/m
2. The details of the normalized material
quantity are given in appendix E.
Normalized Material Quantities
14000 12000 10000 80002
6000*
Steel : 4000M
Concrete 2000 0Graph 4-7 -Road Bridges Norma/i Zed MaterialQuantiies
Now that the normalized material quantities for each bridges has been established, the GWP of
each bridge can be calculated. The Graph 4-8 shows the global warming potential of each bridges,
ordered from the smallest to the largest span. The table giving the details is in appendix F.
Assessment Methodology for Environmental Impact of Bridges
-
2015
Global Warming Potential
4500 -g 4000 a 3500 3000 2500 -2000 1500 1000 500 0I II
1.1
vix1
Graph 4-8 -Road Bridges Global Warming Potential
If we compare Graph 4-7 and Graph 4-8, we can see that the order is respected: the bridges with more material quantities have a higher GWP. This makes a lot of sense when we look at the material quantities. Indeed, the steel is considered the same for all bridges as well as the concrete. Moreover, on the Graph 4-8, as established for the Graph 4-7, the global warming potential is increasing with the span. The average global warming potential is 1986 kgco2e/m2.
The Graph 4-9 is showing the influence of each material. The steel has a higher ECC (1.46) than the concrete (0.13). However, the quantity of steel needed for a structure to be stable is most of the time less than the quantity needed for concrete.
Global Warming Potential
7-
E
4500 4000 3500 3000 2500 2000 1500 1000 5000
" Stec] " Concrctc 4k
3
NGraph 4-9 -Road Bridges Global Warming per Material
Rosalie Bianquis
; 014
up
O p
-V
O
01M.Eng Thesis
36
Assessment Methodology for Environmental Impact of Bridges
-
2015
Another analysis is to compare per range of span, as it was done for the pedestrian bridges.
The Graph 4-10 shows the ranges of GWP per ranges of span.
Global Warming Potential
-
Per Span
4500 4000 3500 3000 2500 4 1500 1000 500 VV VI
Graph
4-10 -Road Bridges Global Warming Potentialper Span
This graph shows once again that the global warming potential can be divided in these two
categories. However, since only six bridges are studied, no universal conclusions can be drawn. In
future research, more case studies will be necessary to verify these preliminary results. The average for
bridges under 1000 m span is, according to these data, 1347 kgco2e/m
2, and the average for the
bridges above 1000 m span is 3446 kgco2e/m
2. These two values are really far from each other and
represents two different benchmark for road bridges.
To conclude, when it comes to road bridges, two benchmark have been established: 1422
kgcO2e/m2 for bridges with a span that isless
than 1000 m and 3661 kgco2e/m2 for bridges with aspan that is more than 1000m. Like for pedestrian bridges, more studies should be made to have
more accurate benchmark.
Moreover, when it comes to road bridges the maintenance and operation have a higher weight
than for pedestrian bridges and can have a significant impact on the emission of GHG over the life
of the bridge. Indeed, most of these bridges are built to avoid a detour for cars, which means that
Assessment Methodology for Environmental Impact of Bridges -2015
most of them are built for convenience purposes. The maintenance of road bridges might force the cars to take an alternative, longer route to go from one point to another. This will be the subject of the next chapter, chapter 0.
4.5
COMPARISON WITH OTHER DATABASE OF EMBODIED CARBON
COEFFICIENTS
All the benchmarks established previously in this chapter are based on the ICE ECC of the
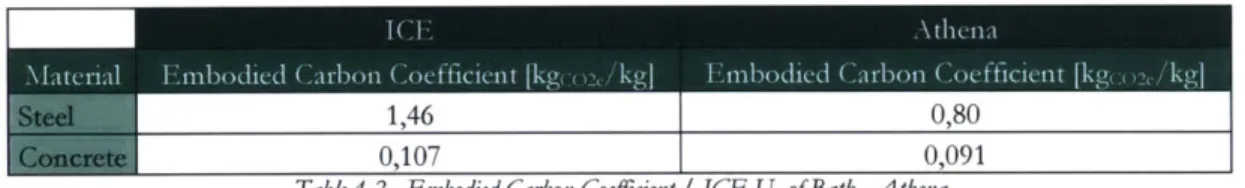
University of Bath. However, there is a number of different databases in the world and these benchmarks are not true in any other database. The difference between the different databases can be significant. To see how different the results can be, the global warming potential of the road bridges has been calculated with the ECC of Athena. The ECC of the ICE of the University of Bath and of Athena are shown in Table 4-2. This table shows how different the ECC can be.
1,46
0,80
0,107
0,091
Table
4-2
-Embodied Carbon Coeficient
/
ICE U. of Bath
-Athena
The Graph 4-11 shows the GWP of the road bridges using the Athena ECC while the Graph
4-12 shows the GWP of the road bridges using the ICE U. of Bath ECC as done earlier in the chapter. The average GWP of the road bridges using the Athena is smaller than the one using theICE U. of Bath ECC. Indeed, for Athena the benchmark would be 1269 kgco2e/m
2and for the ICE
the benchmark is 1989 kgco2e/m2.However, the order of the bridges stay the same: The one who hadthe highest GWP for the ICE ECC still has the highest GWP with the Athena coefficient.
Assessment Methodology for Environmental Impact of Bridges
-
2015
Global Warming Potential
3000 2 2500 "000 15001000
500'''Eu'
Graph 4-11 -Global Watming Potential
/
Athena ECCGlobal Warming Potential
4500 -- 4000 3500 - 3000~
-. 25008
s2000 1500 10001500
10
Graph 4-12 -Global W/arming Potential
/
ICE U. of Bath ECCThis shows that the values are not the same depending on the ECC used. All the values previously determined in this chapter can only be used when the GWP of the bridges are calculated using the ICE of the University of Bath ECC are used.
This chapter created different benchmarks for pedestrian bridges and road bridges. However, it
only gives information about the construction stage of the bridge. The next chapter will focus on the operation phase and the maintenance of bridges.
Assessment Methodology for Environmental Impact of Bridges -2015
5
OPERATION AND MAINTENANCE
In this chapter, the operation phase and the maintenance phase of the bridge life. The operation represents the energy needed to have lights on the bridge, or the electricity needed for the operation of a tollbooth or any other energy needed during the life of the bridge. The maintenance takes into account the replacement of the materials and the emissions due to the perturbation of the car traffic. Because the maintenance phase has a more important impact for road bridges than for pedestrian bridges, the methodology developed in this chapter will be focused on road bridges. After the
development of the methodology, three case studies will be conducted, analyzed and compared.
5.1
METHODOLOGY FOR A WHOLE LIFE CYCLE CARBON ASSESSMENT
This part will develop the methodology for the whole life cycle carbon assessment of bridges expect the demolition which is out of the scope of this thesis. It will also take into account the benefits brought by a bridge.
5.1.1 Construction Stage
The first stage of the bridge is the construction. The emission during the construction stage includes the global warming potential calculated in the previous chapter. The emission of the construction stage are divided in four categories as shown in Equation 5-1.
= ECuat
+
ECuaC+
ECrra+
Ecoth Equation 5-1 -Total Emission during Construction StageEcMat: Emission due to the structural materials ECMac: Emission due to the use of machines
ECTra: Emission due to the transportation of the material EcOth: Emission due to other factors
Assessment Methodology for Environmental Impact of Bridges -2015
5.1.1.1
Emission due to structural
materials
EcmatThis represent the GWP calculated in Chapter 4. The information needed to calculate ECMat are summarized in Table 5-1.
kgcoia/kg
1
Table 5-1 -Information needed for EcvAf,
The methodology was developed in the previous chapter, and is reminded below.
1. Normalize the material quantity:
NMQi[kg/m
2]
=
MaterialQuantity[kg]
Equation
5-2 -Normaltz!edMaterialQuantiy
Length[m]
*
Width[m]
2. Calculate the embodied carbon for each structural material:
ECi[kgco
2e/m 2]
=NMQi[kg/m
2]
*
ECCi[kgco
2e/kg]
Equation 5-3 -Embodied Carbon3. Calculate EcMat:
EcMat [kgco
2e/m2] =
ECi [k9co
2e
/m2] Equation 5-4 -Emission due to the structural materials5.1.1.2
Emission due to
the
use ofmachines
EcMUcThese emissions represent the emissions due to the electricity needed for the construction, for example for a crane. The information needed to calculate Ecmac are summarized in Table 5-2.
Assessment Methodology for Environmental Impact of Bridges -2015
Table 5-2 -Information neededfor Ecm,
The methodology is shown below. The value of the emission factor given by the EPA of the United State is 0,69 kgco2,/kWh.
1. Calculate the energy needed for each machine:
Ei[kWh] = Energy[kW]
*
Hours[h]
2. Calculate the emission for each machine normalized:
EMaci[kgco
2 /m2]
=E i[ kW h] * Emission[
k9co2elkW h]
Ek
hm]
Emsion[kg /]
* Equation 5-6 -Emission per machineLength[m]
*W idth[m]
3. Calculate Ecmac:
ECMac[k9CO
2e/m2] =
I EMaci
[kgco
2,/m 2]
Equation 5- 7 - Emissions due to the use of machines5.1.1.3
Emission due to the transportation of the materials
Ec,,.These emissions represent the emissions due to the trucks carrying the materials. It mainly depends on where the materials are coming from. The information needed to calculate EcMaC are summarized in Table 5-3.
Table 5-3 -Information neededfor Ecrrm
Rosalie Bianquis
Equation 5-5 - Enery neededper machine