HAL Id: halshs-02364812
https://halshs.archives-ouvertes.fr/halshs-02364812
Preprint submitted on 15 Nov 2019
HAL is a multi-disciplinary open access
archive for the deposit and dissemination of sci-entific research documents, whether they are pub-lished or not. The documents may come from teaching and research institutions in France or abroad, or from public or private research centers.
L’archive ouverte pluridisciplinaire HAL, est destinée au dépôt et à la diffusion de documents scientifiques de niveau recherche, publiés ou non, émanant des établissements d’enseignement et de recherche français ou étrangers, des laboratoires publics ou privés.
Oulimata Ndiaye
To cite this version:
Oulimata Ndiaye. Gender gap in public good preferences in Africa: Do gender norms matter?. 2019. �halshs-02364812�
C E N T R E D' ÉT U D E S E T D E R E C H E R C H E S S U R L E D E V E L O P P E M E N T I N T E R N A T I O N A L
SÉRIE ÉTUDES ET DOCUMENTS
Gender gap in public good preferences in Africa:
Do gender norms matter?
Oulimata Ndiaye
Études et Documents n° 22
November 2019
To cite this document:
Ndiaye O. (2019) “Gender gap in public good preferences in Africa: Do gender norms matter?”,
Études et Documents, n° 22, CERDI.
CERDI PÔLE TERTIAIRE 26 AVENUE LÉON BLUM F-63000 CLERMONT FERRAND TEL.+33473177400 FAX +33473177428 http://cerdi.uca.fr/
2
The author
Oulimata Ndiaye
PhD Student in Economics, Université Clermont Auvergne, CNRS, CERDI, F-63000 Clermont-Ferrand, France.
Email address: oulimata.ndiaye@etu.uca.fr
This work was supported by the LABEX IDGM+ (ANR-10-LABX-14-01) within the program “Investissements d’Avenir” operated by the French National Research Agency (ANR).
Études et Documents are available online at: https://cerdi.uca.fr/etudes-et-documents/
Director of Publication: Grégoire Rota-Graziosi Editor: Catherine Araujo-Bonjean
Publisher: Mariannick Cornec ISSN: 2114 - 7957
Disclaimer:
Études et Documents is a working papers series. Working Papers are not refereed, they constitute
research in progress. Responsibility for the contents and opinions expressed in the working papers rests solely with the authors. Comments and suggestions are welcome and should be addressed to the authors.
3
Abstract
I present new evidence on how norms and traditions can affect women’s public good preferences in Africa. A substantial literature has examined the determinants of gender differences in political attitudes. Existing work has found a gender gap in public good preferences. However, there are few attempts to explain this gap. In this article, I aim to investigate whether the preferences of men and women differ in Africa, and if so, to explore the source of the observed gender differences. The choice of Africa is meaningful as very few works on gender preferences have been done in this region where the weight of tradition is strong regarding the role of men and women in the society. Using Afrobarometer data for 36 African countries, I investigate whether and how the preferences of men and women differ. The results show that norms about the role of women play a role in explaining differences in gender preferences. Women in Africa have systematically a preference for social field (education, health) and less preference for additional investment in infrastructure, regardless of their level of empowerment or the prevailing norm on gender role. However, in countries where gender norms are less favorable to women, women report higher preferences in agriculture, closing the gender gap with men.
Keywords
Gender gap, Social norms, Tradition, Policy priorities.
JEL Codes
H41, J16, O15, O55.
Acknowledgments
I thank Ababacar Sedikh Gueye and Jules Gazeaud for their useful suggestions and remarks. I am grateful to my thesis supervisors, Théophile Azomahou and Bity Diene, for their helpful guidance. I also thank the CERDI’s PhD students and conference participants at IAFFE (Glasgow) and AFSE (Orléans) for helpful discussions and comments.
1. Introduction
Differences in values and political behavior between men and women have long been subjects of study in Western societies and in India, but few have been done in Africa. A well-established literature supports that women’s preferences and choices differautomatically from those of men. Women are more likely to request government spending in social issues like health, child support, social protection etc. (Abrams and Settle, 1999; Lott and Kenny, 1999; Besley and Case, 2000; Toke and Dallal, 2008; Funk and Gathmann, 2010). However, little is known from the academic literature on what explain such gender differences in policy preferences. Are women more social because of innate factors or rather because of their background or their level of empowerment? Potential candidates to explain this gender gap include the greater risk aversion of women (Jianakoplos and Bernasek, 1998; Byrnes et al., 1999) implying a stronger desire for insurance and women's lower expected incomes leading to redistributive support. Gottlieb et al. (2018) show in a sample of African countries that the gender gap in policy preferences is smaller when women are less vulnerable and participate more in the labor market. Conversely, Cavalcanti and Tavares (2011) in a cross-country study, argue that the rise in female labor participation leads women to demand additional government spending in social services (education, healthcare, care for the elderly). In this paper, I hypothesize that gender norms and the global view about gender role in the society might be a mechanism explaining gender differences in public good preferences in Africa. The weight of social norms and old traditions is particularly strong in Africa. Gender roles inside the family or in the community can be considered as key factors contributing to a gender gap in several dimensions observed in Africa. The objective of the paper is therefore to provide some empirical evidence on the interaction between socially constructed gender roles in Africa and the gender gap in public good preferences.
Gender norms are interpreted as social and cultural constructions of the ways women and men are expected to behave. They influence the living conditions of men and women, determine their position in the society and their access to material resources (credit, land, training, etc.) and immaterial resources such as power. The implications in everyday life are multiple: level of education and opportunities for professional advancement, distribution of domestic and
extra-domestic work and family responsibilities, insertion into the power structures and capacity for negotiation and decision-making etc. Gender norms governing the interpretation of the appropriate behavior of women and men are closely linked to socially constructed concepts of family altruism and self-interest. Academic literature has shown several times that women are more likely than men to endorse policies that support the provision of social services for disadvantaged groups (Goertzel,1983; Shapiro & Mahajan, 1986; Schlesinger & Heldman, 2001), in particular on child care, educational opportunity, access to housing, and welfare. (Goertzel, 1983; Sapiro, 2003; T. W. Smith, 1984) found that women are also more hostile to violence, in particular on warfare, the death penalty, and domestic violence, and advocate protections from violence, such as gun control (Goertzel, 1983; Sapiro, 2003; T. W. Smith, 1984). Moreover, (Swim, Aiken, Hall, & Hunter, 1995; Twenge, 1997a) noted that women are more favorable than men toward equal rights for women and also for gays and lesbians (Herek, 2002; Kite & Whitley, 1996). As suggested by (Oliver & Hyde, 1993; Seltzer et al., 1997) women also condemn more severely behaviors traditionally considered immoral for example casual sex and pornography.
To my knowledge, there are very few studies of women's political behaviors in Africa, either to understand differences of attitude between men and women in terms of political priorities or the impact of this gender gap in the development process. Africa is currently undergoing rapid change. Societies and the role that women play within them are also changing. Today, in Africa, women have greater freedom of action and expression in their families and society. This development is reflected in particular by the increase in the average age of marriage; better social and legal recognition of the various forms of unions; the drop in the birth rate, women being better able to choose if they want to have children, when and how much; and strengthening women's economic independence. These developments are both causes and consequences of large-scale demographic, normative and ideological changes, women's and girls' access to education and employment, as well as often motivated legal reforms sometimes inspired by women's activism. This change has shifted the balance of power within households, strengthened women's economic security and their weight in decision-making. All these factors make the issue of the role of gender norms in gender differences in public good priorities an important research question.
To answer this question, I use data from the last round of the Afrobarometer surveys collected between 2014 and 2016 in 36 African countries. Using multilevel models to consider
gender norms at the country level and to account for the correlation of preferences within the same country, I find that preferences in public goods are indeed very gendered. On average, men and women with the same characteristics have different preferences with women preferring additional public investment in education and health while men preferring investment in infrastructure and agriculture. To capture gender norms, I construct a measure of the perception of gender role through a question on the opinion of women leadership in the Afrobarometer survey. I also use as robustness tests the Social Institutions and Gender Index (SIGI) developed by the Organisation for Economic Co-operation and Development (OECD), as an alternative measure of gender norms. My results suggest that gender norms in Africa play a role only in the preferences for agriculture and do not affect gender preferences in education, healthcare and infrastructure. Women living in countries with a traditional view of gender role request more additional investment in agriculture. This finding is driven by the rural area and is consistent with mechanisms related to the feminization of agriculture and the limited access to productive resources of women farmers which are prevalent in more conservative countries.
The paper is organized as follows: section 2 provides a literature review, section 3 presents the data and some descriptive statistics, section 4 describes the empirical strategy, section 5 reports and discusses the results, section 6 provides a brief discussion on some mechanisms explaining the results, section 7 concludes.
2. Related literature
Differences in values and political behavior between men and women have long been subjects of study in Western societies. Several economic studies on gender preferences show that women are more concerned about social policy issues (Funk and Garthmann, 2006, 2010, 2007; Oskarson and Wängnerud, 2013). Lott and Kenny (1999), Abrams and Settle (1999) and Toke and Dallal (2008) in their respective studies also show that women have a preference for social spending relative to other types of public spending. The literature on women's representativeness has examined the impact of the gender composition of the electorate by using the introduction of suffrage as an exogenous change in the composition of the constituency. These studies have shown an effect of a strong representation of women on public spending choices. For example, Besley and Case (2003) use US state panel data and show that an increase in women's representation in decision-making improves homemaker spending and reinforces the child support benefit. In the same vein, a study
conducted on Sweden by Esaiasson and Holmberg (1993) find that women parliamentarians are significantly more receptive to family and environmental laws than men. Funk and Gathmann (2010) show that the policy of female leaders on Switzerland affects the composition of public expenditure by increasing spending on health and social protection. Svaleryd (2007) shows from survey data in Sweden that women have a greater preference for public social spending than men. Thus, the demand for public social spending tends to increase when the women’s level of representation in parliament increases. Women's suffrage in the United States has led policy-makers to focus on juvenile and maternal health and has helped reduce child mortality (Miller 2008).
A large part of the literature has confirmed the role of women in politics, especially on bills in the United States. From an empirical analysis, Thomas (1991) shows that states with higher female representation tend to introduce and pass bills dealing primarily with women, children and families. In a study based on 12 states Thomas and Welch (1991) also find that compared to men, women attach more importance to legislation concerning their status, family issues and children. Besley and Case (2000) show that policies on workers' compensation and child support are more likely to be introduced in states with high rates of women in parliament.
Literature in developing countries
Further studies of the effect of women's representation in decision-making on policy choices have been conducted in developing countries such as India. Clots-Figueras (2008a, 2008b) finds that women's elected representatives have a totally different influence from that of their male counterparts on political decisions and public spending. Indeed, he shows that women invest more than men in children's education and health care. In addition, women's elected representatives who occupy the seats reserved for castes and disadvantaged tribes invest more in health and education. Chattopadhyay and Duflo (2004) also study the importance of women's political representation on local public spending choices in a province of India. They use political reserves for women in India to study the impact of women's leadership on political decisions. They show that the occupation of a council seat affects the types of public goods provided. More specifically, female leaders will invest more in goods linked to their own concerns, such as access to safe drinking water, maternity and health. Iyer et al. (2011) find that an increase in the representation of women in local
government significantly reduces crimes against women in India, thus promoting access to justice for women.
Causes of gender differences
A complementary literature sought to test and understand the causes of these differences in gender preferences. Edlund and Pande (2002) and Edlund, Pande and Haider (2005) focus on the role of marriage models in explaining why women demand more social goods. For several years, marriage has been declining. This decline is due both to the increase of the number of divorces but also to the possibility of being able to form other types of unions including pacs (civil solidarity pact) or concubinage. These changes have enriched men, while women have become poorer and especially confronting with greater uncertainty about their income. Economic theory implies that it will then require greater income redistribution and more family-based social spending, which may explain the changes in public spending. Edlund and Pande (2002) find that after divorce, women become more socialist. On the other hand, Cavalcanti and Tavares (2011) explain the increase of the social expenses by the opening of the labor market to women. In fact, greater participation of women in the labor market increases their demand for public goods that could reduce the cost of housework, for example childcare. The data seem to corroborate both hypotheses in a sample of countries as well as at the individual level. All these results show that the socio-economic environment in which women live can affect the gap between their political preferences and those of men. Gottlieb and al. (2018) find that the absence of women in the labour market and their social vulnerability are the main causes of the differences in preferences between men and women.
3. Data and Descriptive Statistics
The Afrobarometer surveysTo carry out my empirical analysis, I use data from the round 6 of the Afrobarometer survey. This survey took place in 36 African countries between 2014 and 2016. In total 53,935 individuals were interviewed in these following countries: Algeria, Benin, Botswana, Burkina Faso, Burundi, Cameroon, Cape Verde, Cote d'Ivoire, Egypt, Gabon, Ghana, Guinea, Kenya, Lesotho, Liberia, Madagascar, Malawi, Mali, Mauritius, Morocco, Mozambique, Namibia, Niger, Nigeria, São
Tomé and Príncipe, Senegal, Sierra Leone, South Africa, Sudan, Swaziland, Tanzania, Togo, Tunisia, Uganda, Zambia, Zimbabwe. It is a face-to-face interview where the questions are in the local language. Samples are randomly drawn to be nationally representative and stratified by gender to ensure a well-balanced sample by gender.
Dependent variable: Priority for investment
The main dependent variable is the respondents’ priority for government’s investment. To build this variable, I use question Q65A of the survey, which is: “If the government of this country could increase its spending, which of the following areas do you think should be the top priority for additional investment?” Each respondent was asked to give one of the following seven responses: 1= Education, 2=Infrastructure, like roads and bridges 3= Security, like the police and military, 4=Healthcare, 5=Agricultural development, 6=Energy supply, 0=None of the above. In this paper, I keep the four most reported priorities which are Education, Healthcare, Infrastructure and Agriculture. The other policy areas appear in very low proportions in the data. Table 1 presents the distribution of respondents’ public goods priorities as a function of their gender. For each of the four public goods, the priority variable is equal to 1 if the respondent has selected the given public good as the top priority for additional investment, and 0 otherwise. Education and health are by far the most requested public goods. 36.7% of respondents prefer that the state invest more in education and 20.8% of them demand more investment in health. Infrastructure and agriculture are less reported than education and health but an important part of the respondents ranked them as top priority (respectively 14.0% and 12.9%).
As regard to the distribution of public good preferences by gender, a striking point is that all the differences are strongly significant at the 1% level suggesting that men and women do not rank public priorities in the same way. Women request more investment in education and health. The difference in the proportion of men and women is 1.4% for education and 2.7% for health. Conversely, men request more investment in infrastructure and agriculture. The difference is 1.6% for infrastructure and 1.9% for agriculture.
Table 1: Top priority for additional investment by gender Total (%) Female (%) Male (%) Difference (%): Female - Male Education 36.7 37.4 36.0 1.4*** Healthcare 20.8 22.2 19.5 2.7*** Infrastructure 14.0 13.2 14.8 -1.6*** Agriculture 12.9 11 .9 13.8 -1.9*** * p<0.1, ** p<0.05, *** p<0.01
As robustness checks, I consider the top two priorities for additional investment as dependent variable rather than only the first priority. This allows accounting for a broader pattern of respondents’ opinion. For this, I use questions Q65A which refers to the first priority and Q65B which refers to the second priority. In this case, the dependent variable takes 1 if the respondent has selected the given public good as the first or the second priority, and 0 otherwise. Table 2 shows the distribution of public good preferences across gender according to this second indicator. The general pattern is closed to what we observe in Table 1. Women request more spending in education and health and less spending in infrastructure and agriculture. Furthermore, the differences between men and women are greater in Table 2 compared to Table 1.
Table 2: Top priority for additional investment by gender – First and second priorities Total (%) Female (%) Male (%) Difference (%): Female - Male Education 54.7 55.8 53.5 2.3*** Healthcare 50.2 52.4 48.0 4.4*** Infrastructure 27.2 25.6 28.9 -3.3*** Agriculture 28.9 27.3 30.5 -3.2*** * p<0.1, ** p<0.05, *** p<0.01 Explanatory variables
The key explanatory variable is gender. In the sample, 49.7% are men and 50.3% are women. The choice of the additional explanatory variables is based on the previous literature in this field. As standard independent variables, I include age, education, residence area, employment status and income.
Education is divided into four categories: "no formal education" which includes 19.0% of the people, "primary" (28.9%), "secondary" (42.1%) and "university" with the lowest proportion (9.8%) of the sample. Employment status has four categories: employed full time, employed part time respectively 27.0% and 11.9% of the sample and unemployed (37.5%) and looking for jobs (23.2%). I expect that education and access to employment reduce significantly the gender gap in public good preferences because educated and empowered women have a greater interest in policies such as infrastructure investment compared to women whose livelihoods primarily depend on their spouse or extended family (Gottlieb et al. 2018). To look at whether the public good preferences are associated with the people's experience, I group individuals into the following four different categories of age: 25 or below, 26 – 35, 36 – 50 and above 50 years old. Regarding the place of residence, I distinguish people living in rural areas (57.9%) versus urban areas (42.1%). I build and income index using a multiple correspondence analysis (MCA)with variables reflecting the wealth of the respondent’s household like ownership of some goods (radio, TV, car, mobile phone), the source of water, the location of toilet and the type of shelter. I also use a variable indicating the perception of the respondent of his/her living conditions compared to other people in the country. 35.1% think that their living condition is worse and 30.3% think that they are better off.
A special emphasis is put on the opinion regarding the role of women in the society. This variable is measured with the question Q18 of the Afrobarometer survey. In this question, the respondent is asked to choose the statement which is closest to his/her view between the two:
i. "Men make better political leaders than women, and should be elected rather than women" ii. "Women should have the same chance of being elected to political office as men"
In this paper, I make this variable indicating a positive perception of women role. It takes 1 for the second statement and 0 for the first statement. 66.3% of the sample think that women should have the same chance to be elected as men while 31.2% think that men make better political leaders. Women are more likely to have a positive view of their role. 74.6% of women think that women can be as good as men while this proportion is only 61.3% for men. The difference of means is significant at the 1% level. This difference between men and women in this gender opinion is even larger than the difference between urban and rural area. This evidence demonstrates the importance of the gender gap. Unsurprisingly, people in urban areas have a more modern view of gender role
compared to people in rural areas. 70.9% of people living in urban areas have a good opinion of women leadership compared to 65.9% in rural areas.
The proportion of people with a good opinion of female leadership is very heterogeneous among the 36 countries of the study sample (Table 3). On average, 67.7% of the respondents have a positive opinion on women leadership in a country. Countries like Algeria, Sudan, Egypt or Niger have the lowest proportion of individuals with a good opinion of female leadership. Cabo Verde has the highest proportion (92.7%).
Table 3: Proportion of individuals having a good opinion of women leadership by country
Country Proportion of respondents
with a good opinion of women leadership (%)
Country Proportion of respondents
with a good opinion of women leadership (%)
Algeria 37.4 Cameroon 69.6
Sudan 43.5 Ghana 70.5
Egypt 44.1 Sao Tome and Principe 71.2
Niger 45.0 Mozambique 71.4
Nigeria 50.5 Zambia 72.5
Liberia 57.7 Benin 72.9
Mali 58.1 South Africa 73.3
Lesotho 59.9 Burundi 73.6
Sierra Leone 60.7 Uganda 74.9
Burkina Faso 60.8 Kenya 77.9
Madagascar 61.1 Swaziland 78.8
Guinea 61.5 Namibia 79.5
Malawi 62.5 Cote d'Ivoire 79.8
Tunisia 63.2 Mauritius 79.8
Senegal 66.2 Botswana 84.7
Morocco 67.2 Gabon 87.3
Tanzania 69.0 Togo 88.3
Zimbabwe 69.6 Cape Verde 92.7
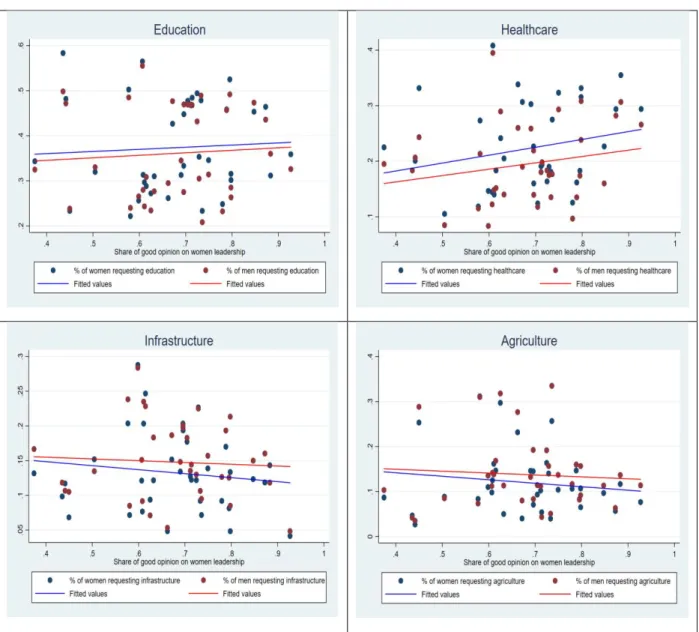
Figure 1 shows how the perception of women leadership in the country shifts the gender gap in policy preferences. Except education, gender norm in the country appears to be correlated with the gender gap in policy preferences. For the preferences in healthcare, infrastructure and agriculture, the gender gap increases when the share of good opinion of women leadership is high. This descriptive evidence suggests that the preferences of women are more distant than that of men in countries with progressive gender norms i.e. gender norms favorable to women. Education is the
only policy domain in which the gender gap does not appear to be related to the level of gender norms in the country.
Figure 1: Gender gap in policy preferences according to gender norm
4. Empirical Strategy
To measure the impact of gender on priority for additional investment, I follow recent developments in this literature using a multilevel model. Given the data used in this paper and the research question, a multilevel model has several advantages over a classical regression model. First, the data are collected with a multilevel structure. Surveys are done separately for each country and sometimes in different years. A multilevel model is a natural way to account for this data
structure. Second, a multilevel model offers a convenient way to account for the correlation of individuals within the same country. And finally, the multilevel level model provides a coherent framework to include variables in different levels (typically individual and country level variables). The basic equation estimated in this paper is written as follows:
𝑦𝑖𝑗 = 𝛼0𝑗+ 𝛽1𝑓𝑒𝑚𝑎𝑙𝑒𝑖𝑗 + 𝛽2𝑋𝑖𝑗 + 𝜀𝑖𝑗 𝛼0𝑗 = 𝛽0+ 𝑢𝑗 (1) Index 𝑖 denotes the individual and 𝑗 the country.
𝑦𝑖𝑗 is a binary variable indicating whether a given public good is reported among the top priorities for additional government spending. Recall that four public goods are studied in this paper: education, health, infrastructure and agriculture. I aim to measure the impact of gender for each priority for government spending, therefore four different equations are estimated. For instance, for the regression on education, 𝑦𝑖𝑗 takes the value 1 if for the respondent 𝑖 in country 𝑗, education is a priority for government spending and 0 otherwise.
𝑓𝑒𝑚𝑎𝑙𝑒𝑖𝑗 is the main variable of interest and is equal to 1 for female and 0 for male.
𝑋𝑖𝑗 is a set of individual characteristics including the age of the respondent, the residence area (urban vs rural), the employment status, the education level, a wealth index and the perception of the living conditions compared to other people in the country.
𝜀𝑖𝑗 is an error term at the individual level.
𝛼0𝑗 is a term reflecting the hierarchical feature of the model. It denotes the fact that each country 𝑗 has its own intercept. 𝛼0𝑗 can be decomposed into a simple intercept 𝛽0 and a country-varying intercept 𝑢𝑗. 𝑢𝑗 is a random effect and is assumed to be independent of the individual error term 𝜀𝑖𝑗.
Since the dependent variable is binary, a multilevel logistic regression is used to estimate the impact of gender on priority for additional investment. The coefficient 𝛽1 indicates how likely women answer that a given policy area should be the top priority for government spending. 𝛽1 positive
indicates that women claim more additional investment in a given area than men and 𝛽1 negative denotes that women claim less additional investment.
A second step of this study is to lighten which factors explain the potential difference of preferences between men and women. An interest is given to the opinion on gender role in the society. The question of interest is how the impact on gender on political preferences depends on the country’s attachment to conservative views on gender role. The main variable used to capture this aspect is the opinion of people in a given country on whether women could be as good political leaders as men. To measure the impact of this variable on the difference on political preferences between men and women, an interaction term is introduced in equation (1):
𝑦𝑖𝑗 = 𝛽0+ 𝑢𝑗+ 𝛽1𝑓𝑒𝑚𝑎𝑙𝑒𝑖𝑗 + 𝛽2𝑋𝑖𝑗 + 𝛽3𝑤𝑜𝑚𝑒𝑛_𝑙𝑒𝑎𝑑𝑒𝑟𝑗+ 𝛽4𝑓𝑒𝑚𝑎𝑙𝑒𝑖𝑗∗ 𝑤𝑜𝑚𝑒𝑛_𝑙𝑒𝑎𝑑𝑒𝑟𝑗+ 𝜀𝑖𝑗 (2)
The variable 𝑤𝑜𝑚𝑒𝑛_𝑙𝑒𝑎𝑑𝑒𝑟𝑗 is measured as the proportion of individuals in the country 𝑗 who choose the following statement: “women should have the same chance of being elected to political office as men” rather than “men make better political leaders than women, and should be elected rather than women”.
The coefficient 𝛽1 captures the direct effect of gender on political preferences, 𝛽3 is positive if a favorable opinion on women leadership which reflects a sense of a modern or progressive view is associated with a high likelihood to report that the given policy domain is a top priority. 𝛽4 indicates how the impact of gender on political preferences depends on living in a country with modern or old views about the role of women in the society. Typically, the same signs for 𝛽1 and 𝛽4 imply that in modern (or less conservative) societies, women are more distant from men in term of preferences. Conversely, opposite signs for 𝛽1 and 𝛽4 suggest that in modern societies, women are more likely to have the same preferences as men.
5. Results
In a first subsection, I present the impact of gender on public good preferences with some heterogeneity analysis. I introduce in a second subsection, the analysis on the role of gender and document how it may affect the basic impact of gender estimated in the first subsection. Some robustness checks are then presented in subsection 5.3 and 5.4.
5.1. Impact of gender on public good preferences
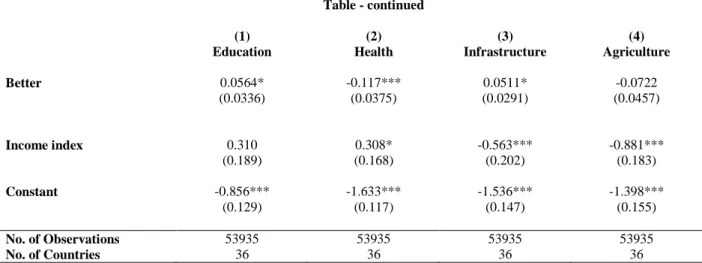
The first set of results is reported in Table 4 and confirms the findings in the descriptive statistics. With all control variables included, women significantly request more additional spending in education and health. These public goods are often referred to as social goods. On the other side, men claim for more additional investment in infrastructure and agriculture. All these effects are significant at the 1% level. This pattern of the results is usually found in the literature (Gilligan, 1982; Hutchings et al., 2004). Women are depicted to care more for others and to develop a general disposition of protecting the vulnerable. This would be due to the gendered norm of the society which spurs women to develop these traits throughout their education process. This refers to the ethics of care theory. This result is illustrated in Figure 2 which represents the marginal effects of the probability of female compared to male to choose a particular policy domain as a priority for additional investment.
Regarding the control variables, a clear pattern appears with the relationship between age and policy priority. Young people request more spending in education while individuals above 25 request more spending in healthcare and agriculture. People living in urban area ask for more spending in education and health while those in rural area are more concerned about infrastructure and agriculture.
Compared to individuals who are inactive in the labor market, unemployed individuals and those employed in part-time job are less likely to request for additional spending in education. The unemployed population requests more investment in healthcare and those in part-time job are more concerned about agriculture. The education level is strongly related to the policy priority. More educated people (primary level or higher) are more likely to mention education as their top priority and less likely to mention agriculture.
People who have a good perception of their living conditions compared to others claim for more spending in education and less in health and agriculture. The income index follows a similar pattern; it is positively associated to the preference in education and negatively associated to the preference in infrastructure and agriculture.
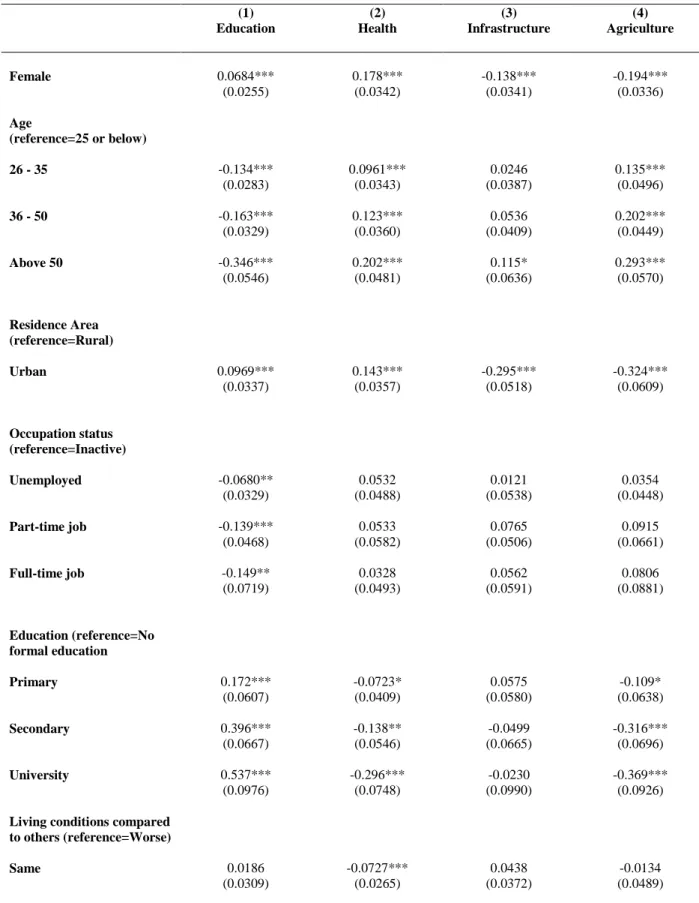
Table 4: Gender differences in public good preferences (1) Education (2) Health (3) Infrastructure (4) Agriculture Female 0.0684*** 0.178*** -0.138*** -0.194*** (0.0255) (0.0342) (0.0341) (0.0336) Age (reference=25 or below) 26 - 35 -0.134*** 0.0961*** 0.0246 0.135*** (0.0283) (0.0343) (0.0387) (0.0496) 36 - 50 -0.163*** 0.123*** 0.0536 0.202*** (0.0329) (0.0360) (0.0409) (0.0449) Above 50 -0.346*** 0.202*** 0.115* 0.293*** (0.0546) (0.0481) (0.0636) (0.0570) Residence Area (reference=Rural) Urban 0.0969*** 0.143*** -0.295*** -0.324*** (0.0337) (0.0357) (0.0518) (0.0609) Occupation status (reference=Inactive) Unemployed -0.0680** 0.0532 0.0121 0.0354 (0.0329) (0.0488) (0.0538) (0.0448) Part-time job -0.139*** 0.0533 0.0765 0.0915 (0.0468) (0.0582) (0.0506) (0.0661) Full-time job -0.149** 0.0328 0.0562 0.0806 (0.0719) (0.0493) (0.0591) (0.0881) Education (reference=No formal education Primary 0.172*** -0.0723* 0.0575 -0.109* (0.0607) (0.0409) (0.0580) (0.0638) Secondary 0.396*** -0.138** -0.0499 -0.316*** (0.0667) (0.0546) (0.0665) (0.0696) University 0.537*** -0.296*** -0.0230 -0.369*** (0.0976) (0.0748) (0.0990) (0.0926)
Living conditions compared to others (reference=Worse)
Same 0.0186 -0.0727*** 0.0438 -0.0134
Table - continued
(1) (2) (3) (4)
Education Health Infrastructure Agriculture
Better 0.0564* -0.117*** 0.0511* -0.0722 (0.0336) (0.0375) (0.0291) (0.0457) Income index 0.310 0.308* -0.563*** -0.881*** (0.189) (0.168) (0.202) (0.183) Constant -0.856*** -1.633*** -1.536*** -1.398*** (0.129) (0.117) (0.147) (0.155) No. of Observations 53935 53935 53935 53935 No. of Countries 36 36 36 36
Robust standard errors in parentheses * p<0.1, ** p<0.05, *** p<0.01
Gender differences in public good preferences may be due to the relative vulnerability of women, making them to claim more social goods as education and health. Therefore, empowered women who are well educated with good jobs, may not be different from men in terms of public good preferences (Gottlieb et al., 2018). This thesis is explored with estimations presented in Tables 5 and 6 which display the impact of gender by education level and employment status. Clearly, the results do not support the thesis of a reducing gap when women are empowered. In Table 5, the sample is divided into three groups according to the level of education: no education, primary education and secondary or higher. The gender gaps in public good preferences are nearly the same among the following three groups. For education and health, the point estimate of being female is significant (at least at the 10% level) in all the three education groups and the magnitudes of the effect are very close in the three subsamples. Interestingly, the effect of gender on policy preferences is never linear across the education level. For education, the marginal effect is higher for the primary education group (4.2%) and lower for the secondary and higher group (2.3%). For health, the marginal effect is higher for the no formal education group and lower for the primary education group. The gender gap is not significant for the lower education group for the preference in infrastructure and not significant for the middle education group for agriculture. Also, there is any clear pattern that the gender gap is decreasing (or increasing) with the education level. Results on the gender gap according to the employment status: inactive, unemployed and employed (Table 6) are in line with the previous results by education level. For the preference in education, the gender gap appears to be higher among employed individuals, which is not consistent with a
reducing gender gap when women become less vulnerable. For the other policy domains, there is no support of a change in the gender gap according to the employment status.
These results suggest that the education and the employment status – which are indicators of empowerment – do not explain gender differences in public good preferences. Women ask more additional spending in education and health and less in infrastructure and agriculture regardless their level of education and employment status.
Table 5: Gender differences in public good preferences by education level* Preferences for Education
(1) (2) (3)
No formal education Primary education Secondary education or higher
Female 0.0677* 0.0917* 0.0748**
(0.0374) (0.0497) (0.0381)
No. of Observations 10223 15574 27983
No. of Countries 36 36 36
Preferences for Health
(1) (2) (3)
No formal education Primary education Secondary education or higher
Female 0.211*** 0.164*** 0.171***
(0.0523) (0.0574) (0.0368)
No. of Observations 10223 15574 27983
No. of Countries 36 36 36
Preferences for Infrastructure
(1) (2) (3)
No formal education Primary education Secondary education or higher
Female -0.0220 -0.250*** -0.123**
(0.0645) (0.0481) (0.0488)
No. of Observations 10223 15574 27983
No. of Countries 36 36 36
Preferences for Agriculture
(1) (2) (3)
No formal education Primary education Secondary education or higher
Female -0.184*** -0.0896 -0.302***
(0.0330) (0.0640) (0.0469)
No. of Observations 10223 15574 27983
No. of Countries 36 36 36
* All the control variables shown in Table 4 are included Robust standard errors in parentheses
Table 6: Gender differences in public good preferences by occupation*
Preferences for Education
(1) (2) (3)
Inactive Unemployed Employed
Female 0.0363 0.0480 0.116***
(0.0333) (0.0432) (0.0438)
No. of Observations 20221 12503 20967
No. of Countries 36 36 36
Preferences for Health
(1) (2) (3)
Inactive Unemployed Employed
Female 0.201*** 0.228*** 0.114***
(0.0476) (0.0624) (0.0415)
No. of Observations 20221 12503 20967
No. of Countries 36 36 36
Preferences for Infrastructure
(1) (2) (3)
Inactive Unemployed Employed
Female -0.138** -0.0526 -0.173***
(0.0539) (0.0532) (0.0543)
No. of Observations 20221 12503 20967
No. of Countries 36 36 36
Preferences for Agriculture
(1) (2) (3)
Inactive Unemployed Employed
Female -0.164*** -0.315*** -0.153**
(0.0379) (0.0623) (0.0720)
No. of Observations 20221 12503 20967
No. of Countries 36 36 36
* All the control variables shown in Table 4 are included Robust standard errors in parentheses
5.2. Opinion on women leadership
In this subsection, I further investigate which factors make women more social than men. As seen previously, women empowerment fails to explain the gender gap preferences in public policy. Results presented above imply that women regardless of their empowerment (measured by education level and employment status), prefer social goods (education and health) instead of public goods related to infrastructure or agriculture. I test another potential alternative to explain why women are more social than men. Gender norms in the society could be a key factor explaining gender differences. In fact, women could prefer social goods because the education they received and the mentalities that shaped their ideals and principles make them more interested in social affairs. This hypothesis is tested using a variable measuring the perception on whether women could be good leaders and should be elected in political office. This variable is introduced in the empirical model to assess how it can shift the gender gap in public good preferences.1
Results are presented in Table 7. The share of individuals in the country supporting that women could be good leaders has no impact of one’s individual preferences in public goods.2
The results for the interaction term between gender and opinion on women role suggest that women in more progressive countries – those with a favorable view of women leadership – are not different from other women in terms of preferences for education, health and infrastructure. However, for agriculture, the interaction term is negative and significant at the 5 percent level. Therefore, women living in countries with a good opinion of women leadership are less likely to mention agriculture as a priority for government spending. This suggests that women in conservative countries are more concerned about additional spending in agriculture and have preferences closer than those of men in this particular policy domain. We could expect - from the descriptive evidence presented in Figure 1 - a significant effect of the interaction term for health and infrastructure. Indeed, Figure 1 shows an increasing gender gap in health and infrastructure (in addition to agriculture) when the gender norms are favorable to women. However, this pattern appears non-significant in the econometric analysis for health and infrastructure. One potential explanation of this closing gap in
1 This variable is centered in the regression equation so that the main effect of gender measures the impact of being
female when the share of good opinion on women leadership is equal to its mean.
2 However, the individual variable indicating whether one individual supports that women are good leaders, is
positively related to education and negatively related to infrastructure and agriculture. Those results are available upon requests.
agriculture between men and women is that women in conservative countries are more likely to maintain a traditional relationship with their husband and men in general. This may lead them to conform to the holistic opinion of men. The closing gender gap in agriculture may also be related to some specific issues on the place of women in the agricultural sector. These issues will be discussed in the next section.
The result on agriculture leads to investigate the heterogeneity between rural and urban area as agriculture is much more practiced in rural area. This heterogeneity analysis shown in table 8 reveals that this closing gender gap is only observed in rural area. This result suggests that the closing gender gap in preferences for agriculture is driven by an increasing demand of investment in agriculture from women in the rural area.
Figure 3 displays the marginal effects of being female on public good preferences by the share of good opinion on women leadership in one’s country. The marginal effect, which measures the difference between the probability of women and men to pick one public good as a top priority, is calculated for each quintile of the share of good opinion on women leadership. The figures reflect the results presented in Table 7. For education, the gender gap is completely flat suggesting that gender gap in preferences for education is not related to norms on the role of women in the society. For healthcare, the gender gap increases when the country has a progressive view of the role of women. However, this increase is not high enough to find a significant difference between the marginal effects for each quintile. A similar result is observed with the preference in infrastructure. The gender gap increases when the country is more progressive on gender norms, but the marginal effects are not significantly different between quintiles. For preferences in agriculture, the increase in the gender gap is sharp. The gender gap goes from 1.7% for the 1st quintile of the proportion of people with a good opinion of women's leadership to 2.8% for the last quintile, more than one percentage point difference. Moreover, the gender gap is significantly different from one quintile to another at the 5% level.
Table 7: Gender differences in public good preferences - Impact of the opinion about gender leadership (1) Education (2) Health (3) Infrastructure (4) Agriculture Female 0.0683*** 0.178*** -0.139*** -0.196*** (0.0256) (0.0347) (0.0321) (0.0328)
Good opinion of women leadership
0.0058 0.758 -0.194 0.519
(0.467) (0.542) (0.616) (0.756)
Female * Good opinion of women leadership 0.0146 0.0608 -0.375 -0.502** (0.184) (0.228) (0.327) (0.199) Age (reference=25 or below) 26 - 35 -0.134*** 0.0962*** 0.0243 0.136*** (0.0283) (0.0343) (0.0389) (0.0494) 36 - 50 -0.163*** 0.124*** 0.0526 0.202*** (0.0329) (0.0362) (0.0409) (0.0448) Above 50 -0.346*** 0.201*** 0.116* 0.295*** (0.0547) (0.0480) (0.0639) (0.0567) Residence Area (reference=Rural) Urban 0.0969*** 0.142*** -0.294*** -0.325*** (0.0337) (0.0357) (0.0519) (0.0610) Occupation status (reference=Inactive) Unemployed -0.0681** 0.0521 0.0140 0.0377 (0.0328) (0.0485) (0.0538) (0.0450) Part-time job -0.139*** 0.0525 0.0798 0.0949 (0.0470) (0.0581) (0.0510) (0.0661) Full-time job -0.149** 0.0316 0.0598 0.0836 (0.0722) (0.0489) (0.0603) (0.0879) Education (reference=No formal education Primary 0.172*** -0.0739* 0.0585 -0.110* (0.0607) (0.0408) (0.0582) (0.0636)
Table - continued
(1) (2) (3) (4)
Education Health Infrastructure Agriculture
Secondary 0.396*** -0.140** -0.0494 -0.318***
(0.0666) (0.0551) (0.0666) (0.0695)
University 0.536*** -0.297*** -0.0234 -0.370***
(0.0975) (0.0753) (0.0991) (0.0930)
Living conditions compared to others (reference=Worse) Same 0.0186 -0.0725*** 0.0431 -0.0141 (0.0309) (0.0265) (0.0373) (0.0488) Better 0.0564* -0.117*** 0.0507* -0.0723 (0.0336) (0.0375) (0.0291) (0.0455) Income Index 0.310 0.311* -0.566*** -0.878*** (0.190) (0.169) (0.203) (0.184) Constant -0.856*** -1.630*** -1.536*** -1.399*** (0.128) (0.112) (0.147) (0.156) No. of Observations 53935 53935 53935 53935 No. of Countries 36 36 36 36
Robust standard errors in parentheses * p<0.1, ** p<0.05, *** p<0.01
5.3. Robustness checks
As robustness checks, I include country-level variables in the model to assess how these variables can change the results (Table 9). The macro level variables included are: the proportion of seats held by women in national parliament, the fertility rate, the logarithm of GDP per capita and the unemployment rate for male and female. Controlling for these variables does not change the results. The interaction term between gender and the opinion of women’s leadership remains negative and significant at the 5 % level for the preference for agriculture; the point estimate is roughly the same. For the other public goods, the interaction term is not significant. Interestingly, the proportion of seats held by women in national parliament is positively associated with preference in health and negatively associated with preference in infrastructure. This corroborates our result of the main effect of gender and suggests that countries where women are more involved in the political life are those who ask for more investments in health and less in infrastructure.
Figure 3: The impact of the country’s opinion on women leadership on the differences between female and male on public good preferences*
* The y-axis represents the marginal effects of being female on preferences on additional investment in education, health, infrastructure and agriculture. The x-axis displays the quintiles of the share of individuals having a good opinion of women leadership in the country. These quintiles are respectively equal to 59.8%, 67.2%, 71.4% and 77.9%.
In countries with a high unemployment rate for men, people are more likely to choose infrastructure as a top priority and less likely to choose healthcare. Countries with high female unemployment rate do not consider agriculture as a top priority. The other country-level variables included in the regression (GDP per capita and fertility rate) are not significantly related to any of the four public goods.
Table 8:Gender differences in public good preferences by residence area - Impact of the opinion about gender leadership*
Education Health Infrastructure Agriculture
(1) (2) (3) (4) (5) (6) (7) (8)
Rural Urban Rural Urban Rural Urban Rural Urban
Female 0.0545* 0.0844*** 0.158*** 0.198*** -0.125*** -0.153*** -0.149*** -0.314*** (0.0308) (0.0272) (0.0425) (0.0387) (0.0351) (0.0505) (0.0360) (0.0529) Good opinion of women leadership 0.0657 -0.238 1.005* 0.601 -0.335 -0.203 0.846 0.517 (0.478) (0.502) (0.530) (0.614) (0.633) (0.691) (0.793) (0.828) Female*Good opinion of women leadership -0.344 0.365** 0.239 -0.125 0.0416 -0.934** -0.698** -0.0052 (0.270) (0.166) (0.326) (0.254) (0.389) (0.415) (0.294) (0.303) No. of Observations 31246 22689 31246 22689 31246 22689 31246 22689 No. of Countries 36 36 36 36 36 36 36 36
* All the control variables in table 6 are included Robust standard errors in parentheses
* p<0.1, ** p<0.05, *** p<0.01
I implement another robustness test to check whether the main results are sensitive to a different measure of the dependent variables. The results presented so far only consider the first priority for increasing public spending. In this robustness analysis, I consider the first two priorities. For example, a given individual is considered to have a preference for education, if he/she has chosen education as one of these top two priorities. Results of this robustness test presented in Table 10 are pretty the same as the main results (Table 7). Women request more additional investments in education and health and less in infrastructure and agriculture. The norm on gender role is not related to the gender gap in public good preferences except for agriculture. For the latter, the interaction term is negative and significant at the 1% level implying that the gender gap for preferences in agriculture is very different along the level of gender norm in the country. Women request more spending in agriculture in conservative countries compared to progressive countries (countries with a good opinion of women leadership). Results of this robustness analysis by education group and employment status are reported in Appendix 4 and 5. The findings confirm previous results that the gender gap in policy preferences is not related to the education level or the employment status.
Table 9: Gender differences in public good preferences – controlling for cross-country characteristics (1) Education (2) Health (3) Infrastructure (4) Agriculture Female 0.0682*** 0.178*** -0.139*** -0.195*** (0.0256) (0.0347) (0.0322) (0.0327)
Good opinion of women leadership
-0.0866 1.326*** -0.615 0.696
(0.478) (0.499) (0.627) (0.616)
Female * Good opinion of women leadership 0.0145 0.0615 -0.375 -0.505** (0.184) (0.228) (0.327) (0.199) Age (reference=25 or below) 26 - 35 -0.134*** 0.0960*** 0.0245 0.135*** (0.0283) (0.0344) (0.0389) (0.0493) 36 - 50 -0.163*** 0.124*** 0.0527 0.202*** (0.0329) (0.0361) (0.0409) (0.0449) above 50 -0.347*** 0.202*** 0.115* 0.297*** (0.0548) (0.0479) (0.0641) (0.0570) Residence Area (reference=Rural) Urban 0.0971*** 0.141*** -0.293*** -0.327*** (0.0338) (0.0356) (0.0518) (0.0613) Occupation status (reference=Inactive) unemployed -0.0688** 0.0530 0.0133 0.0386 (0.0326) (0.0482) (0.0538) (0.0449) part-time job -0.139*** 0.0512 0.0802 0.0947 (0.0468) (0.0577) (0.0512) (0.0660) full-time job -0.149** 0.0302 0.0600 0.0827 (0.0721) (0.0486) (0.0603) (0.0877)
Table - continued Education (reference=No formal education primary 0.172*** -0.0751* 0.0593 -0.108* (0.0606) (0.0410) (0.0583) (0.0634) secondary 0.395*** -0.141** -0.0486 -0.317*** (0.0667) (0.0552) (0.0670) (0.0695) university 0.536*** -0.299*** -0.0216 -0.368*** (0.0974) (0.0748) (0.0993) (0.0932)
Living conditions compared to others (reference=Worse) same 0.0183 -0.0723*** 0.0432 -0.0140 (0.0309) (0.0267) (0.0372) (0.0488) better 0.0562* -0.117*** 0.0510* -0.0733 (0.0335) (0.0375) (0.0289) (0.0456) Income Index 0.308 0.323* -0.579*** -0.846*** (0.190) (0.169) (0.205) (0.185) Country-level variables Percentage of women in parliament -0.0051 0.0124** -0.0124* -0.0023 (0.0059) (0.0051) (0.0071) (0.0094) Fertility rate 0.0518 0.0993 -0.132 0.0881 (0.0854) (0.0822) (0.110) (0.0969)
Log Gdp per capita 0.0401 0.0705 -0.0795 0.0031
(0.140) (0.141) (0.137) (0.168)
Unemployment rate of male 0.0197 -0.0562*** 0.0305* 0.0223
(0.0200) (0.0207) (0.0170) (0.0248) Unemployment rate of female 0.0029 0.0263 -0.0182 -0.0342* (0.0165) (0.0178) (0.0134) (0.0185) Constant -1.502 -2.735* -0.0960 -1.555 (1.489) (1.410) (1.515) (1.659) No. of Observations 53935 53935 53935 53935 No. of Countries 36 36 36 36
Standard errors in parentheses * p<0.1, ** p<0.05, *** p<0.01
Table 10: Gender differences in public good preferences – Robustness checks: the first two public good preferences (1) Education (2) Health (3) Infrastructure (4) Agriculture Female 0.116*** 0.193*** -0.182*** -0.177*** (0.0231) (0.0255) (0.0216) (0.0265)
Good opinion of women leadership
0.189 0.535 -0.0431 -0.0744
(0.477) (0.609) (0.667) (0.581)
Female * Good opinion of women leadership 0.0180 0.256 -0.0644 -0.491*** (0.184) (0.191) (0.199) (0.139) Age (reference=25 or below) 26 - 35 -0.122*** 0.0308 0.00877 0.112*** (0.0391) (0.0325) (0.0292) (0.0401) 36 - 50 -0.148*** 0.0412 0.0284 0.176*** (0.0379) (0.0342) (0.0355) (0.0419) Above 50 -0.321*** 0.128*** 0.0436 0.261*** (0.0553) (0.0429) (0.0513) (0.0516) Residence Area (reference=Rural) Urban 0.128*** 0.191*** -0.302*** -0.318*** (0.0380) (0.0344) (0.0455) (0.0533) Occupation status (reference=Inactive) Unemployed -0.0599* 0.0585** -0.0124 0.0100 (0.0335) (0.0292) (0.0441) (0.0255) Part-time job -0.124*** -0.0170 0.0256 0.0830* (0.0388) (0.0338) (0.0458) (0.0426) Full-time job -0.118 -0.0193 -0.0197 0.0821 (0.0754) (0.0343) (0.0438) (0.0677) Education (reference=No formal education Primary 0.167*** 0.0238 0.0597 -0.0956* (0.0512) (0.0379) (0.0428) (0.0506)
Table - continued
(1) (2) (3) (4)
Education Health Infrastructure Agriculture
Secondary 0.437*** 0.0494 -0.0407 -0.279***
(0.0532) (0.0503) (0.0591) (0.0573)
University 0.531*** -0.0133 -0.0166 -0.235***
(0.0827) (0.0652) (0.0814) (0.0766)
Living conditions compared to others (reference=Worse) Same 0.0429** -0.0512** 0.0117 -0.0158 (0.0193) (0.0256) (0.0295) (0.0310) Better 0.0725** -0.108*** 0.0333 -0.0534* (0.0312) (0.0328) (0.0328) (0.0304) Income Index 0.441** 0.207 -0.460*** -0.660*** (0.196) (0.138) (0.175) (0.147) Constant -0.234* -0.264*** -0.629*** -0.385*** (0.122) (0.0929) (0.132) (0.143) No. of Observations 53935 53935 53935 53935 No. of Countries 36 36 36 36
Robust standard errors in parentheses * p<0.1, ** p<0.05, *** p<0.01
5.4. Results from a different indicator of gender norms
The results presented so far are based on a unique measure of gender norms. One might wonder whether these results would hold with a different measure. I use the 2014 Social Institutions and Gender Index (SIGI) developed by the OECD to assess whether the main result of an increasing gender gap in preference for agriculture when norms are favorable to women is still verified. The SIGI measure is particularly adapted to capture gender norms. Unlike measures of gender inequality based on outcome-focused dimensions like education, health, political participation etc., the SIGI captures social roots of gender inequality based on “codes of conduct, norms, traditions, informal and formal laws that might contribute to gender inequalities in all spheres of life” (Branisa et al., 2009). By construction, the SIGI indicator varies between 0 and 1. In this paper, a value of 0 in the SIGI measure reflects the highest inequality in gender social institutions and 1 reflects no
inequality.3 The SIGI indicator is recorded in 31 countries among the 36 African countries in the sample.4 Unsurprisingly, the SIGI indicator is positively correlated with the main measure of gender norm “the proportion of respondents with a good opinion of women leadership” (Figure 4). However, the correlation coefficient between these two measures is not so high (49.15%) suggesting that they are partially measuring different aspects of gender norms.
The gender gap in policy preferences appears to be correlated with the gender gap in social institutions measured by the SIGI indicator (Appendix 6). This descriptive pattern is consistent with the one observed in Figure 1. The gender gap in policy preferences is high when the gender inequality is low except in education in which we observe the opposite trend.
Figure 4: Correlation between the main measure of gender norm (perception of women leadership) and the SIGI indicator
I run the same regression as in Table 7, replacing the measure of the perception of women leadership by the SIGI indicator. Results presented in Table 11 lead to the same conclusions as the main result (Table 7). The interaction term between gender and the SIGI indicator is only significant (at the 10% level) for the preference in agriculture. As previously, the point estimate is
3 In the original SIGI measure, 0 refers to no inequality and 1 to high inequality. I take the opposite in this paper to
allow an easier comparison with the main measure of gender norm for which a higher value reflects progressive of favorable gender norms.
4 The five countries in which the SIGI indicator is missing are: Algeria, Botswana, Cape Verde, Mauritius and Sao
negative suggesting that the gender gap in the preference in agriculture is widening when gender norms are more favorable to women. In countries with more gender inequality in social institutions, women request more additional investment in agriculture. Therefore, the gender gap in preference for agriculture is smaller in countries with high gender inequality.
Table 11: Gender differences in public good preferences - Measuring gender norm with the SIGI indicator * (1) Education (2) Health (3) Infrastructure (4) Agriculture Female 0.0696** 0.181*** -0.132*** -0.189*** (0.0283) (0.0383) (0.0362) (0.0370) SIGI Indicator -0.617 -0.145 0.662 0.196 (0.596) (0.520) (0.534) (1.050)
Female * SIGI Indicator -0.0790 0.231 -0.0783 -0.454*
(0.232) (0.316) (0.251) (0.249)
No. of Observations 47939 47939 47939 47939
No. of Countries 31 31 31 31
* All the control variables shown in Table 4 are included Robust standard errors in parentheses
* p<0.1, ** p<0.05, *** p<0.01
6. Discussion
My findings reveal that agriculture has a certain particularity compared to other policy preferences studied in this paper. In fact, agriculture is the only field where the gender gap in preferences is affected by gender norms after controlling for observable individual characteristics. The gender gap in preferences for agriculture is smaller in conservative countries, those where norms in gender role are less favorable to women. I suggest hereafter some insights to understand this specificity of agriculture.
The closing gender gap in preferences for agriculture in conservative countries is driven by the rural area (Table 8). In countries with negative gender norms, women in rural areas may face higher inequality. Indeed, they generally own and work in smaller farms, have smaller or less productive livestock, less access to credit, inputs, technology and mechanization. Women farmers consistently have limited access to productive resources compared to their male counterparts (Oxfam, 2013). In addition, they are less educated, have limited access to agricultural training,
extension services, and have more difficulties enforcing their rights (FAO, 2011). In addition to these constraints, dominant sex-based norms and discrimination often result in women drowning in excessive workloads, while much of their work remains unpaid and unrecognized (FAO, 2016). As such, it makes sense that agriculture is a priority for these women who are likely to feel more concerned about positive changes in this sector.
The gender gap reduction in conservative societies can also be due to the “feminization of agriculture”. Available data on the agricultural labor force in Africa show that women account for up to 52% of the total population in this sector and they are responsible for about 50% of agricultural work in sub-Saharan Africa (FAO, 2016). Indeed, the review of existing data and literature supports the hypothesis of the "feminization of agriculture". There is convincing evidence that in many countries, particularly in Africa, agriculture tends to become more feminized, either because men are leaving the agricultural sector or because women are becoming more and more integrated in the labor force in rural areas. Indeed, the situation is particularly disastrous in some contexts in which social changes such as migration (rural exodus, or migration abroad), more prevalent among men, add the burden of women who bears the responsibility of ensuring food security to their household. Emigration is a key factor that directly and rapidly changes the role of women in agriculture through the loss of a valid male labor force, especially since younger men are more likely to migrate (Mueller et al., 2015a). In farming systems relying heavily on family labor, the loss of male labor can cause a substantial farm shock, generating necessary adjustments of the labor force within the household. To maintain the same level of agricultural production, women left behind should increase their own work contributions to compensate the loss of male labor, hire workers or rely on other family members (FAO, 2016).
7. Conclusion
I attempt to contribute to a better understanding of gender gap in public good preferences in Africa and to explore the role of gender norms on these differences. In Western countries it is well established that women’s choices and preferences differ consistently from those of men. However, this observed gap is shrinking with the increasing women empowerment within the home and within the society. Several studies in developed countries and in some developing countries like India show that a positive change in the economic and social situation of women will close the
gender gap in political attitudes and priorities. However, in the case of Africa, the weight of tradition and norms may raise doubts on this question. Results found in this paper suggest that regardless their level of education and their employment status, women always exhibit preferences for social goods: education and health. These results strongly support the ethic of care theory which states that women are more likely to take responsibility to caring for others and protecting the most vulnerable in the society due to differentiated socialization patterns. My findings imply that this responsibility assigned to women remain unchanged when women are more empowered. Furthermore, I study whether the gender gap in policy preferences could be reduced when considering constructed norms on gender role. This paper shows that the gender gap still exists among people with a traditional view of gender role – those who think that women could not be good leaders – in all policy preferences except in agriculture. Indeed, women in countries with a traditional opinion on gender role exhibit higher preferences in agriculture, reducing the gap with men. A potential explanation lies on the fact that more traditional women may be more likely to comply with men preferences.
The evidence shown in this paper is a strong advocacy for a better representativeness of women in the political sphere in Africa. Indeed, the gender gap in political preferences seems more rooted in Africa and may not be explained by the economic and social conditions of women. In addition, women could even deviate more from men’s preferences when gender norms become modern and more favorable to women. This predicts that differences in men's and women's preferences may be even greater in the future with a positive evolution of socially constructed gender norms in Africa. These results highlight the importance to fully involve women in the decision-making process in order to account for the wide range of policy preferences of the population.
References
Abrams, B. A., & Settle, R. F. (1999). Women’s suffrage and the growth of the welfare state. Public Choice, 100, 289–300.