HAL Id: cea-02339774
https://hal-cea.archives-ouvertes.fr/cea-02339774
Submitted on 5 Nov 2019
HAL is a multi-disciplinary open access archive for the deposit and dissemination of sci-entific research documents, whether they are pub-lished or not. The documents may come from teaching and research institutions in France or abroad, or from public or private research centers.
L’archive ouverte pluridisciplinaire HAL, est destinée au dépôt et à la diffusion de documents scientifiques de niveau recherche, publiés ou non, émanant des établissements d’enseignement et de recherche français ou étrangers, des laboratoires publics ou privés.
analogy with nuclear glass
T. Ducasse, A. Gourgiotis, E. Pringle, F. Moynier, P. Frugier, P. Jollivet, S.
Gin
To cite this version:
T. Ducasse, A. Gourgiotis, E. Pringle, F. Moynier, P. Frugier, et al.. Alteration of basaltic glass in silica saturated conditions analogy with nuclear glass. Applied Geochemistry, Elsevier, 2018, 97, pp.19-31. �10.1016/j.apgeochem.2018.08.001�. �cea-02339774�
1
Alteration of basaltic glass in silica saturated conditions:
analogy with nuclear glass
T.DUCASSE1,A.GOURGIOTIS2,E.PRINGLE3,4,F.MOYNIER3,P.FRUGIER1,P.JOLLIVET1,S.GIN 1*
1) CEA, DEN, DE2D/SEVT Marcoule, F30207 Bagnols sur Cèze, France (* correspondence : stephane.gin@cea.fr) 2) Institut de Radioprotection et de Sûreté Nucléaire (IRSN), PSE-ENV/SEDRE/LELI, Fontenay-aux-Roses, France 3) Institut de Physique du Globe de Paris, University Paris Diderot, CNRS UMR 7154, Paris 75005, France 4) Scripps Institution of Oceanography, UC San Diego, USA
Abstract
This study investigates the analogy between basaltic and borosilicate glasses of nuclear interest, by focusing on mechanisms controlling glass dissolution under silica saturation conditions. These conditions are representative of a non- or slowly renewed contacting solution, favouring the formation of a potentially passivating silica rich gel layer and secondary phases. Laboratory batch experiments were performed with synthetic basaltic glass altered at 90°C, at pH 7 in a saturated 29Si-doped aqueous solution for more than 600 days. Using elementary and isotopic solution analysis and solid characterizations by SEM, TEM and ToF-SIMS, we show that basaltic glass corrodes at an unexpectedly high and constant dissolution rate of 4 x 10⁻³ g.m-2.d-1 associated with the absence of passivating gel. Our results highlight the fact that the dissolution rate is controlled by the hydrolysis of the glassy network, sustained by the precipitation of clay-type minerals and amorphous silica. When tested in similar conditions, the International Simple Glass (ISG), a six oxide borosilicate glasses of nuclear interest displays a much lower rate limited by water diffusion through a passivating layer. The different behaviour of the two glasses is explained by their ability to form secondary crystalline phases at the expense of an amorphous passivating film.
2
1. Introduction
Understanding the processes responsible for the alteration of basaltic glass is of great interest in many research fields. Because of its widespread presence on the ocean floor and in volcanic rock, basaltic glass partly controls the chemical mass balance of the ocean (Benzerara et al., 2007; Morin et al., 2015) and the stability of volcanic terrain (Barone et al., 2016). The geological storage of CO2 in ultramafic formations such as basalt bedrock also requires good knowledge of
the interactions between water and silicate rock (Gislason et al., 2013; Guyot et al., 2011; Gysi and Stefansson, 2012). Studying the alteration of basaltic glass is also important for its use as a natural analogue of nuclear glass to assess the safety of deep geological nuclear waste storage (Crovisier et al., 2003; Ewing, 1979; Libourel et al., 2011; Poinssot and Gin, 2012). The basic idea is that the long-term behavior of nuclear glass can be predicted by a kinetic model provided that this model captures the main processes governing both the short- and long-term behavior of natural glasses.
Considerable experimental work has already been carried out on the first stages of the alteration of basaltic glass (Berger et al., 1987; Crovisier, 1989; Crovisier et al., 1987; Gislason and Eugster, 1987; Gislason and Oelkers, 2003; Techer et al., 2001; Verney-Carron et al., 2011; Wolff-Boenisch et al., 2004) and the nature of the products formed (Jercinovic et al., 1990; Le Gal, 1999; Stockmann et al., 2011). However, the dissolution rate of both borosilicate and aluminosilicate glasses in confined media is known to achieve low values of typically several orders of magnitude lower than the initial dissolution rate (Gin et al., 2012; Parruzot et al., 2015). In these conditions, the silica concentration reaches apparent saturation and the glass dissolves in a steady-state regime also called the residual rate regime (Gin et al., 2013b; Parruzot et al., 2015; Vienna et al., 2013). Unfortunately, there are too few kinetic measurements and comparisons between in-lab and in-field data to give credit to long-term predictions from existing kinetic models (Daux et al., 1997; Frugier et al., 2008; Grambow and Muller, 2001; Oelkers, 2001).
Parruzot et al. (2015) provided new insights into the long-term alteration in confined media of basaltic glass. These authors measured the residual rates of synthetic basaltic glass in batch experiments at 30°C and 90°C and the diffusion coefficient of water and alkali metals from the pristine glass to the solution through the alteration layer. After extrapolating these rates to environmental conditions, Parruzot et al. (2015) showed that the constant residual rates derived from laboratory measurements were in reasonable agreement with the mean apparent rates calculated for natural samples of various ages (Parruzot, 2014). Unfortunately, this approach did not rely on the understanding of the rate-limiting processes assumed to govern the long-term alteration rate of basaltic glasses in nature.
The resistance of glass to aqueous corrosion is not an intrinsic property of the glass but a response to a range of environmental factors. The reactions between silicate glass and water include: (1) the hydration of the glass and ion-exchange between ionic species in water (particularly H+) and ionic components in the glass (primarily alkali); (2) the hydrolysis of network forming species (e.g., silica, boria, and alumina tetrahedra); and (3) the dissolution of hydrolyzed species into the solution. As these three primary reactions proceed, glass components are released into the solution and/or are incorporated into alteration products (amorphous and crystalline phases) on the surface of the reacting glass. The reaction rates are controlled by many factors, chief among which are the glass composition, the temperature and pH of the solution and the concentration of the species dissolved in the solution (e.g., H4SiO4 and Al(OH)4-). These
3
processes have been summarized in many reviews (Bunker, 1994; Fournier et al., 2014; Gin, 2014; Gin et al., 2013a; Gin et al., 2013c; Inagaki et al., 1998; Jantzen et al., 2010; Van Iseghem et al., 2009; Van Iseghem et al., 2006; Vienna et al., 2013).
The amorphous phase formed on the surface of the glass by the hydrolysis and condensation of glass forming species can be transport-limiting in some situations (Cailleteau et al., 2008; Cailleteau et al., 2011; Gin et al., 2015; Jollivet et al., 2008; Rebiscoul et al., 2005; Rebiscoul et al., 2004). The mechanism responsible for the formation of this so called “passivating layer” is currently the subject of debate. Observations of sharp interfacial gradients have led some authors to propose that the glass dissolves congruently within a thin interfacial film of water. The alteration products then form by precipitation from species released in this film (Geisler et al., 2010; Geisler et al., 2015; Hellmann et al., 2015; Putnis, 2015). This interpretation has been supported by isotope studies: the altered layer of a silicate sample was shown to be enriched in isotopes such as 18O and 26Mg artificially introduced into the contacted solution, with no observable sigmoid diffusion profile (Geisler et al., 2015).
More recently, Gin et al. (2016) replicated a key experiment of Hellmann et al. (2015) and found no evidence supporting the interfacial dissolution-precipitation model. An alternative model has been proposed on the basis of experiments conducted with International Simple Glass (ISG), a six-oxide borosilicate glass. In near-neutral and slightly alkaline pH conditions, the passivating film in this model forms a low diffusive structure by in-situ reorganization of the silicate network after the release of the most soluble species (Na, B, Ca). The reorganization of the silicate network would explain the lower water diffusion coefficients in this layer than in the pristine glass (Gin et al., 2017; Gin et al., 2015).
The present study aims at determining whether the processes described for nuclear glasses also occur during the alteration of basaltic glass. Using a multi-scale approach including the characterization of both liquids and solids, we investigate the processes governing alteration of basaltic glass in steady-state conditions. In this article we report the results of experiments conducted using the same protocol as the one used for ISG (Gin et al., 2015): a long-term static test was performed over 600 days with glass powder and coupons placed in contact with water initially saturated with respect to SiO2(am) at 90°C and pH90°C 7. Our results show that there are
major differences between the two glasses and highlight that the precipitation of secondary crystalline or amorphous phases dominates over the formation of a passivating film.
2. Material and methods
2.1 Reagents and samples
All the samples were diluted with 0.5 M nitric acid obtained from sub-boiled 15 M (mol.L-1) nitric acid (EVAPOCLEAN system, Analab, France) and 18 M.cm de-ionized water (Milli Q system, Millipore, Milford, MA, USA).
2.2 Glass preparation
A model basaltic glass (BGB) was prepared and doped with the equivalent of 1 wt% B2O3 as an
alteration tracer. The composition of BGB is similar to that of the glass synthetized by (Techer et
4
the powders were poured into a Pt-Rh crucible. Two melts were prepared at 1500 °C in an electric furnace with 3 h of refining. Part of the glass was quenched; the remainder was cast into a graphite mold and annealed at 700 °C for 3 h in an electric oven and cooled to room temperature.
From the resulting glass bars, eight monoliths of 1 x 1 x 0.1 cm3 each were prepared. The two large faces were polished up to grade 4000 using SiC paper. The density measured for these samples from the glass bar on a hydrostatic balance by (Parruzot et al., 2015) was 2.793 ± 0.0005 g.cm-3.
Quenched BGB glass samples were ground and milled to obtain a mean particle diameter
between 125 and 200 µm. Fine particles were removed by washing the glass powder in absolute ethanol several times and allowing the powder to settle at appropriate times calculated using Stokes’ law. The specific surface area of the powder was measured at 0.0295 ± 0.0015 m2.g-1 by
krypton absorption using the Brunauer, Emett and Teller (BET) method. Laser diffraction (Malvern Mastersizer 3000) was used to calculate the particle size distribution and geometric surface area from the measured angular variation in the scattered light intensity produced by a laser beam passing through a dispersed particulate sample. The angular scattering intensity data were analyzed to calculate the size of the particles responsible for the scattering pattern, using Mie theory and a volume equivalent sphere model. The refractive indices were taken to be 1.54 for the glass and 1.33 for the dispersant (water). The results were divided into 100 size fractions logarithmically distributed between 10-2 and 3·103 µm. The BGB 125-200 µm powder had a
particle size distribution centered on 160 µm and a geometric surface area of 0.0125 m2.g-1, leading to a shape factor (the ratio between the BET and the geometric surface area) of 2.36, which is common for glass particles (Fournier et al., 2016; Icenhower and Steefel, 2015).
Elemental concentrations in the glass were determined by Inductively Coupled Plasma Optical Emission Spectroscopy (ICP-OES) after dissolution of the glass by alkaline fusion followed by neutralization with HNO3 (Table 1). The concentration uncertainties were estimated to be ± 5 %
for elements with more than 1 wt% in the glass, and ± 10 % elements for less concentrated elements.
Table 1. Glass composition (weight%). Uncertainties are given in brackets. Glass CJ1 (Jegou et al., 2000) and
international simple glass (ISG) (Gin et al., 2013a) are considered in this study for comparison.
BG
B SiO2 Al2O3 Fe2O3 CaO MgO Na2O TiO2 B2O3 SrO K2O MnO2 P2O5 ZrO254.1(2.7) 15.9(0.8) 9.6(0.5) 8.1(0.4) 5.8(0.3) 2.6(0.1) 1.5(0.1) 1.0(0.1) 0.5(0.05) 0.2(0.02) 0.4(0.04) 0.3(0.03) -
ISG
56.2(2.8) 6.1(0.3) - 5.0(0.3) - 12.2(0.6) - 17.3(0.9) - - - - 3.3(0.2)CJ1
68.1(3.4) 10.9(0.5) 21.0(1.0)2.3 Leaching experiments
2.3.1 Main leaching experiment
The main leaching experiment involved studying the alteration of 8 coupons and 0.38 g of 125-200 µm BGB glass powder at 90°C in static mode with a low glass-surface
area-to-leaching-5
solution-volume ratio (S/V, m-1) of 60m-1. The glass was placed in contact with 140 mL of solution
initially enriched with 29Si until equilibrium with respect to amorphous silica was reached. The perfluoroalkoxy (PFA) vessel with the glass and the leachate was packed into a container with a few milliliters of water to minimize evaporation in the reactor. The double container was then stored in an oven at 90 °C (± 1 °C) for the duration of the experiments. The pH of the leachate was initially adjusted to 7.0 (± 0.2); then maintained at this value until the end of the experiment by adding small amounts of 0.5 mol.L-1 HNO3 (Suprapur) or 0.5 mol.L-1 NaOH (PROLABO,
NORMADOSE). At different times, the leachate was sampled and a coupon was withdrawn for characterization.
The leaching solution was prepared as follows. 29SiO2 (Eurisotop, 29Si > 95%) was mixed with
KOH (Suprapur) and melted at 600 °C. The resulting potassium silicate was dissolved in deionized water at 90 °C to obtain a Si concentration of 160 mg.L-1 at pH90°C 7. The resulting 29Si/28Si ratio in the solution was 28.9, compared with 0.0507 in the glass (natural abundance).
This protocol yielded a K concentration in the onset solution of 2.5 g.L-1.
One glass coupon was withdrawn, rinsed with deionized water and dried for 2 h at 90 °C for characterization after 1, 14, 91, 210, 365 and 600 days. In parallel, 0.5 mL samples of the liquid were taken from the reactor during the experiment, diluted and acidified with 2.5 mL of 0.5 mol.L-1 HNO3 (Suprapur), and filtered at 0.45 µm before analysis. Note that the aliquots were diluted with
0.5 N HNO3 prior to filtration to prevent silica precipitation as the solution was cooled. At each
sampling time, the pH was recorded at 90 °C. The leaching solution was not topped up during the experiment so the volume change in the reactor was taken into account in calculations of the normalized mass losses of the glass. Possible evaporation between sampling times was also taken into account by weighing the reactor before and after each sampling.
2.3.2 Complementary leaching experiment
Because the concentration of the glass dissolution tracers was difficult to measure in the solution of the main leaching experiment, a second experiment with a higher S/V ratio was performed under the same conditions. This test was conducted with the same glass, in a solution at a fixed pH90°C of 7 saturated with respect to amorphous silica (at natural isotopic abundance). The S/V
ratio of 20000 m-1 was obtained by placing 0.6557 g of BGB powder (crushed, sieved, and
ultrasonically cleaned; BET specific surface area, 2.318 m2.g-1) in contact with 80 mL of leaching solution. As for the main leaching experiment, the leachate was regularly sampled and the aliquots were analyzed by ICP-OES.
2.4 Solution analysis
The leaching solution samples were analyzed by ICP-OES (ThermoScientific ICAP 6300 DUO) after dilution and acidification with HNO3. The uncertainties on the concentrations obtained are
3 % for Si, Al, Ca, Fe, Mg and Na, and 50 % for B due to its low concentration. For the complementary tests performed at an S/V ratio of 20000 m-1, the Si and B concentrations were measured separately by spectrophotometry (Merck Spectroquant TEST, Cary 50 Scan UV-Vis spectrophotometer). The boron concentration in the samples taken at 400, 610 and 700 days in the main experiment was measured by Inductively Coupled Plasma – Mass Spectrometry (ICP-MS, Thermofisher Scientific ICAPQ).
6
As B is known to be a good tracer of glass dissolution (i.e., it does not precipitate and it is not retained in the alteration products), the equivalent thickness of altered glass, ETh, was calculated from the B concentration at a given sampling time as follow:
(1)
Where C(B) is the B concentration, Vt the volume of the solution at time t, ρ the density of the
glass (2.793 g.cm-3), St the reactive surface area at time t, and xB the mass fraction of B in the
glass. The normalized mass loss of element i at time t is given by:
(2)
With xi, the mass fraction of element i in the glass. The glass dissolution rate r, in g.m2.d-1, is
given by:
(3)
With ETh(B) in meters, in g.m-3 and t in days. As a first approximation, the glass dissolution rate
at time t was calculated by linear regression on three points from t-1 to t+1. The uncertainties for
ETh and r are 30 %, and for NL(i), 10 %.
2.5 Silicon isotope analysis
Prior to silicon isotope analysis, all samples and standards were purified using BioRad AG50 X-12 (200-400 mesh) cation exchange resin, following the method used in FM’s laboratory at the Institut de Physique du Globe de Paris (Pringle et al., 2014; Pringle et al., 2016; Savage and Moynier, 2013) adapted from Georg et al. (2006)(Georg et al., 2006).
For the samples taken until 203 days into the experiment, the silicon isotope ratio measurements were performed on a Thermo Scientific Neptune Plus Multi-Collector Inductively Coupled Plasma Mass-Spectrometer (MC-ICPMS)housed at the Institut de Physique du Globe de Paris (Paris, France). The instrument was operated at medium resolution to avoid Si polyatomic interferences following the same method as in Pringle et al. (2014, 2016).
For the samples taken later than 203 days into the experiment, the silicon isotope ratio measurements were performed on an Agilent 8800 tandem quadrupole ICP-MS/MS instrument, at the Institut de Radioprotection et de Sûreté Nucléaire (IRSN, Fontenay-aux-Roses, France). According to the method described in detail in (Gourgiotis et al., 2017),silicon isotope ratio determination is performed in mass-shift mode using SiO2+ ion species to avoid Si polyatomic
interferences. ICP-MS/MS is a simple and low cost technique compared to the MC-ICPMS, providing Si isotope ratios with uncertainties of ~0.5%
which
meet the requirements for nuclear glasses studies. That is why the technique for isotope ratio measurements was changed.The weight percentage of each isotope was calculated for each sample using the isotope ratios (Table 2) according the following equation:
7 (4)
With , the molar mass of Si isotope x (x = 28, 29 or 30).
Then, the concentration of each isotope in solution was determined using the next equation: (5)
Where [Si]tot, is the total Si concentration measured by ICP-OES. The results can be found in
Table 2.
2.6 Solid characterizations
The morphology of the samples of altered glass powder was characterized by Scanning Electron Microscopy (SEM) using a Zeiss Gemini Supra 55 FEG-SEM system operated at an acceleration voltage of 15 kV.
A Time-of-Flight Secondary Ion Mass Spectrometer (ToF-SIMS) (TOF.SIMS5, IONTOF GmbH, Münster, Germany) was used to perform elemental and isotopic depth profiling analyses. Two sputtering beams abrading a surface area of 350 x 350 µm2 were used: a 500 eV 40 nA Cs+ beam when analyzing anions and a 500 eV 100 nA O2+ beam when analyzing cations. The beam
energy was limited to 500 eV to obtain more accurate data on the external part of the alteration layer. The anions and cations were analyzed using a Bi+ 25 keV ion beam at 2 pA over an area measuring 100 x 100 µm2. The surface charges created during the analysis were neutralized using a pulsed low-energy (< 20 eV) electron flux.
Parts of the coupon and powder sample altered for 600 days were embedded in epoxy resin, mirror polished and characterized by Transmission Electron Microscopy (TEM). Focused ion beam (FIB) milling was performed with a FEI 200 dual beam FIB system at the University of Aix-Marseille, (Aix-Marseille, France). The FIB lamella was prepared with a 30 kV Ga+ beam operating at
20 nA. The prepared lamella measuring approximately 12 × 5 × 0.1 μm3 was transferred at atmospheric pressure with a micromanipulator to the membrane of a carbon-coated 200 mesh copper grid prior to TEM observations. Morphological observations and Energy-Dispersive X-ray (EDX) analyses were carried out on a Technai G2 (FEI) TEM instrument equipped with a LaB6
source operating at 200 kV. The detectors were a Gatan CCD camera, a STEM BF-DF detector, and an EDAX Genesis for the EDX analyses. The EDX probe size was 5 nm. The EDX analyses were performed in STEM mode on large windows of 100 nm2 to minimize the volatilization of light elements such as sodium.
3. Results
3.1 Solution analysis
Table 2 shows the concentrations of the major elements in the samples taken during the main experiment and the pH of the leaching solution measured just before each sample was taken. The pH remains within the target range throughout the experiment.
9
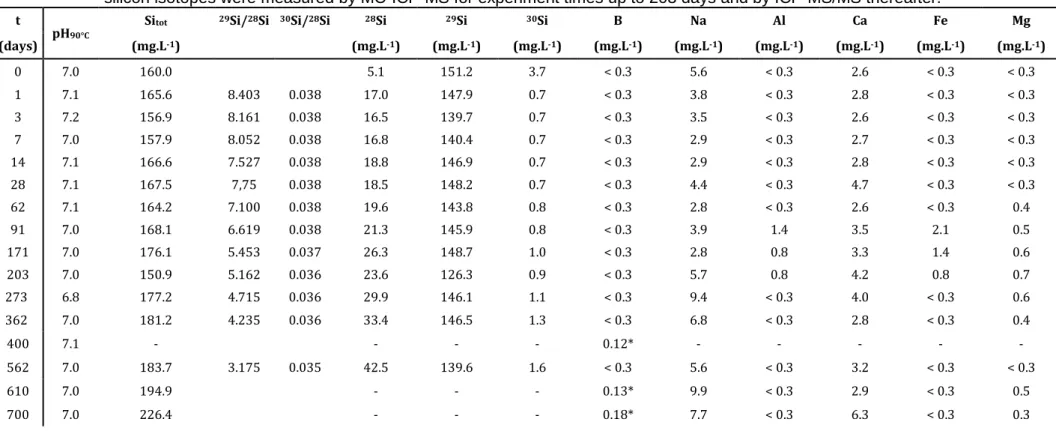
Table 2. Solution analysis results. The B concentrations followed by a * symbol were measured by ICP-MS. The concentrations of the different silicon isotopes were measured by MC-ICP-MS for experiment times up to 203 days and by ICP-MS/MS thereafter.
t
pH90°C
Sitot 29Si/28Si 30Si/28Si 28Si 29Si 30Si B Na Al Ca Fe Mg
(days) (mg.L-1) (mg.L-1) (mg.L-1) (mg.L-1) (mg.L-1) (mg.L-1) (mg.L-1) (mg.L-1) (mg.L-1) (mg.L-1) 0 7.0 160.0 5.1 151.2 3.7 < 0.3 5.6 < 0.3 2.6 < 0.3 < 0.3 1 7.1 165.6 8.403 0.038 17.0 147.9 0.7 < 0.3 3.8 < 0.3 2.8 < 0.3 < 0.3 3 7.2 156.9 8.161 0.038 16.5 139.7 0.7 < 0.3 3.5 < 0.3 2.6 < 0.3 < 0.3 7 7.0 157.9 8.052 0.038 16.8 140.4 0.7 < 0.3 2.9 < 0.3 2.7 < 0.3 < 0.3 14 7.1 166.6 7.527 0.038 18.8 146.9 0.7 < 0.3 2.9 < 0.3 2.8 < 0.3 < 0.3 28 7.1 167.5 7,75 0.038 18.5 148.2 0.7 < 0.3 4.4 < 0.3 4.7 < 0.3 < 0.3 62 7.1 164.2 7.100 0.038 19.6 143.8 0.8 < 0.3 2.8 < 0.3 2.6 < 0.3 0.4 91 7.0 168.1 6.619 0.038 21.3 145.9 0.8 < 0.3 3.9 1.4 3.5 2.1 0.5 171 7.0 176.1 5.453 0.037 26.3 148.7 1.0 < 0.3 2.8 0.8 3.3 1.4 0.6 203 7.0 150.9 5.162 0.036 23.6 126.3 0.9 < 0.3 5.7 0.8 4.2 0.8 0.7 273 6.8 177.2 4.715 0.036 29.9 146.1 1.1 < 0.3 9.4 < 0.3 4.0 < 0.3 0.6 362 7.0 181.2 4.235 0.036 33.4 146.5 1.3 < 0.3 6.8 < 0.3 2.8 < 0.3 0.4 400 7.1 - - - - 0.12* - - - - - 562 7.0 183.7 3.175 0.035 42.5 139.6 1.6 < 0.3 5.6 < 0.3 3.2 < 0.3 < 0.3 610 7.0 194.9 - - - 0.13* 9.9 < 0.3 2.9 < 0.3 0.5 700 7.0 226.4 - - - 0.18* 7.7 < 0.3 6.3 < 0.3 0.3
10
The total silicon concentration, plotted in figure 1, increases slowly in spite of the high initial concentration. This is in agreement with measurements made on the simplified nuclear glass ISG, for which the silica concentration increases over time toward saturation with respect to amorphous silica (Gin et al., 2012). This result may appear surprising given that Parruzzot et al. (2015) found a silica saturation concentration much lower than the saturation level with respect to amorphous silica in their residual rate experiments on basaltic glass. The hypothesis that the saturation the solution with respect to SiO2 stops the hydrolysis of the glass network, which was
verified for ISG (Gin et al., 2017; Gin et al., 2015), is called into question by this result. The behavior of the silicon isotopes will clarify this point.
The concentrations of Al, Fe and B are below the ICP-OES quantification limit. The B concentrations were measured at three sampling times by ICP-MS but carry a large uncertainty ( 50 %) because of the low available quantities for precise measurement. The Na concentrations cannot be interpreted because of contamination from the HNO3 added regularly to maintain the
pH at 7. 0 100 200 300 400 500 600 700 4 5 6 7 8 0 50 100 150 200 250
[Si] (p
pm
)
Time (d)pH
90 °C 0 100 200 300 400 500 600 700 0 20 40 60 80 100 Time (d) 28Si and
29Si (w%
)
0,0 0,5 1,0 1,5 2,0 2,5 3,0 30Si (w%
)
Figure 1. Top: pH measured at 90°C (); middle: Total Si concentration (), and bottom: relative weight percentages of 28Si (), 29Si() and 30Si() as a function of time.
11
3.2 Solid characterization
3.2.1 Scanning electron microscopy
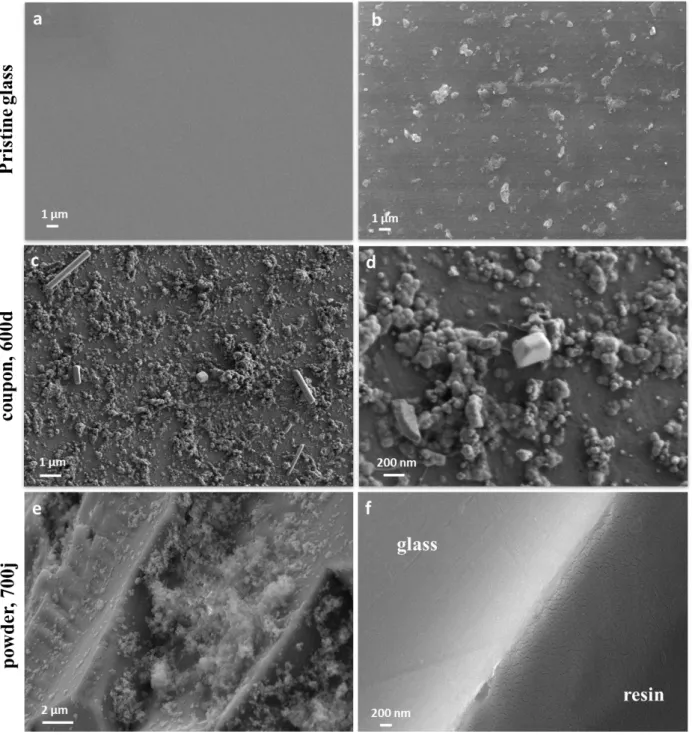
Glass powder altered for 700 days and a monolith altered for 600 days were observed by SEM and compared to pristine glass (figure 2). The surface of the polished monolith (figure 2.a) is much smoother than that of the grains of pristine glass obtained by crushing. No alteration layer is observed at SEM resolution ( 100 nm) on the surface of the monolith (figure 2.c and d) or of the altered glass (figure 2.e and f), whereas the thickness of the alteration layer calculated from the solution data ranges from 360 to 750 nm (Figure 7). This suggests that the glass dissolves congruently, with no gel formation replacing the altered glass as it is the case for ISG in similar conditions (Gin et al., 2015).
The micrographs show that different secondary phases form on the glass surface during alteration (figure 2.c, d and e): a few sparsely spread crystals and more or less spherical phases. The amounts formed on the glass surface are too small for chemical (EDX) or structural (X-ray diffraction) analysis. The spherules observed here resemble the amorphous silica particles observed during the dissolution of CJ1 ternary borosilicate glass (Jégou et al., 2000).
12
Figure 2.Scanning electron micrographs (back-scattered electrons) of BGB glass: a) a pristine coupon, b) a pristine
grain, c) and d) the surface of a coupon altered for 600 days, e) the surface of a grain altered for 700 days, and f) the cross-section of a representative grain altered for 700 days.
3.2.2 Transmission Electron Microscopy
The monolith altered for 600 days was observed by TEM. Figure 3 shows an overall view of the FIB sample. The glass is covered by a very uneven layer of certainly precipitated secondary phases (SP). The morphology of the particles making up this layer, which is between 100 nm and 1 µm thick, matches that of the phases observed by SEM (figure 2 c, d and e). At this resolution, as in the SEM images (figure 2.f), there is no sign of any gel or hydrated glass layer between the pristine glass and the precipitated phases. A high-resolution analysis of the interfacial region (figure 3.b) reveals a 5 nm thick layer morphologically different from that of the pristine glass, which could be the reactive interface (in yellow in the figure). This region may therefore be where
13
the hydrolysis reactions occur in this material. The layer is too thin for in-depth characterization however and the EDX profiles reveal nothing of significance (data not shown).
Figure 3. STEM images of the monolith of BGB glass altered for 600 days. a) the entire cross section (with the
metallization layer, M), b) the interface between the pristine glass (PG) and the secondary phases (SP), and c) and d) the secondary phases. The yellow lines in part b) delimit the reactive interface. The table gives the results of a semi-quantitative EDX analysis of the different compounds (wt%). A comparison between the analyzed PG and the nominal composition indicates the analytical error (delta).
The images of the precipitated phases in parts c and d of figure 3 show that they consist of crystalline clay-type phases within an amorphous (mainly amorphous silica) matrix. The chemical composition of these phases is given in the table displayed in figure 3. The values are only qualitatively accurate. The corresponding uncertainties can be estimated from the difference between the EDX-measured composition of the pristine glass and its theoretical composition. The
14
small size of the clay particles combined with the need to perform the EDX analyses over large areas to avoid any volatilization of light elements such as Na made it impossible to measure the composition of the clay particles alone. This analysis thus provides just a comparison of regions containing secondary phases (matrix + clays) with those that do not (matrix alone). These measurements show primarily that the matrix in which the clays form consists mainly of amorphous silica. The areas containing clay particles are enriched in Mg, Al, K, Ti, Mn, Fe and Ni. The latter, of which there are only trace amounts in BGB, is present in the initial solution from
the Ni crucible used to incorporate 29Si by alkaline fusion. The fact that the clay particles precipitated inside the amorphous silica matrix prevents their identification by X-ray diffraction. Nonetheless the atomic planes of these minerals are clearly visible in figure 3.d. The interplanar distance, the distance between two dark or light fringes, is 10.7 Å. This is the value obtained by taking the average distance between 3–8 of the planes shown in figure 3.d. Assuming that this distance corresponds to a partly dehydrated structure, the obtained value suggests that the clays could be 2:1 di- or tri-octahedral clays, with an octahedral layer sandwiched between two tetrahedral sheets. The interplanar distance, the approximate composition are all characteristic of smectites, which often form during the alteration of basaltic glasses (Crovisier et al., 2003). The amount of clay formed is however much lower than reported in the abovementioned study or in Parruzot et al (2015). This may because the pH affects the growth rate of the clays (Aréna, 2016).
3.2.3 Time-Of-Flight Secondary Ion Mass Spectrometry
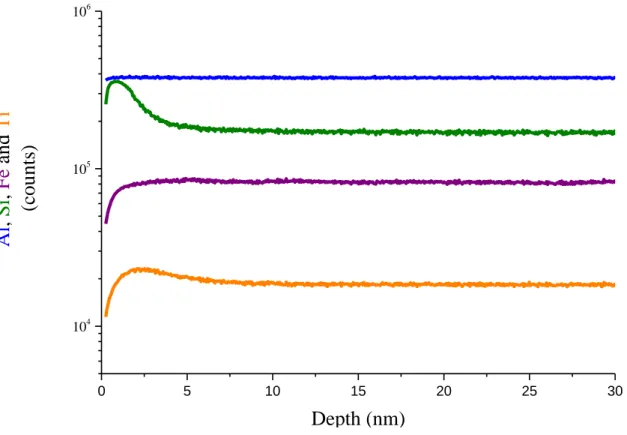
One monolith of pristine glass and monolith samples extracted at 1, 14, 91, 365 and 600 days of alteration were analyzed by ToF-SIMS. The element profiles in the pristine glass were measured in this way to assess the surface state of the glass before alteration (figure 4). Sample preparation and reactions with the atmosphere only modify the chemical composition of the monolith to a depth of 5 nm.
15 0 5 10 15 20 25 30 104 105 106
Depth (nm)
Al
,
Si
,
Fe
and
Ti
(cou
n
ts)
Figure 4. Unnormalized Al, Si, Fe, and Ti element profiles in pristine BGB glass.
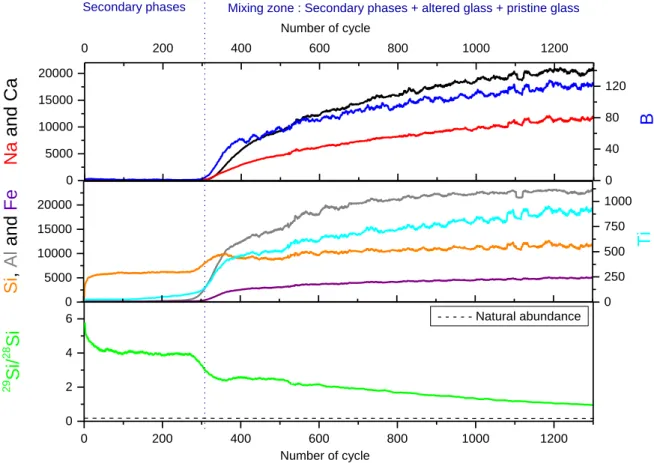
The distribution of the major elements in the glass after 600 days of alteration are shown in figure 5. These elemental profiles should be interpreted with caution because the high roughness of the precipitate layer creates spurious gradients. This issue is discussed further below. Nonetheless, the profiles for Fe, Al, Ti, B, Na and Ca are clearly similar, with a strong or complete depletion near the outer surface followed by a gradual increase and then a leveling off once the unaltered depth is reached. The silicon profile near the surface shows that the secondary phases contain mostly silicon. These also seem to contain small amounts of aluminum and titanium.
16 0 200 400 600 800 1000 1200 0 2 4 6 0 200 400 600 800 1000 1200 0 5000 10000 15000 20000
Mixing zone : Secondary phases + altered glass + pristine glass Number of cycle
Na
an
d Ca
Secondary phases 0 40 80 120B
0 5000 10000 15000 20000Si
,
Al
an
d
Fe
0 250 500 750 1000Ti
29Si/
28Si
Number of cycle - - - Natural abundanceFigure 5. Tof-SIMS depth profiling of BGB glass altered 600 days. Because of the roughness of the outer surface which
affects the location of the interfaces, data are plotted in cycles rather than in nm. Top: Unnormalized Na, Ca and B elemental profiles. Middle: Unnormalized Si, Al, Fe and Ti elemental profiles. Bottom: quantitative 29Si/28Si isotopic
ratio.
Figure 5 also presents the isotopic signature of silicon in the alteration layer. The secondary phases display a 29Si/28Si ratio ranging between 3 and 6, which is much higher that the glass signal (0.05). This interval stays within that recorded in the solution (from 10 in the onset solution to 3.5 after 562 days (Table 2)), strongly suggesting that these phases precipitate from aqueous species.
The sodium profiles at different sampling times show how alteration proceeds (figure 6). All the profiles, which were measured in the same way, indicate strong surface depletion, then a pseudo-gradient up to a plateau that marks the boundary with the unaltered material.
17
Figure 6. Unnormalized Na profiles measured for glass monoliths altered for 1, 14, 91, 365 and 600 days. Inset: evolution of the front estimated from the number of abrasion/analysis cycles required to reach half
the profile height.
4. Discussion
4.1 Alteration kinetics of the basaltic glass
The alteration marker typically used to monitor the alteration of nuclear glasses is boron but its concentration was below the quantification limit at most of the measurement times. This is a direct consequence of the low S/V ratio chosen for this study. Recall that this choice was motivated by the need to limit pH variations caused by the release of alkaline and alkaline earth elements from the glass. Sodium can often be used as an alteration marker because it is as soluble as boron and rarely precipitates in secondary phases (Parruzot et al., 2015). This was not possible for this experiment however because more sodium was added as HNO3 to control the
pH than was dissolved from the glass. The other elements released from the glass are all liable to be retained in the alteration layer. Boron was therefore deemed to be the best available alteration marker.
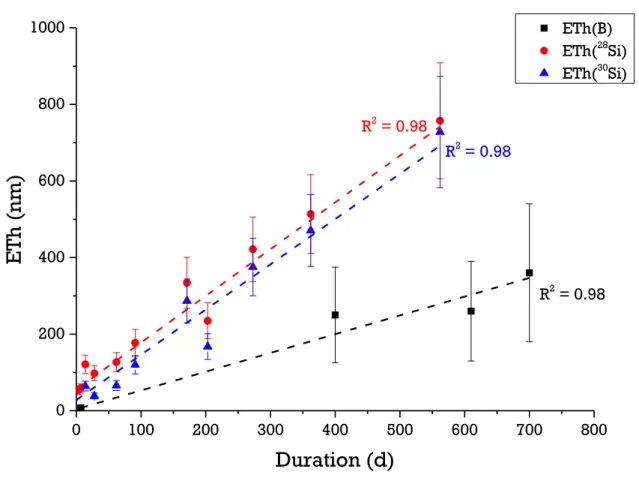
The equivalent thicknesses of altered glass calculated from the boron concentration in solution are shown in figure 7. The value at 7 days is the one measured in the complementary experiment performed at an S/V ratio of 20000 m-1 (cf. appendix 1). This datum can be used assuming that the S/V ratio has no effect on the rate at which the mobile elements in the glass are released
18
under these conditions. This hypothesis, verified for ISG (Gin et al., 2013b) was extended to these conditions. Figure 7 shows that boron is released linearly over time (R2 = 0.98); leading to a constant alteration rate. As activation energy for the hydrolysis of B-O-M (M = Si, Al, Fe,…) bonds is lower than that of Si-O-Si bonds (Zapol et al., 2013), boron release may thus be associated with the dissolution of the silicate network. Let us now consider the behavior of the silicon isotopes to investigate this question further.
0 100 200 300 400 500 600 700 800 0 200 400 600 800 1000 ETh(B) ETh(28Si) ETh(30Si)
ETh (
nm)
Duration (d)
R2 = 0.98 R2 = 0.98 R2 = 0.98Figure 7. Comparison of the evolution versus time of ETh calculated from B, 28Si and 30Si release in solution.
As can be seen in figure 1, silicon isotope concentrations increase with time highlighting hydrolysis of the silicate network. Silicon isotopes coming from the glass contributes to the silicon concentration in solution. This increase is more pronounced for 28Si and 30Si as the solution was initially depleted in this isotopes. .
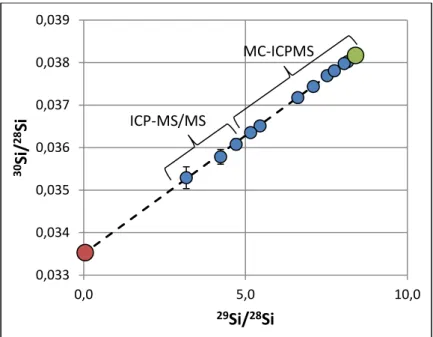
In figure 8 isotope ratios are represented in a three isotope plot 30Si/28Si vs 29Si/28Si. As can be seen, all data follow a straight line between two endmembers, the initial isotope signature of the solution (green dot) and, the glass with a natural silicon isotope ratio (red dot). For the initial isotope signature of the solution measured data on day one and Si isotope ratios of the IRMM-018a (Valkiers et al., 2005) for the glass, were respectively used.
19
Figure 8. 30Si/28Si isotope ratio as a function of the 29Si/28Si ratio, showing a binary mixing between two endmembers: the solution at the start of the experiment, enriched in 29Si (green dot), and the natural abundance of Si (red dot). It can
be noted the two analytical techniques used in this study provide the same trend.
This result is a robust proof that the isotopic variations observed in solution are the result of a binary mixing and the mechanism involved must therefore be hydrolysis of the glass leading to the release of silicon into the solution.
The mixing factor for 28Si between the glass and the solution, F, i.e. the proportion of 28Si from the glass in the total amount [28Si in the initial solution + 28Si released from the glass] measured in solution, can be calculated precisely from the relationship describing the isotopic mixing between the two extremes. This is shown in figure 9, with the 1-day solution used once more as a reference.
Raddedmixture = Raddedglass* F + (1 - F)* Raddedsolution (8)
Solving this equation for F yields the data for 28Si shown in figure 9. 0,033 0,034 0,035 0,036 0,037 0,038 0,039 0,0 5,0 10,0 30
Si/
28Si
29Si/
28Si
0 10 20 30 40 50 60 70 0 100 200 300 400 500 600%
of
28Si
fr
om
th
e
g
la
ss
in
so
lu
ti
on
days
ICP-MS/MS MC-ICPMS20
Figure 9. Evolution over time of the proportion of 28Si released from the glass in the total amount in solution.
This method is accurate because it only involves isotopic ratios that are precisely measured. The values obtained are in good agreement with the data discussed previously in this section. At 562 days for instance, the calculated mixing factor is 62 % and the value obtained from table 2, (28Si562d – 28Si1d) / 28Si562d *100, is 65 %.
Overall these isotopic analyses demonstrate that the silicate network of the glass dissolves, releasing orthosilicic acid into the solution, which mixes with that already present, and amorphous silica then precipitates on the glass surface. The amounts of 28Si and 30Si released from the glass can be used to calculate an equivalent thickness of altered glass (figure 7). Similar values are obtained for the two isotopes and as for boron, the increase is linear. However, the equivalent thicknesses calculated from the silicon isotopes are a factor 2 higher than those calculated from the boron concentrations. This difference is surprising and suggests that either the total silicon concentration in the solution was overestimated or that of boron underestimated. This second hypothesis is the most plausible given the large uncertainties associated with the measurements of very low boron concentrations ( 50 %).
The alteration rates calculated for BGB from the boron, 28Si and 30Si concentrations are
respectively (1.9 ± 0.6) x10-3, (3.9 ± 0.2) x10-3 and (4.4 ± 0.3) x10-3 g.m-2.d-1. These values are two
orders of magnitude higher than the residual rates measured by Parruzot et al. for the same glass at 90°C and pH 9.3 (Parruzot et al., 2015). Assuming that diffusion of aqueous species through the growing alteration layer has a negligible effect in these conditions, the only mechanisms that could explain this difference in kinetics between pH 7 and pH 9.3 are glass dissolution and secondary phase precipitation.
4.2 Interpretation of ToF-SIMS profiles
TEM analyses revealed that, in the tested conditions, both a smectite-type phase and amorphous silica precipitated on the glass surface. ToF-SIMS data are more complicated to explain. Here we discuss how it is possible to make them consistent with TEM data.
First, the abrasion rate of the secondary phases by the ToF-SIMS ion beam was compared with the mean abrasion rates of altered and pristine glass. Differences between these abrasions rates would lead to different depths being analyzed by ToF-SIMS for each layer. Two profiles were measured in a sample altered for 600 days, one of which was halted in the secondary phase region while the other measurement was continued into the unaltered region. The depth of the craters produced in the material was then measured by profilometry. The abrasion rate calculated using the length of the two experiments was found to be approximately 0.03 ± 0.01 nm.s-1 in both cases. Since the abrasion rates of the different layers are similar and assuming that the nature of the secondary phases does not change over time, this validates the relative position of the Na front shown in Figure 6 (inset).
The alteration of the glass by hydrolysis should lead to the appearance of a clear interface progressing parallel to the initial surface. However, gradients are observed in all the ToF-SIMS profiles, which seems to contradict the fact that no diffusive phenomenon was detected.
To address this issue, let us consider the behavior of Si. While the concentrations of all the elements apart from silicon plateau at the level corresponding to pristine glass at around 1 200
21
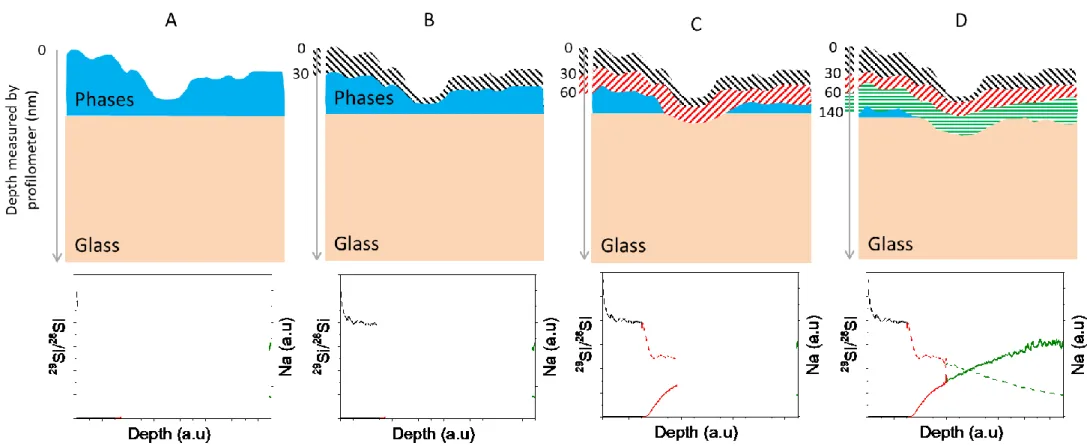
cycles, the 29Si/28Si isotope ratio remains much higher than in the glass (29Si/28Si 1, whereas at natural abundance, the ratio is 0.05). The solution cannot diffuse into the pristine glass without any rupture of the covalent bonds and thus without any release of network forming and modifying species. The high isotopic ratio is therefore not due to the entry of the solution into the glass, but to the mixing of the different regions during the analysis, as illustrated in figure 10. It is therefore an artifact caused by the high external roughness (from the presence of precipitates) of the samples. These mixing effects artificially enlarge the alteration front.
This artifact also makes it impossible to precisely locate the reactive region observed by TEM and thus investigate the possible diffusion release of boron and alkali elements in this region.
22
Figure 10. Schematic diagrams of the area analyzed by ToF-SIMS and the depth measured by profilometry (left axis) for a sample covered by an uneven layer of
secondary phases. A: initial state of the sample before analysis. The graph beneath the diagram shows the number of sodium (right axis) and silicon (29Si/28Si isotopic ratio, left axis) counts detected. B: analysis of the first few nanometers of the precipitated phases (black line). The 29Si/28Si ratio is constant and there are
close to zero Na counts. C: as the analysis proceeds (the analyzed area is shown in red), the initial roughness means that so me pristine glass is measured at the same time as the secondary phases: this is a mixing region. The 29Si/28Si ratio decreases (because the silicon in the glass is at natural abundance, with 29Si/28Si = 0.05) and the number of Na counts increases. D: the mixing area analyzed (in green) still contains secondary phases, but more and more pristine glass: the Na and
29
Si/28Si profiles gradually reach the levels measured for pristine glass. The planar interface between the secondary phases and the glass, which should appear as a sharp step in the ToF-SIMS profile, appears instead as a gradient.
23
Time-of-flight SIMS thus only reveals the relative position of the region in which the different phases mix (i.e. they are analyzed simultaneously). Entry into this region is highlighted by a decrease in the 29Si/28Si ratio and an increase in the sodium signal.
While the shape of the gradient can be attributed to the presence of mixing areas during the analysis, the rate at which the mixing area progresses does not depend on the square root of time. The position of the front, determined from the number of abrasion/analysis cycles required to reach half the profile height, seems to advance at a constant rate (figure 6 inset, R2 = 0.87). This comparison is valid because the different samples were analyzed under the same conditions.
Once discarded the artefacts, the ToF-SIMS data fit with the hypothesis that the glass undergoes congruent dissolution and precipitation of secondary phases.
4.3. Process governing the alteration of BG
Bglass in a solution initially saturated
with respect to amorphous silica
The results discussed above allow us to propose a reaction mechanism whereby the basaltic glass dissolves congruently in spite of the initial solution’s silicon saturation.
Hydration, interdiffusion and hydrolysis of the silicate network may dominate at the very start of the alteration process. These reactions slow down very rapidly though and the silicon concentrations level out, as shown by the short-term test performed at 20000 m-1 (appendix 1). The interface layer of a few nanometers observed by TEM may correspond to this interface region deleted in B, Na, Ca, Fe, Ti and Mg. These soluble elements accumulate in the solution, whereas the other released elements, Fe, Ti, Mg and some of the Al and Si, which are poorly soluble, precipitate, forming the secondary phases we identified. The formation of these phases containing the main network forming species in basaltic glass may be facilitated by the presence of nickel in the solution (from the alkaline fusion reaction) and its high alkaline content. Nickel is a transition metal known to integrate into phyllosilicates and increase their alteration rate (Aréna, 2016), while K, Na et Ca ensure charge balance in the clays.
To better understand the driving forces in play, we calculated the mass balance and density of the reactive area following the release of B, Na, Ca, Fe, Ti, Mg and some of the Al and Si (table 3). We did this by considering the distribution of elements between the secondary phases and the solution. We ignored the minor elements Mn, Sr, K and P.
There was no limit in these calculations for the concentrations of B, Na and Ca in the solution. These elements are indeed highly soluble under our experimental conditions. The other elements were immobilized in different secondary phases (see table 3). Since little is known about the chemistry of titanium under these conditions, we chose to incorporate all the titanium released by the glass in an oxide phase. The magnesium and iron released by the glass were also entirely immobilized in smectite phases, with silicon and aluminum depending on the stoichiometry of the chosen phase. We chose a magnesium and an iron smectite, both characterized by (Aréna et al., 2017) during a study of the alteration of nuclear glass in the presence of magnesium and iron. The altered glass is then made up of the remaining elements from the pristine glass and its density can be calculated, giving an estimate of the relative degree of polymerization of the different glasses. The density of the altered glass was calculated using the following formula:
24
(9)
Table 3. Distribution of the elements in the glass between the solution and the secondary phases. The composition and density of the altered glass (AG) were calculated using the remaining elements. The densities were calculated assuming that the volume remains constant and that all the elements are present
in the form of oxides. . *The oxygen content of each phase was obtained by stoichiometry based on the
species SiO2, Al2O3 and ZrO2.
Glass composition (mol%) Elements in solution Secondary phases AG composition (mol%) dAG (g.cm-3) BGB Si19.4Al6.7Fe2.6Ca3.1Mg3.1 Na1.8B0.6Ti0.4Sr0.1K0.1 Mn0.1P0.1O61.9 B, Na, Ca, Sr, K, P TiO2, Si3.9Mg2.9Al0.2O10 (Aréna et al., 2017) Si3.8Fe2.8Al0.4O10 (Aréna et al., 2017) Si10.9Al6.12O*31 1.26 CJ1 Si20.2B10.7Na8.5O60.6 B, Na - Si20.2O * 40.4 1.60 ISG Si18B9.6Na7.6Al2.3Ca1.7 Zr0.5O60.3 B, Na, Ca - Si18Al2.3Zr0.5O*40.4 1.60
We then compared BGB with CJ1 glass, a ternary glass with the same stoichiometry as ISG but
containing no Al, Zr or Ca. This simple glass was selected because it also dissolves congruently in solutions even if they are saturated with respect to amorphous silica (Gin et al., 2012; Jegou et al., 2000). Boron and sodium, which are highly soluble, are rapidly released from this glass into the solution. The density (calculated as above) of the altered glass, which is only composed of silicon and oxygen, is 1.6 g.cm-3, compared with 2.45 g.cm-3 for the pristine glass. This material is therefore highly depolymerized and thus very soluble.
Since the altered layer of the basaltic glass is less dense (1.26 g.cm-3) than the altered ternary glass, it should dissolve in the same way, in spite of the initial silicon saturation of the solution. The solution would then become oversaturated with respect to amorphous silica, which would precipitate, and the alteration of the glass would then proceed under steady-state conditions. Figure 11 summarizes the mechanism we propose to explain how the basaltic glass is altered under silicon saturation conditions. Alteration is mainly driven by the precipitation of clays, which consume Si and other elements from the glass such as Mg, Fe, Al and possibly Ti. The release of these elements makes the remnant material easier to dissolve, and the additional influx of silica leads to the precipitation of amorphous silicon on the surface of the glass. The glass dissolution process appears congruent overall.
Monte-Carlo simulations of glass alteration (Devreux and Barboux, 2001; Devreux et al., 2001) show that dissolution of the network modifiers affects the depolymerization of the silica tetrahedra on the surface of the glass. The release of these elements leaves most of the silicon in Q2 units (the superscript in the Qn notation indicates the number of bridging oxygens per SiO4
25
tetrahedron). Once they condense to form a gel or amorphous silica, the silicon atoms mostly form Q4units. This is a kinetic mechanism that could promote the dissolution of silicon atoms on the surface of the glass in favor or more stable silicate phases, such as amorphous silicon.
a) Interdiffusion and hydrolysis lead to the release of the components of the glass; the
solution rapidly becomes
oversaturated with respect to clays. These phases precipitate. b) The continued precipitation of clays maintains the release of Fe, Mg, Ti and some of the Al.
c) The glass network becomes
depleted in the elements
composing the clays and thus highly depolymerized; it dissolves and amorphous silica precipitates. d) The layer of secondary phases (SiO2 + clays) becomes thicker,
and so long as it does not block diffusion, the glass dissolves at a constant rate.
Figure 11. Alteration process for basaltic glass under silicon saturation conditions.
4.4 Comparison with nuclear glass
The mechanisms governing the alteration of silicate glasses in contact with water remain a topic of interest. A particular subject of debate is the mechanism responsible for the formation of a passivating amorphous layer (Geisler et al., 2015; Gin et al., 2017; Gin et al., 2016; Hellmann et al., 2015; Putnis, 2015). Since basaltic glasses is considered to be a natural analogue to nuclear borosilicate glasses, the results obtained in this study contribute to re-evaluate this assertion. Under the same experimental conditions (90°C, pH 7, silicon-saturated solution), ISG behaves differently from BGB (Gin et al., 2015). The initial alteration rate of the glass (1 g.m-2.d-1)
decreases rapidly down to 2 x 10⁻⁴ g.m-2.d-1 after 365 days and then remains stable. This residual rate is 20 times lower than that measured for the basaltic glass in similar conditions. But because basaltic glass dissolves slower in the early stage of reaction (see explanation below), after one year, the equivalent thickness of altered glass is about 1.5 µm for ISG, compared with
26
soluble cations that make up the glass network (Si, Al and Zr) are not completely hydrolyzed during the alteration, whereas the more mobile elements (B, Na and Ca) are. The layer left behind by the release of these elements reorganizes through condensation reactions (formation of siloxane bonds) and acts as a “molecular sieve” that only lets the smallest molecules pass. A different behavior is observed for BGB, in which all the elements are hydrolyzed and enter the
solution, before the less soluble elements precipitate in the form of secondary phases. The differences in the thickness of the altered layer and the alteration mechanism for ISG and BGB
can be explained by their different compositions. Network modifiers tend to form channels in the glass network, which facilitate the transport of cations and water therein (Greaves, 1990). The lower network modifier content of BGB glass explains why the apparent water diffusion coefficient
in the pristine glass (measured over short time periods at 50 °C and pH 3 to avoid too much hydrolysis) is higher in ISG (9.8 x 10⁻²⁰ m2.s-1) than in BGB (5.3 x 10⁻²¹ m2.s-1) (Parruzot et al.,
2015). This also explains the better chemical durability of BGB under initial rate conditions. The
initial dissolution rate of BGB is indeed 0.15 ± 0.07 g.m-2.d-1 at 90 °C and pH 7 (Parruzot, 2014),
compared with 1.2 g.m-2.d-1 for ISG under the same conditions (Inagaki et al., 2013).
ISG differs from CJ1 glass in that the former contains “hardening” elements (with a coordination number equal to or greater than that of Si and a Si-O-hardener bond dissolution energy higher than that of Si-O-Si bonds) such as Al and Zr. The effect of these elements is so strong that altered ISG glass, despite being no denser than altered CJ1 glass (see table 3), does not hydrolyze if the solution becomes saturated in Si. Aluminum is known to be strongly retained in the gel (Chave, 2008; Noguès, 1984), because of its low solubility at neutral pH. Aluminum also acts as a cross-linking element in the gel and thus contributes to its passivating nature. Calcium, which is present in ISG but not in CJ1 glass, also has a strong effect on the diffusivity of the pristine glass and thus on its resistance to hydrolysis. Adding just a small amount of calcium (3 wt.% calcium oxide) reduces the water diffusion coefficient in the pristine glass by two orders of magnitude (Chave et al., 2011; Rebiscoul et al., 2012).
Nevertheless, a comparison with BGB shows that when aluminum is destabilized and enters
secondary phases, it loses its crosslinking effect in the gel. The good chemical durability of ISG with respect to hydrolysis therefore seems to stem from the fact that this glass does not contain any elements liable to form secondary crystalline phases (under the experimental conditions used in this study, namely 90 °C and a near neutral pH). Contrary to what happens in BGB therefore,
the network of glass-forming species remains unperturbed and can reorganize into a dense and passivating gel following the release of the more mobile elements.
5. CONCLUSION
Basaltic glass is commonly considered a natural analogue of nuclear glasses. To re-examine this assertion, a key experiment designed to study the formation mechanisms of the passivating layer on ISG (Gin et al., 2015) was repeated for the sake of comparison using a synthetic basaltic glass. In our experiments, beyond the reaction interface layer, a few nanometers thick, no passivating or other material similar to the alteration gel observed on nuclear glass formed. This study highlights the strong effects of glass composition on the mechanism that limits the alteration rate of the glass in the long term. For basaltic glasses, the main alteration mechanism
27
under saturation conditions (Si-enriched solution, pH 7, 90 °C) seems to be the slow hydrolysis of the glass network maintained by the transformation of the hydration layer into more or less crystalline secondary phases. Diffusion does not seem to contribute to the alteration of this glass, contrary to what is observed for ISG.
The size and properties of the reactive area are difficult to determine using this experiment. Alteration probably starts with the preferential release of alkaline species from the glass, but this must only affect a few nanometers. This process depolymerizes the glass and makes the network-forming species involved in secondary phases more hydrolysable. This transfer of elements to secondary phases is the main driver of alteration, destabilizing the silicate network in spite of the high concentration of dissolved silica in the solution.
Studies of basaltic glasses altered in natural environments do indeed show that dissolution/precipitation has a limiting role in the sufficiently confined environments simulated by our experimental conditions. In most cases, these glasses are covered by a thin amorphous layer—a few tens or hundreds of nanometers thick—and a much thicker layer of secondary phases (Crovisier, 1989; Hay and Iijima, 1968; Le Gal, 1999), which reveal how alteration is controlled by the transformation of the glass into more stable crystalline materials.
28
References
Aréna, H., 2016. Effets cumulatifs et compétitifs des éléments chimiques sur l'altération des verres nucléaires, Thèse de l'Université Montpellier 2.
Aréna, H. et al., 2017. Impact of iron and magnesium on glass alteration: Characterization of the secondary phases and determination of their solubility constants. Applied Geochemistry, 82(Supplement C): 119-133.
Barone, G. et al., 2016. Nanoscale surface modification of Mt. Etna volcanic ashes. Geochimica et Cosmochimica Acta, 174: 70-84.
Benzerara, K. et al., 2007. Alteration of submarine basaltic glass from the Ontong Java Plateau: A STXM and TEM study. Earth and Planetary Science Letters, 260(1-2): 187-200.
Berger, G., Schott, J., LOUBET, M., 1987. Fundamental Processes controlling the 1st stage of aleration of a Basalti Glass by seawater - An experimental-study between 200-degrees-C ans 320-degrees-C . Earth and Planetary Science Letters, 84(4): 431-445.
Bunker, B.C., 1994. Molecular Mechanisms for Corrosion of Silica and Silicate-Glasses. Journal of Non-Crystalline Solids, 179: 300-308.
Cailleteau, C. et al., 2008. Insight into silicate-glass corrosion mechanisms. Nature Materials, 7(12): 978-983.
Cailleteau, C., Devreux, F., Spalla, O., Angeli, F., Gin, S., 2011. Why Do Certain Glasses with a High Dissolution Rate Undergo a Low Degree of Corrosion? Journal of Physical Chemistry C, 115(13): 5846-5855.
Chave, T., 2008. Etude des mécanismes d'altéraion par l'eau du verre R7T7 en milieu confiné, compréhension et modélisation de la cinétique résiduelle, Thèse de l'Université Montpellier 2, Sciences et Techniques du Languedoc.
Chave, T., Frugier, P., Gin, S., Ayral, A., 2011. Glass-water interphase reactivity with calcium rich solutions. Geochimica and Cosmochimica Acta, 75(15): 4125-4139.
Crovisier, J.L., 1989. Dissolution des verres basaltiques dans l'eau de mer et dans l'eau douce. Essai de modélisation. Doctorat Thesis, Université Louis Pasteur (Strasbourg), 251 pp. Crovisier, J.L., Advocat, T., Dussossoy, J.L., 2003. Nature and role of natural alteration gels
formed on the surface of ancient volcanic glasses (Natural analogs of waste containment glasses). Journal of Nuclear Materials, 321: 91-109.
Crovisier, J.L., Honnorez, J., Eberhart, J.P., 1987. Dissolution of basaltic glass in seawater: Mechanism and rate. Geochimica and Cosmochimica Acta, 51: 2977-2990.
Daux, V., Guy, C., Advocat, T., Crovisier, J.L., Stille, P., 1997. Kinetic aspects of basaltic glass dissolution at 90 degrees C: role of aqueous silicon and aluminium. Chemical Geology, 142(1-2): 109-126.
Devreux, F., Barboux, P., 2001. Numerical modelling of glass dissolution : gel layer morphology. Journal of Nuclear Materials, 298(1,2): 145-149.
Devreux, F., Barboux, P., Filoche, M., Sapoval, B., 2001. A simplified model for glass dissolution in water. Journal of Materials Science, 36: 1331-1341.
Ewing, R.C., 1979. Natural glasses: analogues for radioactive waste forms., Scientific Basis for Nuclear Waste management I. Materials Research Society, Boston, pp. 57-66.
Fournier, M., Gin, S., Frugier, P., 2014. Resumption of nuclear glass alteration: State of the art. Journal of Nuclear Materials, 448(1-3): 348-363.
Fournier, M. et al., 2016. Glass dissolution rate measurement and calculation revisited. Journal of Nuclear Materials, 476: 140-154.
Frugier, P. et al., 2008. SON68 nuclear glass dissolution kinetics: Current state of knowledge and basis of the new GRAAL model. Journal of Nuclear Materials, 380(1-3): 8-21.
Geisler, T. et al., 2010. Aqueous corrosion of borosilicate glass under acidic conditions: A new corrosion mechanism. Journal of Non-Crystalline Solids, 356(28-30): 1458-1465.
Geisler, T. et al., 2015. The mechanism of borosilicate glass corrosion revisited. Geochimica et Cosmochimica Acta, 158: 112-129.
29
Georg, R.B., Reynolds, B.C., Frank, M., Halliday, A.N., 2006. New sample preparation techniques for the determination of Si isotopic compositions using MC-ICPMS. Chemical Geology, 235(1-2): 95-104.
Gin, S., 2014. Open scientific questions about nuclear glass corrosion. 2nd International Summer School on Nuclear Glass Wasteform: Structure, Properties and Long-Term Behavior (Sumglass 2013), 7: 163-171.
Gin, S. et al., 2013a. An international initiative on long-term behavior of high-level nuclear waste glass. Materials Today, 16(6): 243-248.
Gin, S., Beaudoux, X., Angeli, F., Jegou, C., Godon, N., 2012. Effect of composition on the short-term and long-short-term dissolution rates of ten glasses of increasing complexity from 3 to 30 oxides. Journal of Non-Crystalline Solids, 358(18-19): 2559-2570.
Gin, S., Frugier, P., Jollivet, P., Bruguier, F., Curti, E., 2013b. New insight into the residual rate of borosilicate glasses: effect of S/V and glass composition. submitted to International Journal of Applied Glass Science, 4(4): 371-382.
Gin, S., Frugier, P., Jollivet, P., Bruguier, F., Curti, E., 2013c. New Insight into the Residual Rate of Borosilicate Glasses: Effect of S/V and Glass Composition. International Journal of Applied Glass Science, 4(4): 371-382.
Gin, S. et al., 2017. Atom-Probe Tomography, TEM and ToF-SIMS study of borosilicate glass alteration rim: A multiscale approach to investigating rate-limiting mechanisms. Geochimica et Cosmochimica Acta, 202(Supplement C): 57-76.
Gin, S. et al., 2015. Origin and consequences of silicate glass passivation by surface layers. Nature Communications, 6.
Gin, S. et al., 2016. The controversial role of inter-diffusion in glass alteration. Chemical Geology, 440: 115-123.
Gislason, R., Eugster, H.P., 1987. Meteoric water-basalt interactions. I: A laboratory study. Geochimica and Cosmochimica Acta, 51: 2827-2840.
Gislason, S.R., Oelkers, E.H., 2003. Mechanism, rates, and consequences of basaltic glass dissolution: II. An experimental study of the dissolution rates of basaltic glass as a function of pH and temperature. Geochimica et Cosmochimica Acta, 67(20): 3817-3832. Gislason, S.R. et al., 2013. Solubility and Mineral Storage of CO2 in Basalt. Mineralogical
Magazine, 77(5): 1178.
Gourgiotis, A. et al., 2017. Silicon isotope ratio measurements by inductively coupled plasma tandem mass spectrometry for alteration studies of nuclear waste glasses. Analytica Chimica Acta, 954(Supplement C): 68-76.
Grambow, B., Muller, R., 2001. First-order dissolution rate law and the role of surface layers in glass performance assessment. Journal of Nuclear Materials, 298(1-2): 112-124.
Greaves, G.N., 1990. EXAFS for studying corrosion of glass surfaces. Journal of Non-Crystalline Solids, 120: 108-116.
Guyot, F. et al., 2011. CO2 geological storage: The environmental mineralogy perspective. Comptes Rendus Geoscience, 343(2): 246-259.
Gysi, A.P., Stefansson, A., 2012. Experiments and geochemical modeling of CO2 sequestration during hydrothermal basalt alteration. Chemical Geology, 306307(0): 10-28.
Hay, R.L., Iijima, A., 1968. Nature and Origin of Palagonite Tuffs of the Honolulu group on Oahu, Hawaii. Geological Society of America: 331-376.
Hellmann, R. et al., 2015. Nanometre-scale evidence for interfacial dissolution-reprecipitation control of silicate glass corrosion. Nature Materials, 14(3): 307-311.
Icenhower, J.P., Steefel, C.I., 2015. Dissolution rate of borosilicate glass SON68: A method of quantification based upon interferometry and implications for experimental and natural weathering rates of glass. Geochimica Et Cosmochimica Acta, 157: 147-163.
Inagaki, K., Furuya, H., Idemitsu, K., Arima, T., 1998. Review of waste glass corrosion and associated radionuclide release as a part of safety assessment of entire disposal system. Progress in Nuclear Energy, 32(3-4): 501-508.
Inagaki, Y., Kikunaga, T., Idemitsu, K., Arima, T., 2013. Initial Dissolution Rate of the International Simple Glass as a Function of pH and Temperature Measured Using Microchannel Flow-Through Test Method. International Journal of Applied Glass Science, 4(4): 317-327.