HAL Id: hal-01513747
https://hal.inria.fr/hal-01513747
Submitted on 25 Apr 2017HAL is a multi-disciplinary open access
archive for the deposit and dissemination of sci-entific research documents, whether they are pub-lished or not. The documents may come from teaching and research institutions in France or abroad, or from public or private research centers.
L’archive ouverte pluridisciplinaire HAL, est destinée au dépôt et à la diffusion de documents scientifiques de niveau recherche, publiés ou non, émanant des établissements d’enseignement et de recherche français ou étrangers, des laboratoires publics ou privés.
Energy-Efficient Service Function Chain Provisioning
Nicolas Huin, Andrea Tomassilli, Frédéric Giroire, Brigitte Jaumard
To cite this version:
Nicolas Huin, Andrea Tomassilli, Frédéric Giroire, Brigitte Jaumard. Energy-Efficient Service Func-tion Chain Provisioning. InternaFunc-tional Network OptimizaFunc-tion Conference 2017, Feb 2017, Lisbonne, Portugal. �hal-01513747�
Energy-Efficient Service Function Chain
Provisioning
Nicolas Huin, Andrea Tomassilli, Fr´ed´eric Giroire
Universit´e Cˆote d’Azur, CNRS, Inria, Sophia Antipolis, France
Brigitte Jaumard
Computer Science and Software Eng., Concordia University, Montreal, Canada
Abstract
Network Function Virtualization (NFV) is a promising network architecture con-cept to reduce operational costs. In legacy networks, network functions, such as firewall or TCP optimization, are performed by specific hardware. In networks en-abling NFV coupled with the Software Defined Network (SDN) paradigm, network functions can be implemented dynamically on generic hardware. This is of primary interest to implement energy efficient solutions, in order to adapt dynamically the resource usage to the demands. In this paper, we study how to use NFV coupled with SDN to improve the energy efficiency of networks. We consider a setting in which a flow has to go through a Service Function Chain, that is several network functions in a specific order. We propose a decomposition model that relies on chaining and function placement configurations to solve the problem. We show that virtualization allows to obtain between 15% to 62 % of energy savings for networks of different sizes.
Keywords: Network Function Virtualization, Service Function Chains, Software Defined Networks, Energy Efficiency, Optimization, Column Generation.
1
Introduction
Nowadays, network operators are trying to reduce their operational costs by smartly upgrading their networks using two recent promising paradigms: Software Defined Network (SDN) and Network Function Virtualization (NFV). SDN decouples the data plane from the control plane, and puts the intelligence into a centralized controller. It allows the deployment of advanced dynamic protocols and of finer network optimization based on metrology data, regularly collected by network nodes and sent to the controller.
For security and efficiency reasons, network flows have to go through a number of network functions, e.g., firewall, load balancers, video optimizer controller, which are traditionally implemented on specific hardware. This leads to inefficiency as the hardware is provisioned for peak traffic. NFV paradigm aims at virtualizing the functions to obtain Virtualized Network Functions (VNFs), which can then be implemented on generic hardware. Cou-pled with SDN, VNFs can be installed dynamically when needed, at the best network location, at the best time, and only for the adequate traffic. This allows a reduction of hardware cost (Capex) and of operational cost (Opex).
One of the important operational cost is the energy used by the network. With the sharp increase of Internet traffic, networks have to be more en-ergy efficient [10]. To this end, Energy-Aware Routing solutions have been proposed, see e.g., [3]. The principle is to aggregate traffic on a number of network equipment as small as possible, in order to turn off the unused ones. SDN and NFV will allow such an implementation into practice by enabling dynamic routing and network function provisioning.
In this paper, we explore the potential of network virtualization to reduce network energy consumption. We consider a setting in which a network flow has to go through a Service Function Chain (SFC), that is an ordered sequence of VNFs. We study the problem of minimizing network energy consump-tion, while both satisfying the link/node capacity constraints and the SFC constraints. We call this problem the Capacitated Energy Efficient Service Function Chain Provisioning Problem, EE-SFCPfor short.
Several optimization models were proposed in the literature to solve the Service Function Chain Provisioning problem [14,5,9,11,13,6]. However, these works do not consider the minimization of the network energy consumption under a dynamic traffic. Our contributions are:
• A CG model to solve the EE-SFCP problem on large instances.
• Enhancement of the model with the use of cuts as theEE-SFCPproblem is a
On-Off phenomena, as a network device consumes a large portion of its energy as soon as it is used, even if very lightly used. Cuts allow the reduction of the integrality gap.
• Extensive numerical evaluations on networks of different sizes. We show
that between 15% to 62% of energy can be saved while respecting the SFC constraints.
• A latency analysis with respect to switching off some network elements for
energy savings.
2
Statement of the Problem: SFC and VNF Placement
Notations. We assume the network to be represented by a directed graph G= (V, L), where V is the set of nodes (indexed by v) and L is the set of links (indexed by `). Each node v ∈ V has a a set of compute, storage and network resources denoted by Cv to host network functions. Within this study, we will
assume that the resources are described by a given number of cores. Each link has a bandwidth capacity denoted C`
Traffic is described by a set of demand requests D, in which each demand d is defined by a 3-tuple (vs, vd, c), where vs is the source of the demand, vd
its destination, and c the requested service chain. Indeed, each demand d is associated with a given application, which is required to pass through a given SFC. Let Dc
sd be the bandwidth requirement of demand d.
Let F be the overall set of virtual functions arising in the service chains, indexed by f , and C be the set of service chains, indexed by c. Each service chain c corresponds to a sequence of ncfunctions f1c, . . . , fic, . . . , fncc, where f
c i
denotes the ith function of chain c. Note that some functions may appear more than once in a given chain and that for various reasons (e.g., resiliency, privacy), two different functions f and f0 may not be allowed to be installed
in the same node. Each virtual function f has its one resource requirement and we denote by ∆f the number (fraction) of cores required by function f
per bandwidth unit.
The Energy Efficient Service Function Chain Provisioning (EE-SFCP)
prob-lem consists in jointly provisioning a set D of demand requests coupled with service function chains C and placing virtual functions arising in the chains, in order to minimize the network energy consumption, subject to link and node capacities.
Power Model. Campaigns of measures of power consumption (see, e.g., [2]) show that a network device consumes a large amount of its power as soon as it is switched on and that the energy consumption does not depend much on
the load. Following this observation, on/off power models have been proposed and studied. Later, researchers and hardware constructors have proposed more energy proportional hardware models [12]. To encompass those different models, we use a hybrid power model in which the power of an active link ` is expressed as P` = P`on+bwC``P
max
` ,where P`on represents the energy used when
the link ` is switched on, bw` the bandwidth that is carried on `, and P`max
the energy consumed by ` when it is fully capacitated, i.e., when the amount of carried bandwidth equals the transport capacity (Clink
` ) of link `.
We assume that links can be put into sleep mode, by putting to sleep both endpoint interfaces. Two links in opposite direction between a pair of nodes will be assumed to be in the same state (active or in sleep mode), as the send and receive elements of a unidirectional fiber are usually controlled by the same interface. Routers cannot be put into sleep mode, as there are the sources/destinations of network traffic. However, cores may be put into sleep mode and the power used by node v is equal to Pv = Pvunit × #cores, with
Punit
v being the energy consumption of a single core.
Layered Graph. Following an idea similar to [4], we use a layered graph Gl that is defined as follows. We add max
c∈C nc layers to the original graph G
and each layer contains a copy of G. For every node v ∈ V , let vi be the
corresponding node in the ith layer (i = 0, 1, . . . , nc). Every (i − 1, i) layer
pair is connected by (vi−1, vi) links. We denote by L(Gl) and by V (Gl) the
set of links and nodes of graph Gl, respectively. Provisioning of a chain and
node placement of its functions amounts to find a path from node vs on the
first layer (graph G) to node vd on the ncth layer. Placement of a function on
a node is given by the endpoints of the link used to switch between layers. We next set a column generation model forEE-SFCP, which makes use of
the layered graph Gl.
3
Decomposition Models
We first present here a model using Column Generation, CG-simple. We then introduce two variants of the models, CG-cut, and CG-cut+. Indeed, problems dealing with energy-efficiency frequently lead to large integrality gap and bad precision. This is due to the On-Off phenomena of power models, which translates into large steps of the objective function. We thus try to improve the precision of the model by introducing different sets of constraints. We discuss the precision of the models in Section 4.2.
3.1 Column Generation Formulation
We propose a column generation formulation that relies on the concept of chaining & function placement configurations: each configuration γ is asso-ciated with a 3-uplet (vs, vd, c) and defines: (i) a potential route for demand
Dc
sd associated with node pair (vs, vd) for chain c and, (ii) node placement
of the functions of chain c along the potential route. Route is described by parameters δγ`, equal to 1 if link ` belongs to the path, 0 otherwise. Node placement is given by aγvfi, equal to 1 if the ith function fi of c is located at
node v, 0 otherwise. We denote by Γd the overall set of configurations for a
demand d.
We now define the set of variables. First set of decision variables: x` = 1
if link ` is on (active), 0 otherwise. Note that links are powered off by pair, i.e., x`=(v,v0) = x`0=(v0,v). Second set of decision variables: yγ
d = 1 if demand
d is routed using configuration γ, 0 otherwise. Integer variables: reqv = #
required cores in node v.
The objective, i.e., the minimization of the energy, can be written
minX `∈L Pon ` x` | {z } link switch on energy +X `∈L X γ∈Γ δ`γ X d=(vs,vd,c)∈D Dsdc Clink ` P`max y γ d | {z }
link bandwidth energy
+ X
v∈Vnfv
Pvreqv
| {z }
node resource energy . (1)
The constraint set decomposes into three sets of contraints.
One path per demand: X
γ∈Γd yγd = 1 d= (vs, vd, c) ∈ D (2) Link capacity: X d=(vs,vd,c)∈D X γ∈Γd Dcsdδγ` yγd ≤ x`C`link ` ∈ L (3) Node capacity:X d∈D X γ∈Γd Dsdc ( nc X i=1 ∆fia γ vfi)y γ d ≤ reqv ≤ Cvnode v ∈ Vnfv. (4)
As we faced issues with large integrality gaps, we enhanced model (1)-(4) with different sets of cuts, through the next two models.
CG-cut model. First set of Inequalities in (5) states that, for each node, at least one incident link should always be on. Moreover, second inequality of (5) enforces that at least n − 1 links should be on to have a connected network (or different if not all-to-all).
X `∈ω+(v) x`≥ 1 v ∈ V ; X `∈L x` ≥ n − 1. (5)
CG-cut+ model. We enhance further the CG-cut model with: x` ≥
X
γ∈Γd
δ`γydγ ` ∈ L, γ ∈Γd (6)
Using (2), it follows that P
γ∈Γd
δ`γydγ ≤ 1. It avoids the use of a big M formulation at the expense of a large number of constraints.
3.2 Solution Scheme
In order to solve efficiently the model of Section 3.1, we need to recourse to column generation for solving the linear relaxation, and then to derive an ILP value, using the last restricted master problem.
There is a configuration generator, i.e., pricing problem, for each d = (vv, vd, c) ∈ D. Two sets of decision variables are required. First set is made
of variables ϕi
` such that ϕi` = 1 if the provisioning of demand d uses link ` in
layer i of the layered graph Gl, 0 otherwise. Second set contains variables ai v
such that ai
v = 1 if the ith function (fi) of chain c for demand d = (vv, vd, c)
is placed on NFV node v, 0 otherwise.
min X `∈L P`max D c sd Clink ` nc X i=0 ϕi`−u(sd2)+X `∈L u(`3)Dcsd nc X i=0 ϕi`+DcsdX v∈V u(v4) nc X i=0 ∆fia i v. (7)
Path computation (flow conservation constraints): X `∈ω+(v) ϕi` − X `∈ω−(v) ϕi`+ aiv− a i−1 v = 0 v ∈ V,0 < i < n c (8) X `∈ω+(v) ϕ0` − X `∈ω−(v) ϕ0` + a0 v = ( 1 if v = vs 0 else v ∈ V (9) X `∈ω+(v) ϕn`c − X `∈ω−(v) ϕn`c− anc v = ( −1 if v = vd 0 else v ∈ V. (10) Link capacity: Dc sd nc X i=0 ϕi` ≤ Clink ` ` ∈ L. (11) Node capacity: Dc sd nc X i=0 ∆fia i v ≤ Cvnode v ∈ Vnfv. (12)
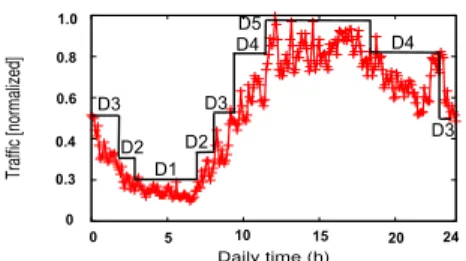
0 0.2 0.4 0.6 0.8 1 0 5 10 15 20 Traffic [normalized] Daily time (h) D1 D2 D3 D2 D4 D4 D5 D3 D3 0.3 0.4 0 0.6 0.8 1.0 0 5 10 15 20 24
Fig. 1. Normalized daily varia-tion of traffic of a France Telecom network link and multi-period ap-proximation
Service Chain Chained VNFs rate % traffic Web Service NAT-FW-TM-WOC-IDPS 100 kbps 18.2%
VoIP NAT-FW-TM-FW-NAT 64 kbps 11.8% Video Streaming NAT-FW-TM-VOC-IDPS 4 Mbps 69.9% Online Gaming NAT-FW-VOC-WOC-IDPS 50 kbps 0.1%
Table 1. Service Chain Requirements [14]
4
Numerical Experiments
We now investigate the energy savings obtained by the CG model. 4.1 Data sets
In networks, demand requests have to go through a different chain of net-work services. In our experiments, we consider four of the most frequent types of requests (applications), see Table 1: Video Streaming, Web Service, Voice-over-IP (VoIP), and Online Gaming. Traffic percentages come from [8]. For each request type, we give the required SFC and its corresponding bandwidth. In total, 6 different functions are used, and each function requires a different amount of cores to be executed.
We tested the CG model on three topologies of different sizes from SNDlib
(http://sndlib.zib.de/): pdh (11 nodes and 64 directed links), atlanta
(15 nodes and 44 directed links), and germany50 (50 nodes and 176 directed
links).
For each network, we generate a set of demands from the traffic matrices provided in SNDLib: we divide each aggregate flow from a source to a destina-tion into four demands corresponding to the four types of traffic. The original load of the flow is kept and each subflow load is given by the distribution of the last column of Table1. For example, a flow with a charge of 1 is split into a Web Service, a VoIP, a Video Streaming and an Online Gaming sub-flows with a respective charge of 0.182, 0.118, 0.699 and 0.001.
We tested the solution on a daily traffic to see how much energy can be saved during the day or at night. The variations of traffic come from a trace of a typical France Telecom link shown in Figure 1. Previous work [1] shows that most of the energy savings can be obtained by using a small number of configurations during the day. In our case, we considered 5 different levels of traffic called D1 to D5. D1 represents the period with the lowest amount of
D1 D2 D3 D4 D5 Time periods 0 10 20 30 4050 60 70 80 90 100 Energy used CG-simple CG-cut CG-cut+
(a) Energy used
D1 D2 D3 D4 D5 Time periods 0.0 0.2 0.4 0.6 0.81.0 1.2 1.41.6 1.8 ε ra tio CG-simple CG-cuts CG-cut+ (b) ε = (˜zilp− z? lp)/z ? lp Fig. 2. Performance of the CG models on pdh
D1 D2 D3 D4 D5 Time periods 0.00 0.05 0.10 0.15 0.20 0.25 0.30 ε ra tio pdh atlanta germany50
Fig. 3. ε accuracy for different networks & traffic sets
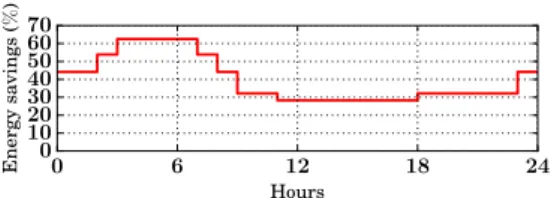
0 6 12 18 24 Hours 0 10 20 30 40 50 60 70 Energy sa vings (% )
Fig. 4. Energy savings during the day forpdhnetwork.
traffic and D5 the one with the highest.
4.2 Quality of the Column Generation Models
We now compare the performance of the three different CG models (CG-simple, CG-cut, and CG-cut+) with respect to their accuracy as given by ε = (˜zilp− z?
lp)/z ?
lp, where ˜zilp represents the value of the integer solution of
the model and z?
lp the value of the linear relaxation. In Figure 2, we compare
the solutions founded by the three CG models for the pdh network and for
the 5 different levels of traffic. Energy used is given in Figure 2a (Error bars represent the gap given by the relaxation) and ε in Figure 2b. The first observation is that the three models obtain similar energy savings: almost always equal for CG-simple and CG-cut, and a little bit better (up to 5%) for CG-cut+. However, ε dramatically varies. Cuts significantly improves ε: for CG-simple, it varies between 169% for the D1 period and 64% for the D5 period, when, for CG-cut, ε is between 8 to 30%. The ratio is further improved with CG-cut+: between 2 and 7%. As the energy savings are similar for the three models, it shows that the three CG models provide rather accurate solutions, as confirmed by the solutions and accuracies of the CG-cut and CG-cut+ models.
We now focus on the CG-cut model, as it offers the best compromise in terms of accuracy (wrt CG-simple model) and memory requirements (wrt CG-cut+ model) to solve large networks. Note that it does not allow to get a solution for D3 and D4 periods with pdh network.
We provide in Figure 3 the ε values for the three topologies. On pdh, ε increases from 7% at period D1 to almost 30% at period D5. For atlanta, ε
decreases from 6% at D1 to 3% at D3, before increasing back to 6% at D5. For germany50, ε steadily increases from 20 to 26%.
4.3 Energy Savings
Energy Savings. We compare the savings of our solutions with a legacy scenario (baseline), i.e., a network with no SDN or NFV implementation. Therein, routing is static, network functions are not virtualized but hard-ware implemented, with hardhard-ware installed in specific positions. Demands use shortest paths between sources, hardware locations, and destinations.
We provide in Figure4 the energy savings during the day forpdh. Due to
lack of space,the results for the other networks can be found in [7]. We see that we obtained important savings using virtualization: between 25 and 62 % for pdh, 15 and 30 % for atlanta, and 38 and 42 % for germany50.
Impact on Delay. When some links are put into sleep mode, some of the paths are becoming longer. Due to lack of space, the details can be found in [7]. Therein, we show that the maximum delay of every path stays below the usual 50 ms latency value in Service Level Agreements: experienced delay is about 7, 14 and 25 ms on pdh, atlanta and germany50 respectively.
5
Conclusion
In this work, we investigate the potential of network virtualization to re-duce the energy consumption of networks. We propose a Column Generation model to solve the problem of minimizing network energy consumption while satisfying the SFC requirements. We obtain between 15 to 62 % of energy savings for network topologies of different sizes.
References
[1] Araujo, J., F. Giroire, J. Moulierac, Y. Liu and M. Remigiusz, Energy efficient content distribution, Computer Journal (2016), pp. 1–18.
[2] Chabarek, J., J. Sommers, P. Barford, C. Estan, D. Tsiang and S. Wright, Power awareness in network design and routing, in: IEEE International Conference on Computer Communications (INFOCOM), 2008, pp. 1130–1138.
[3] Chiaraviglio, L., M. Mellia and F. Neri, Minimizing ISP network energy cost: Formulation and solutions, IEEE/ACM Transactions on Networking 20 (2011), pp. 463–476.
[4] Dwaraki, A. and T. Wolf, Adaptive service-chain routing for virtual network functions in software-defined networks, in: Work. on Hot topics in Middleboxes and Network Function Virtualization (HotMIddlebox), 2016, pp. 32–37.
[5] Gupta, A., M. F. Habib, P. Chowdhury, M. Tornatore and B. Mukherjee, Joint virtual network function placement and routing of traffic in operator networks, UC Davis, Davis, CA, USA, Tech. Rep (2015).
[6] Huin, N., B. Jaumard and F. Giroire, Optimization of network service chain provisioning, in: IEEE International Conference on Communications (ICC), Paris, France, 2017.
[7] Huin, N., A. Tomassilli, F. Giroire and B. Jaumard, Energy-efficient service function chain provisioning (2016), Inria Research Report RR-8980.
[8] Index, C. V. N., Cisco visual networking index: Forecast and methodology 2015-2020, White paper, CISCO) (2015).
[9] Martini, B., F. Paganelli, P. Cappanera, S. Turchi and P. Castoldi, Latency-aware composition of virtual functions in 5g, in: 1st IEEE Conference on Network Softwarization (NetSoft), 2015, pp. 1–6.
[10] Matsubara, D., T. Egawa, N. Nishinaga, V. P. Kafle, M.-K. Shin and A. Galis, Toward future networks: a viewpoint from itu-t, IEEE Communications Magazine 51 (2013), pp. 112–118.
[11] Mohammadkhan, A., S. Ghapani, G. Liu, W. Zhang, K. Ramakrishnan and T. Wood, Virtual function placement and traffic steering in flexible and dynamic software defined networks, in: The 21st IEEE Int. Workshop on Local and Metropolitan Area Networks, 2015, pp. 1–6.
[12] Niccolini, L., G. Iannaccone, S. Ratnasamy, J. Chandrashekar and L. Rizzo, Building a power-proportional software router, in: Presented as part of the 2012 USENIX Annual Technical Conference (USENIX ATC 12), 2012, pp. 89–100. [13] Riggio, R., A. Bradai, T. Rasheed, J. Schulz-Zander, S. Kuklinski and
T. Ahmed, Virtual network functions orchestration in wireless networks, in: Int. Conf. on Network and Service Management (CNSM), 2015, pp. 108–116. [14] Savi, M., M. Tornatore and G. Verticale, Impact of processing costs on service
chain placement in network functions virtualization, in: IEEE Conference on Network Function Virtualization and Software Defined Network (NFV-SDN), 2015, pp. 191–197.