HAL Id: tel-02431446
https://hal.archives-ouvertes.fr/tel-02431446v2
Submitted on 2 Jun 2020HAL is a multi-disciplinary open access archive for the deposit and dissemination of sci-entific research documents, whether they are pub-lished or not. The documents may come from teaching and research institutions in France or abroad, or from public or private research centers.
L’archive ouverte pluridisciplinaire HAL, est destinée au dépôt et à la diffusion de documents scientifiques de niveau recherche, publiés ou non, émanant des établissements d’enseignement et de recherche français ou étrangers, des laboratoires publics ou privés.
streaming by controlled experimentation and machine
learning
Muhammad Jawad Khokhar
To cite this version:
Muhammad Jawad Khokhar. Modeling quality of experience of internet video streaming by controlled experimentation and machine learning. Networking and Internet Architecture [cs.NI]. COMUE Uni-versité Côte d’Azur (2015 - 2019), 2019. English. �NNT : 2019AZUR4067�. �tel-02431446v2�
Modélisation de la qualité d'expérience de
la vidéo streaming dans l'internet par
expérimentation contrôlée et apprentissage
machine
Muhammad Jawad KHOKHAR
Inria Sophia Antipolis
Présentée en vue de l’obtention
du grade de docteur en INFORMATIQUE d’Université Côte d’Azur
Dirigée par : Chadi BARAKAT Soutenue le : Octobre 15, 2019
Devant le jury, composé de :
Kavé SALAMATIAN, Professeur, University de Savoie Jean-Louis ROUGIER, Professeur, TELECOM ParisTech Isabelle CHRISMENT, Professeur, Université de Lorraine Guillaume URVOY-KELLER, Professeur, UCA
Giovanni NEGLIA, Chercheur (HDR), Inria
Chadi BARAKAT, Directeur de Recherche (DR), Inria
de la vid´
eo streaming dans l’internet par
exp´
erimentation contrˆ
ol´
ee et
apprentissage machine
Modeling Quality of Experience of Internet Video Streaming
by Controlled Experimentation and Machine Learning
Jury:
Rapporteurs
Kav´e Salamatian, Professeur, Universit´e de Savoie Jean-Louis Rougier, Professeur, TELECOM ParisTech Examinateurs
Isabelle Chrisment, Professeur, Universit´e de Lorraine
Guillaume Urvoy-Keller, Professeur, Universit´e Cˆote d’Azur Giovanni Neglia, Chercheur (HDR), Inria Sophia Antipolis Directeur
Video streaming is the dominant contributor of today’s Internet traffic. Consequently, estimating Quality of Experience (QoE) for video streaming is of paramount importance for network operators. The QoE of video streaming is directly dependent on the network conditions (e.g., bandwidth, delay, packet loss rate) referred to as the network Quality of Service (QoS). This inherent relationship between the QoS and the QoE motivates the use of supervised Machine Learning (ML) to build models that map the network QoS to the video QoE. In most ML works on QoE modeling, the training data is usually gathered in the wild by crowdsourcing or generated inside the service provider networks. However, such data is not easily accessible to the general research community. Conse-quently, the training data if not available beforehand, needs to be built up by controlled experimentation. Here, the target application is run under emulated network environ-ments to build models that predict video QoE from network QoS. The network QoS can be actively measured outside the data plane of the application (outband ), or measured passively from the video traffic (inband ). These two distinct types of QoS correspond to the use cases of QoE forecasting (from end user devices) and QoE monitoring (from within the networks). In this thesis, we consider the challenges associated with network QoS-QoE modeling, which are 1) the large training cost of QoE modeling by controlled experimentation, and 2) the accurate prediction of QoE considering the large diversity of video contents and the encryption deployed by today’s content providers.
Firstly, QoE modeling by controlled experimentation is challenging due to the high training cost involved as each experiment usually consumes some non-negligible time to complete and the experimental space to cover is large (power the number of QoS features). The conventional approach is to experiment with QoS samples uniformly sampled in the entire experimental space. However, uniform sampling can result in significant similarity in the output labels, which increases the training cost while not providing much gain in the model accuracy. To tackle this problem, we advocate the use of active learning to reduce the number of experiments while not impacting accuracy. We consider the case of YouTube QoE modeling and show that active sampling provides a significant gain over uniform sampling in terms of achieving higher modeling accuracy with fewer experiments. We further evaluate our approach with synthetic datasets and show that the gain is dependent on the complexity of the experimental space. Overall, we present a sampling approach that is general and can be used in any QoS-QoE modeling scenario provided that the input QoS features are fully controllable.
Secondly, accurate prediction of QoE of video streaming can be challenging as videos offered by today’s content providers vary significantly from fast motion sports videos to static lectures. On top of that, today’s video traffic is encrypted, which means that
network operators have little visibility into the video traffic making QoE monitoring difficult. Considering these challenges, we devise models that aim at accurate forecast-ing and monitorforecast-ing of video QoE. For the scenario of QoE forecastforecast-ing, we build a QoE indicator called YouScore that quantifies the percentage of videos in the catalog of a content provider that may play out smoothly (without interruptions) for a given out-band network QoS. For the QoE monitoring scenario, we estimate the QoE using the inband QoS features obtained from the encrypted video traffic. Overall, for both sce-narios (forecasting and monitoring), we highlight the importance of using features that characterize the video content to improve the accuracy of QoE modeling.
Keywords: Quality of Service, Quality of Experience, Machine Learning, Active Learning, Controlled Experimentation, Internet Video, YouTube
Le streaming vid´eo est l’´el´ement dominant au trafic Internet actuel. En cons´equence, l’estimation de la qualit´e d’exp´erience (QoE) pour le streaming vid´eo est de plus en plus importante pour les op´erateurs r´eseau. La qualit´e d’exp´erience (QoE) de la diffusion vid´eo sur Internet est directement li´ee aux conditions du r´eseau (par exemple, bande passante, d´elai) ´egalement appel´ee qualit´e de service (QoS). Cette relation entre QoS et QoE motive l’utilisation de l’apprentissage automatique supervis´e pour ´etablir des mod`eles reliant QoS `a QoE. La QoS du r´eseau peut ˆetre mesur´ee activement en dehors du plan de donn´ees de l’application (outband) ou de mani`ere passive `a partir du trafic vid´eo (inband). Ces deux types de qualit´e de service correspondent `a deux sc´enarios d’utilisation diff´erents: la pr´evision et la surveillance. Dans cette th`ese, nous examinons les d´efis associ´es `a la mod´elisation de la QoE `a partir de la QoS r´eseau, `a savoir 1) le coˆut ´elev´e de la phase exp´erimentale, et 2) la consid´eration de la grande diversit´e du contenu vid´eo et du chiffrement d´eploy´e.
Premi`erement, la mod´elisation de la QoE par exp´erimentation contrˆol´ee constitue un d´efi, les dimensions d’espace d’exp´erimentations ainsi que le temps non n´egligeable de chaque exp´erience rend cette mod´elisation plus complexe. L’approche classique consiste `
a exp´erimenter avec des ´echantillons (de qualit´e de service), ´echantillonn´es de mani`ere uniforme dans tout l’espace exp´erimental. Cependant, un ´echantillonnage uniforme peut entraˆıner une similarit´e significative au niveau des labels, ce qui entraine une augmen-tation du coˆut sans gain en pr´ecision du mod`ele. Pour r´esoudre ce probl`eme, nous recommandons d’utiliser apprentissage actif pour r´eduire le nombre d’exp´eriences sans affecter la pr´ecision. Nous examinons le cas de la mod´elisation QoE sur YouTube et montrons que l’´echantillonnage actif fournit un gain significatif par rapport `a l’´echantillonnage uniforme en termes d’augmentation de la pr´ecision de la mod´elisation en moins d’exp´eriences. Nous ´evaluons ensuite notre approche avec des ensembles de donn´ees synth´etiques et montrons que le gain d´epend de la complexit´e de l’espace exp´erimental. Dans l’ensemble, nous pr´esentons une approche g´en´erale d’´echantillonnage qui peut ˆetre utilis´ee dans n’importe quel sc´enario de mod´elisation QoS-QoE, `a condition que la fonctionnalit´e de QoS en entr´ee soit enti`erement contrˆolable.
Deuxi`emement, pr´evoir la qualit´e de l’exp´erience de la vid´eo avec pr´ecision s’av`ere dif-ficile, d’une part les vid´eos des fournisseurs de contenu actuels varient ´enorm´ement, des vid´eos sportives rapides aux vid´eos ´educatives statiques. De plus, le trafic vid´eo actuel est crypt´e, ce qui signifie que les op´erateurs de r´eseau ont une visibilit´e r´eduite sur le trafic vid´eo, ce qui rend la surveillance de la QoE plus complexe. Face `a ces d´efis, nous d´eveloppons des mod`eles afin de pr´evoir ainsi que surveiller avec pr´ecision la qualit´e de l’exp´erience vid´eo. Pour le sc´enario de pr´evision QoE, nous construisons
un indicateur QoE appel´e YouScore qui pr´edit le pourcentage de vid´eos pouvant ˆetre lues sans interruption en fonction de l’´etat du r´eseau sous-jacent. En ce qui concerne la surveillance QoE, nous estimons la QoE `a l’aide des fonctionnalit´es de qualit´e de service inband obtenues `a partir du trafic vid´eo crypt´e. En conclusion, pour les deux sc´enarios (pr´evision et surveillance), nous soulignons l’importance d’utiliser des fonctionnalit´es qui caract´erisent le contenu vid´eo afin de pouvoir am´eliorer la pr´ecision des mod`eles. Mots-cl´es: Qualit´e de Service, Qualit´e d’Exp´erience, Apprentissage Machine, Apprentissage Actif, Exp´erimentation Contrˆol´ee, Streaming Vid´eo, YouTube
Finally, after a journey of three years, I am writing this acknowledgment to recognize all those people who supported me during my Ph.D. I would like to first thank my supervisor Prof. Chadi Barakat for his continuous help, guidance, and moral support, without which, I wouldn’t have been able to complete this thesis. Chadi was always there to motivate me in my periods of depression and most certainly helped me in brainstorming new ideas and formulating my research. In short, I found Chadi a thorough gentleman, both personally and professionally. I thank the reviewers for taking the time to review my thesis and thank the examiners for being part of the jury of my defense. I thank the DIANA team members for the memorable time that I spent at Inria Sophia Antipolis. In particular, I would like to thank my fellow Ph.D. students with whom I spent most of the time drinking coffee; I will most certainly miss those long coffee breaks.
I would also like to thank my family for the support they gave me throughout my Ph.D. I am going to mention each of them. First of all, I have to say that whatever I am today is because of my mother. It is her who inculcated in me the passion to achieve academic excellence and her prayers are the real source of my success. Doing a Ph.D. was a personal goal that I had set for myself at a very young age. But it was my late father who deeply wished that I do a Ph.D. Fulfilling his desire has been extremely satisfying for me and my family; had he been alive, he would have been the happiest person to see both his sons (my elder brother is also a Ph.D.) holding Ph.D. degrees. My brother also has been a great source of inspiration for me. It was him who kept me motivated to pursue a Ph.D. during my career as a Telecom engineer. I also thank my elder sisters for their consistent prayers for my success. Lastly, I thank my wife for being the most caring life partner and for her unwavering support and comfort during my stressful days and for taking care of our daughter.
Abstract i
Acknowledgements v
List of Figures xi
List of Tables xiii
Abbreviations xv
1 Introduction 1
1.1 Challenges tackled in this thesis . . . 4
1.1.1 The large experimental space to cover in controlled experimentation 4 1.1.2 Accurate prediction of video streaming QoE . . . 5
1.1.2.1 The large diversity of contents of today’s video content providers . . . 5
1.1.2.2 The encryption of today’s video traffic . . . 6
1.2 Thesis Outline . . . 7
2 State of the Art on QoE Modeling for Internet Video Streaming 9 2.1 Video streaming delivery techniques . . . 9
2.1.1 Progressive download using HTTP . . . 10
2.1.2 HTTP based Adaptive video Streaming (HAS) . . . 10
2.1.2.1 Adaptive BitRate (ABR) selection algorithms . . . 11
2.2 Quality of Experience metrics of video streaming . . . 11
2.2.1 Startup delay . . . 13
2.2.2 Stalling events . . . 13
2.2.3 Video quality . . . 14
2.2.3.1 Visual Quality Assessment (VQA) . . . 14
2.2.4 Quality switches/adaptation . . . 15
2.2.5 MOS prediction models . . . 15
2.2.5.1 The ITU-T P.1203 model . . . 16
2.3 Methodologies for modeling video QoE . . . 17
2.3.1 QoE modeling using data collected in the wild . . . 18
2.3.2 QoE modeling by controlled experimentation . . . 19
2.3.3 QoE prediction from network QoS . . . 20
2.3.3.1 From end user devices . . . 20
2.3.3.2 From within the network . . . 20
3 An Intelligent Sampling Framework for QoE modeling 23 3.1 Introduction . . . 23
3.2 Active learning for QoE modeling . . . 26
3.2.1 The informativeness measure . . . 28
3.3 Pool based sampling for QoE modeling . . . 29
3.3.1 Methodology . . . 29
3.3.2 Implementation . . . 30
3.3.3 Definition of accuracy . . . 31
3.3.4 Building the pool and the validation set . . . 31
3.3.5 Mapping function . . . 32
3.3.6 Performance analysis . . . 34
3.3.7 The effect of pool size on model accuracy . . . 37
3.4 Relaxing the pool assumption . . . 38
3.4.1 Stopping criterion . . . 40
3.4.2 Gauging model quality using model confidence . . . 41
3.4.3 Evaluation . . . 41
3.4.4 Accuracy and confidence . . . 43
3.4.5 Model convergence . . . 45
3.4.6 Quantifying the gain of active sampling . . . 46
3.4.6.1 Comparing the computational overhead of active sampling 48 3.5 Active sampling in real networks . . . 49
3.5.1 Application of pool-based sampling on an open network measure-ment dataset . . . 49
3.6 Related work and discussion . . . 50
3.7 Summary . . . 52
4 YouScore: A QoE indicator for Network Performance Benchmarking 53 4.1 Introduction . . . 54
4.2 The video catalog . . . 55
4.2.1 Methodology . . . 55
4.2.2 Video categories and popularity . . . 56
4.2.3 Video bitrates . . . 57
4.3 The interplay between content, network QoS and QoE . . . 58
4.3.1 Building the QoS-QoE training set for ML . . . 59
4.3.1.1 Choice of network QoS features . . . 59
4.3.1.2 QoE definition . . . 59
4.3.2 The experimentation framework . . . 60
4.3.3 Learner convergence and accuracy . . . 61
4.3.4 The QoS-QoE dataset . . . 62
4.3.5 Model validation . . . 63
4.3.6 Gain of using the video bitrate feature . . . 64
4.5 Application of the YouScore for performance benchmarking . . . 67
4.6 Related work . . . 70
4.7 Limitations . . . 71
4.8 Summary . . . 71
5 Monitoring QoE from Encrypted Video Streaming Traffic 73 5.1 Introduction . . . 73
5.2 Related work . . . 75
5.3 The experimental setup . . . 75
5.3.1 Trace based sampling . . . 76
5.3.2 Video catalog . . . 77
5.3.3 The overall experimental framework . . . 77
5.4 The training dataset . . . 78
5.4.1 Network features . . . 78
5.4.2 The subjective MOS . . . 80
5.4.3 Statistical analysis of the collected dataset . . . 81
5.4.3.1 Network features . . . 82
5.4.3.2 Startup delay . . . 83
5.4.3.3 Stalls . . . 83
5.4.3.4 Quality switches . . . 84
5.4.3.5 The average resolution score . . . 84
5.4.3.6 The ITU P.1203 MOS . . . 84
5.4.4 Correlation analysis between network QoS and QoE . . . 85
5.5 Evaluation of the ML Models . . . 85
5.5.1 Estimating startup delay . . . 86
5.5.2 Predicting quality switches and stalls . . . 87
5.5.3 Estimating average resolution of playout . . . 89
5.5.4 Estimating the ITU MOS . . . 89
5.6 Limitations . . . 90
5.7 Summary . . . 91
6 Conclusion 93 6.1 Summary . . . 93
6.2 Future work . . . 93
6.2.1 Active learning for QoE modeling of any Internet application . . . 93
6.2.2 Application of the QoE models in practice . . . 94
1.1 The controlled experimentation setup . . . 3
1.2 The network QoS . . . 3
2.1 QoE metrics for modern Internet video streaming . . . 13
2.2 Building blocks of ITU-T P.1203 model. The figure is taken from [1]. . . . 16
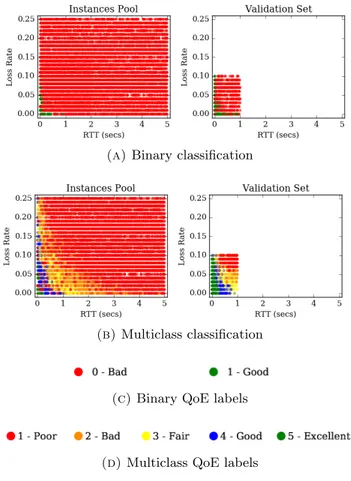
2.3 Modes of operation of ITU-T P.1203 model. The figure is taken from [1]. 16 3.1 Visual representation of the datasets . . . 33
3.2 CDF of the samples in the pool . . . 34
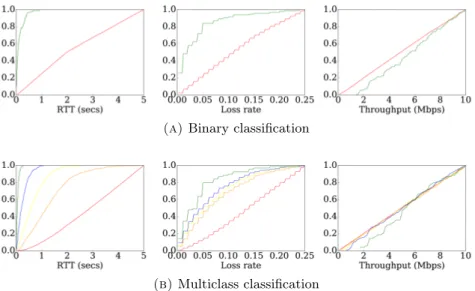
3.3 Binary classification results . . . 35
3.4 Multiclass classification results . . . 36
3.5 Training set samples at 5% of the pool size . . . 37
3.6 Comparison of accuracy with different pool sizes . . . 38
3.7 Active sampling . . . 39
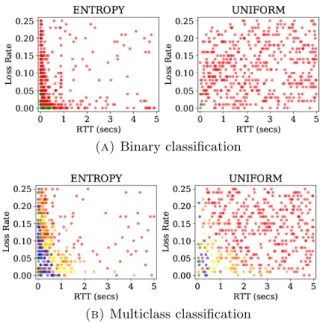
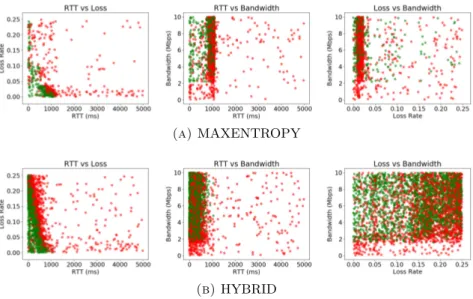
3.8 Visual representation of the collected datasets . . . 43
3.9 Visual depiction of the DT ML model . . . 43
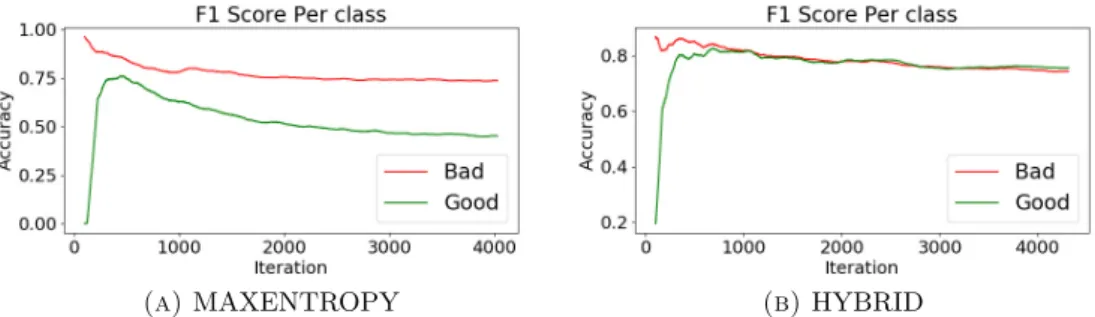
3.10 Comparison of the F1-scores per class b/w HYBRID and MAXENTROPY 44 3.11 The weighted confidence measure . . . 45
3.12 Variation of entropy . . . 45
3.13 Classification probabilites (confidence) of the DT leafs per class . . . 46
3.14 Comparison of accuracy for synthetic dataset (non-linear function) . . . . 46
3.15 The synthetic linear functions . . . 47
3.16 Gain of HYBRID over uniform sampling for different feature spaces . . . 48
3.17 Computation complexity in milliseconds of each sampling iteration. Re-sults obtained on a PC using Intel Core i7-6600U (2.60 GHz) CPU with 15 GB of RAM and using Python 2.7 on Fedora release 24. . . 48
3.18 CDF of the FCC dataset . . . 50
3.19 Application of pool based active sampling over FCC dataset. The measure of accuracy is the average of the F1-scores per class and the scores at each iteration correspond to the average of 20 independent runs. . . 50
4.1 Video count per resolution . . . 56
4.2 Distribution of videos per category . . . 57
4.3 Histogram of the bitrate of the YouTube videos . . . 57
4.4 Boxplot of the bitrates of the YouTube videos . . . 57
4.5 Boxplot of video bitrates (1080p) per category . . . 58
4.6 The sampling and experimentation framework . . . 61
4.7 Model convergence for the DT Model per class . . . 62
4.8 Projection of the QoS-QoE dataset. Red color: Unacceptable playout with stalling or long join time. Green color: Acceptable smooth playout. 63 4.9 Y ouScorer using θ for different resolutions . . . 66
4.10 Y ouScore(category)1080p using θ for different categories . . . 67 4.11 Downlink bandwidth vs RTT for RTR-NetTest dataset . . . 68 4.12 Overall average YouScores for top three network operators for all radio
access technologies . . . 69 5.1 The experimentation framework . . . 77 5.2 Variation of the video chunk sizes w.r.t resolution (VP9 codec, 30 fps).
Total number of samples: 1848360. . . 79 5.3 CDF of the chunk sizes inferred from the encrypted traces compared to the
chunk sizes observed in the clear text HTTP traces (obtained in Google Chrome browser) for the same video sessions . . . 79 5.4 Variation of the ITU MOS w.r.t configured bandwidth and RTT. #
sam-ples: 104504. Unique video count: 94167. . . 81 5.5 The CDF for Foutband enforced on tc . . . 82
5.6 The CDF of the statistical chunk size features (Fchunks) . . . 82
5.7 The CDF of the startup delay, the stallings and the quality switches . . . 83 5.8 The CDF of the average resolution score, r and MOS . . . 84 5.9 Correlogram for network QoS, app QoS and MOS . . . 85 6.1 Average ITU MOS vs downlink bandwidth (outband QoS) for different
display resolutions in the dataset presented in Chapter 5. The error bars represent one standard deviation. . . 95
1.1 Summary of the datasets collected in this thesis. . . 7
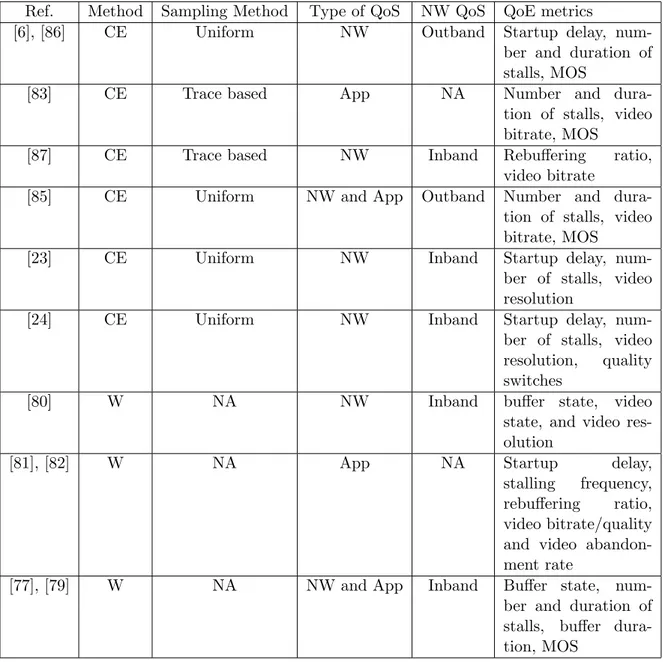
2.1 Summary of methodologies used in literature for QoE modeling of video streaming. CE: Controlled Experimentation. W: Data collected in the Wild. NW: Network. App: Application level. NA: Not Applicable. . . 21
3.1 Model confidence per class after 3000 iterations . . . 45
3.2 Covered area for each class according to a tunable linear function . . . 47
4.1 Mean video bitrate (Mbps) per resolution . . . 58
4.2 Cross-validation scores for common ML algorithms with standardization (k = 10 with a test set size equal to 20% of training set). Class 0: Unacceptable. Class 1: Acceptable. . . 64
4.3 Performance gain with the video bitrate feature . . . 64
4.4 Information provided by RTR-NetTest . . . 67
4.5 Average YouScores w.r.t network technology for the entire dataset . . . . 69
4.6 Split of Y ouScores w.r.t Radio Access Technology (RAT) for top three operators . . . 70
4.7 A Performance comparison between QoE models that take network QoS features as input . . . 70
5.1 ML classification accuracy of predicting video start up. Class 0: not started (startup delay > 30 seconds). Class 1: video started to play. . . . 87
5.2 RMSE (in seconds) for the predicted startup delay . . . 87
5.3 ML classification accuracy of detecting quality (resolution) switches. Class 0: video plays at constant quality. Class 1: there are quality switches. 88 5.4 ML classification accuracy of detecting stalls. Class 0: video plays smoothly. Class 1: video has stalls. . . 88
5.5 ML classification accuracy of detecting resolution . . . 89
5.6 RMSE of the predicted MOS . . . 89
5.7 ML classification accuracy with quantized MOS. Bins: 1) 1.0 – 2.0, 2) 2.0 – 3.0, 3) 3.0 – 4.0, 4) 4.0 – 5.0). . . 90
5.8 MOS confusion matrix using Finband+chunks . . . 90
QoS Quality of Service QoE Quality of Experience ML Machine Learning MOS Mean Opinion Score
DT Decision Tree
RF Random Forest
RMSE Root Mean Squared Error HAS HTTP Adaptive Streaming ABR Adaptive BitRate
DASH Dynamic Adaptive Streaming over HTTP
Introduction
Video streaming is the most dominant contributor to global Internet traffic. By 2021 the global share of IP video traffic is expected to reach 82%, up from 73% in 2016 [2]. Similarly, by 2023, mobile video traffic is expected to increase from 56% in 2017 to 73% in 2023 [3]. The huge demand for Internet video pushes network operators to proactively estimate Quality of Experience (QoE) of video streaming users in their networks. The QoE of Internet video, as per prior subjective studies, is dependent on application Quality of Service (QoS) features such as initial loading time (startup delay or join time), frequency of re-buffering/stalling events, playout quality (spatial resolution) and its variations [4], [5], [6]. Network operators usually do not have such information about the video traffic generated in their networks as most of the traffic is getting encrypted. So the only possible solution for gauging the QoE of video streaming is to rely on network-level features obtained from the encrypted video traffic traces, or independent network measurement tools executed outside the video application data plane.
Prior works on video QoE estimation have shown that network-level performances (e.g., bandwidth, delay, packet loss rate) directly impact QoE [5]. This motivates the use of supervised machine learning (ML) to link the network level measurements (referred here as the network QoS) to QoE. Supervised ML based QoS-QoE modeling requires some ground truth dataset that maps the input QoS to the output QoE. Typically, such datasets are built either by controlled experimentation or by crowdsourcing. In controlled experimentation, the target application is run (on an end user device) in a controlled environment where the input QoS features are fully controlled, resulting in a QoS-QoE dataset that maps the enforced QoS to the observed QoE [7], [8], [9], [10]. On the other hand, in crowdsourcing the ground truth data is collected in the wild without any control over the QoS metrics, and typically by a large number of users
who are asked to rate the QoE of a given application over the Internet [11], [12], [13], [14]. Crowdsourcing suffers from a lack of control over the test conditions [15] and not everyone can have access to such data from a large set of real users, which pushes most researchers to rely on building their own datasets by controlled experimentation. In controlled experimentation, the videos are played out in emulated network conditions, as shown in Figure 1.1, to build the dataset for training the ML algorithms to build the QoE prediction models. These models estimate video QoE by relying only on the network QoS features. Most works on network QoS-QoE modeling use QoS features that are collected from video traffic traces for QoE monitoring. However, in a recent work based on QoS-QoE modeling for Skype [16], the notion of QoE forecasting from end-user devices is presented. This consists of using network QoS measured outside the data plane of the application and without relying on the application traffic (Skype in this particular case). The benefit of this approach is that it allows the same measurements to be used to predict QoE for many different applications. In this thesis, we consider video streaming where we build prediction models (by controlled experimentation) that allow both the forecasting and the monitoring of video QoE using network QoS only. We discuss in greater detail each of the prediction scenarios and the associated network QoS measurement types next.
1. QoE forecasting. In QoE forecasting, the network QoS is based on measurements made by the clients towards the target measurement servers placed at different vantage points in the network. These measurements are out-of-band w.r.t to the video traffic, which means that no video traffic is required to measure them. The benefit of the QoE forecasting approach is that the QoE of any Internet application can be forecasted in advance, without the need to run the application itself. This method of QoE forecasting is used by mobile applications such as ACQUA [17] and Meteor [18] where QoS-QoE models (built offline) forecast the QoE of apps such as YouTube and Skype using the QoS measurements of bandwidth, delay, jitter, etc.
2. QoE monitoring. The QoE monitoring approach is used to monitor the QoE from within the core of the networks. This approach uses models that require network QoS to be measured directly from video traffic. These measurements are inband w.r.t to the video traffic and are obtained passively without disrupting the video traffic. Examples of such measurements can include the instantaneous throughput, the packet interarrival times and the packet sizes [5]. The QoE moni-toring approach is deployed on network middleboxes that parse the network traffic to estimate the QoE of the videos played out [5], [19].
Traffic Emulator
1. Enforce Network QoS
2. Play video and observe QoE
Figure 1.1: The controlled experimentation setup
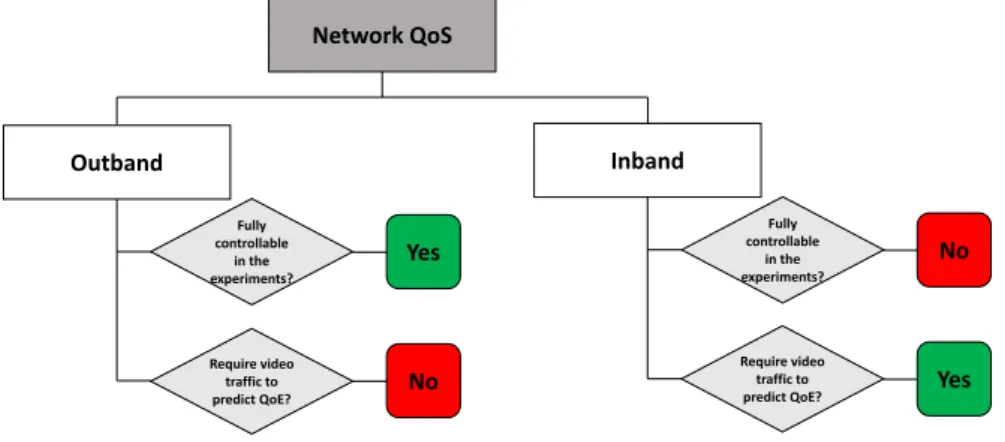
Network QoS Outband Inband Fully controllable in the experiments? Yes Require video traffic to predict QoE? No No Require video traffic to
predict QoE? Yes Fully
controllable in the experiments?
Figure 1.2: The network QoS
As already mentioned, the outband features include measurements such as bandwidth and packet loss rate. These measurements can be emulated in the lab by network em-ulators such as Linux traffic control (tc), and so are fully controllable. On the other hand, inband measurements such as packet sizes and their variation are hard to con-trol as they depend on how the video application adapts to the network conditions. The controllability of the features is an important property that defines the sampling method we employ to vary the QoS in our experiments, we discuss these in the next section. Overall, a summary of the characteristics of the two types of network QoS measurements is shown in Figure 1.2, where we can see that outband features are fully controllable, whereas inband features are not fully controllable, and are based on passive measurements obtained from the video traffic.
Considering these scenarios, we tackle two challenges in this thesis that are related to 1) the large training cost associated with QoE modeling by controlled experimentation, and 2) the accurate prediction of video streaming QoE. These form the basis of the work presented in this thesis. In the next section, we individually discuss the challenges and the solutions proposed in the thesis.
1.1
Challenges tackled in this thesis
1.1.1 The large experimental space to cover in controlled experimen-tation
Typically in QoS-QoE modeling using ML, the training datasets are either collected in the wild or built by controlled environments. The conventional approach of building such datasets by controlled experimentation is to experiment over a large set of unlabeled network QoS configurations uniformly sampled over the entire experimental space, i.e., the range within which the individual network QoS features are varied. The challenge here is in the large space to cover (power of the number of QoS features) and the non-negligible time required by each experiment to complete. For example, to obtain a dataset of 10N samples, N being a positive integer number, in a scenario of N QoS features, with roughly 10 unique values per QoS feature if samples are placed on a grid, and if each experiment requires X minutes to complete, then the total time consumed in building such a dataset would be equal to X.10N minutes. If N equals 4 features and X equals two minutes, this is roughly 14 days! This experimentation cost is exacerbated by the fact that some QoS features span different orders of magnitude (as the bandwidth), and also by the fact that Internet applications are diverse and rapidly evolving, thus requiring the QoE models to be re-built regularly.
To reduce this training cost, we observe that the space in which the experiments are carried out can show a high degree of similarity in the output labels of QoE. Exper-imenting with this similarity provides little improvement in modeling accuracy in the case of uniform sampling of the experimental space. We aim to exploit this similarity to reduce the training cost while building the QoE models. In light of this observation, we advocate the use of active learning to reduce this training cost without compromis-ing accuracy. Active learncompromis-ing is a semi-supervised ML approach where the learner is intelligent enough to select which samples it wants to label and learn from as part of an iterative process. In active learning literature, pool based uncertainty sampling is the most widely used active learning strategy, where the ML model has a pool of unlabeled data and the objective is to intelligently label samples from this pool to build an accurate model quickly with fewer labeled samples.
In this thesis, we first apply the pool based uncertainty sampling in our scenario of QoS-QoE modeling for YouTube video streaming by controlled experimentation and show that pool based sampling provides a significant gain over uniform sampling. We then illustrate a potential issue with uncertainty sampling with very large pools and propose an active sampling approach that does not require any pool. Finally, we illustrate with synthetic datasets that the gain of active sampling depends on the complexity of the
feature space for any given experimentation scenario. To the best of our knowledge, this is a first attempt at applying active learning in the context of network QoS-QoE modeling by controlled experimentation.
1.1.2 Accurate prediction of video streaming QoE
1.1.2.1 The large diversity of contents of today’s video content providers
Today’s video content providers typically store a large number of videos that vary in content type ranging from fast motion sports videos to static educational lectures. Due to the difference in contents, the QoE can vary significantly from one video to the other for the same network QoS. Considering this variation in content, we propose to build global QoE indicators for video streaming that can accurately highlight the variation in the QoE of videos due to the difference in contents. Such indicators can allow network operators to measure the extent to which the QoE of video streaming users can degrade in poor network conditions considering the diversity of the contents offered by today’s content providers.
Internet video is typically stored in a variety of video encoding formats including FLV, MP4, and VP9. Most commonly, the Variable BitRate (VBR) encoding techniques are used by modern video content providers where complex scenes of the video are allocated higher bitrates while less complex scenes are allocated lower bitrates. Owing to this, different videos can have different video bitrates. Fast-moving videos tend to have a higher video bitrate compared to slow-moving videos. The video bitrate, in turn, affects the network QoS required for smooth video playout.
Based on the inherent relationship between average bitrate, QoS and QoE, we build a global QoE indicator, which we call YouScore, that can predict the percentage of videos in the catalog of the content provider (e.g., YouTube) that may play out smoothly (without stalls) for a given network QoS. To devise YouScore, we first build a large catalog of 1 million YouTube videos consisting of metadata including the average video bitrate of each video. We then build a training QoS-QoE dataset by playing out a diverse set of YouTube videos (sampled from the catalog) under a wide range of network conditions where the sampling of the videos and the selection of the relevant conditions for network emulation is done using active sampling. The collected dataset is then used to train supervised ML algorithms to build a QoS-QoE model that takes as input the outband network QoS (downlink bandwidth and RTT) and the average video bitrate to predict whether the video plays out smoothly or not –by using the video bitrate, we show a 13% improvement in model accuracy highlighting the importance of using features that
characterize video content. Finally, we use this model to devise YouScore, which takes as input the outband network QoS only and predicts the percentage of videos (in the catalog) that may play out smoothly.
The benefit of YouScore is that it can be used by network operators to benchmark their performance w.r.t video streaming considering the large diversity of contents offered by today’s content providers. We show this benefit by applying YouScore on a real dataset of network measurements to compare the performance of different mobile networks for video streaming.
1.1.2.2 The encryption of today’s video traffic
Today’s Internet video traffic is mostly served using end to end encryption. This means that network operators have no visibility into the video content traversing their networks and traditional methods of parsing HTTP packets to monitor QoE [20] are no longer applicable. So the only option left for network operators to monitor end user QoE is to rely on the inband network QoS measurements generated inside the core of their networks. Considering this scenario, we build ML models that use inband features obtained from the network traffic to estimate the video QoE. The characteristics of inband features are highly dependent on the internal dynamics of the video application generating the traffic and are not fully controllable. Therefore, we propose to use a trace based sampling approach where we vary the network QoS as it is observed in the wild. Here, we sample the space based on the measurement distributions of applications such as RTR-Netz [21] and MobiPerf [22]. Overall, we build QoE prediction models to estimate the objective QoE metrics of the startup delay, the quality switches and the resolution of playout, and the subjective MOS from the encrypted video traffic traces1. For the MOS, we rely on the standardized ITU-T P.1203 model that provides a MOS ranging from 1–5 taking into account the QoE metrics such as the resolution and bitrate of chunks, and, the temporal location and duration of the stalling events. To the best of our knowledge, this is the first attempt at linking network QoS to the ITU P.1203 model. Prior works [5, 23, 24] do not consider the subjective MOS, they consider objective QoE metrics only (e.g., average video quality). Finally, we compare the performance between the outband and the inband network QoS features and highlight that the inband features enriched with video chunk sizes (inferred directly from the encrypted traces) improve the accuracy of the models for all the QoE metrics. The models presented are based on a highly diverse dataset of around 100k unique video playouts from different geographical locations of France (Sophia Antipolis, Grenoble, Rennes, Nancy, Nantes).
1
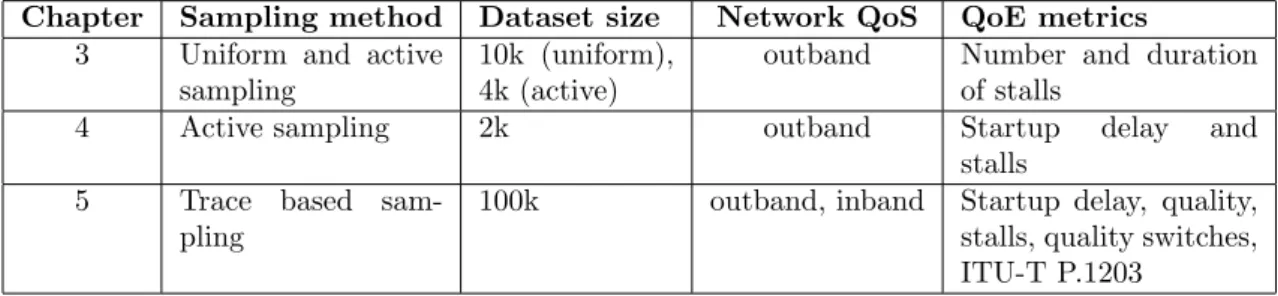
Chapter Sampling method Dataset size Network QoS QoE metrics
3 Uniform and active
sampling
10k (uniform), 4k (active)
outband Number and duration
of stalls
4 Active sampling 2k outband Startup delay and
stalls
5 Trace based
sam-pling
100k outband, inband Startup delay, quality,
stalls, quality switches, ITU-T P.1203
Table 1.1: Summary of the datasets collected in this thesis.
1.2
Thesis Outline
The thesis is organized as follows:
In Chapter 2, we review the methods used in literature for measuring and modeling video streaming QoE.
In Chapter 3, we present our intelligent sampling framework for QoE modeling where we validate our framework for the case of YouTube QoE modeling. The work presented in this chapter has been published in [25], [26] and [27].
In Chapter 4, we apply our active sampling methodology for modeling QoE for a large number of videos and develop the YouScore for performance benchmarking of network operators w.r.t Internet video. The work of this chapter is published in [28].
In Chapter 5, we devise and evaluate the performance of the ML models for QoE moni-toring of video streaming from encrypted network traffic. This work has been published in [29].
Finally, in Chapter 6, we conclude the thesis with a discussion on the possible future research work. The datasets collected as part of this work are summarized in Table 1.1 where we highlight the sampling method (used to vary the network QoS), the number of samples, the type of the input network QoS features and the output QoE metrics used for each dataset. We make these datasets publicly available at [30] and [31].
State of the Art on QoE Modeling
for Internet Video Streaming
In this chapter, we describe the methods used in the literature for measuring and model-ing Internet video QoE. We first discuss the technologies used in today’s video streammodel-ing services in Section 2.1 followed by a discussion on the video QoE metrics in Section 2.2. Finally, in Section 2.3, we discuss the techniques used for modeling video QoE in liter-ature.
2.1
Video streaming delivery techniques
Video streaming refers to the process where the video content is viewed by an end user while being delivered by a content provider concurrently. Typically, the videos start playing once the initial part of the video is downloaded and the remaining part continues to be fetched from the servers while the video is being viewed.
Traditionally, video streaming was based on protocols such as RTSP (Real Time Stream-ing Protocol) [32] and RTP (Real Time Protocol) [33] for real time delivery of video content. These protocols relied mostly on UDP to ensure minimal delay in video trans-mission. However, with UDP, the video playback can suffer from visual impairments, i.e., some video frames might get distorted or dropped due to packet losses [34], [35]. Modern video streaming systems of today use the HTTP protocol for delivering the video content. Using HTTP for video streaming is easy to deploy as most firewalls allow HTTP/HTTPS traffic, which means additional network configurations for handling the video traffic are not needed [36]. This ease of deployment propelled the widespread use of HTTP based video streaming [37]. HTTP runs over protocols such as TCP or QUIC,
which means that video content is reliably delivered to the client and there can be no visual distortions (frame drops) in video playout. However, it can suffer from additional delays due to the use of an application buffer at the client. We discuss this issue next.
2.1.1 Progressive download using HTTP
In HTTP based video streaming, the video file is divided into chunks of equal duration and the client downloads the chunks progressively and stores them in the application buffer. When the user requests to watch a video, the client starts to fill the buffer, once a sufficient amount of video is downloaded, the playback of the video is started. The video chunks are downloaded concurrently with the playout of the video, i.e., the buffer is filled with newly downloaded chunks, while it repletes as the downloaded chunks are played out. In this scenario, if the network conditions degrade due to issues such as packet losses or low throughput, larger delays can occur in the downloads, which can cause the buffer to fill up slowly compared to the playback time of the video. This can result in the buffer getting empty (buffer underrun) causing the playback of the video to interrupt. This interruption lasts until the next chunk has been downloaded to continue the playout. These interruptions are also referred to as stalling or rebuffering events.
2.1.2 HTTP based Adaptive video Streaming (HAS)
Prior subjective studies on video QoE have shown that stalling events in the video playout significantly degrade the video QoE [38], [39], [4]. In some cases, stalling is even considered worse than image quality [40], which means that users may prefer lower quality than having stalls in the playout. Considering these observations, the HTTP based Adaptive video Streaming (HAS) [41] was developed to allow adaptation of the quality of playout to prevent the occurrence of any stalls. In adaptive video streaming, the video chunks are stored in several quality representations (usually in different spatial resolutions) where the quality of the next chunk to download can change depending upon the state of the network. This means that in case of poor network conditions, the client can request a lower resolution for the next chunk to download, a lower resolution would require lower throughput, which means less time to download and thus, preventing any interruptions in the playout.
Adaptive video streaming is now widely deployed by most of the video content providers on the Internet [36]. Examples of different implementations include Microsoft HTTP Smooth Streaming (HSS) [42], Adobe HTTP Dynamic Streaming (HDS) [43], Apple HTTP Live Streaming (HLS) [44] and MPEG Dynamic Adaptive Streaming over HTTP (MPEG-DASH) [41]. Among them, MPEG-DASH is the only solution that is open and
standardized [34]; the implementation includes the dash.js player managed by the DASH Industry Forum (DASH-IF) [45].
The method of choosing the best resolution to maximize QoE of a video playout for a given network condition is referred to as the ABR selection process. Devising algo-rithms for optimal ABR selection is an active area of research with a plethora of papers published in the literature [36]. We summarize the main algorithms in the next section.
2.1.2.1 Adaptive BitRate (ABR) selection algorithms
ABR selection algorithms can be rate based, buffer based or a hybrid of both the preced-ing methods. In traditional rate based methods, the ABR algorithm first estimates the network throughput and then selects the chunk whose video bitrate (among the available chunk representations) is the highest but lower than the throughput estimate. Estimat-ing throughput in today’s mobile networks is challengEstimat-ing and can be prone to errors. In order to avoid using any erroneous throughput estimates, buffer based approaches were developed that do not require any estimation of the throughput, rather they rely only on the buffer occupancy to choose the quality of the chunk to download [46], [47]. The third method, which is a hybrid method, considers both the throughput estimation and the buffer occupancy in the chunk selection process [48], [49], [50], and is most widely used technique in production environments [51]. Apart from these approaches, learning based methods have also been introduced that use reinforcement learning to learn ABR algorithms instead of using fixed heuristics [52], [53]. These techniques rely on trace based video streaming simulations and fundamentally learn the throughput dynamics of the trace they are trained on.
2.2
Quality of Experience metrics of video streaming
The end user QoE of video streaming is dependent on multiple factors. These factors can be categorized into the following four categories [20]:
1. System Level factors consider the technical aspect of the video streaming players and the ABR algorithms used. These factors include the network QoS (bandwidth, delay), the end user device types (computing power, screen size, mobile/PC, types of the browser), and the application layer QoS features (video adaptation strate-gies, rebufferings).
2. Context Level factors capture the surroundings and the context in which the user views the video content. These can include factors such as the user’s location, the purpose of viewing the video (for educational purposes or entertainment), etc. 3. User Level considers the psychological factors of the end user such as the user
expectations, the user’s mood, the user’s background, her/his browsing history, etc.
4. Content Level factors are related to the characteristics of the video content and are gauged by metrics such as the encoding rate, the encoding format, the resolution, the playback duration, the quality of the video, the popularity of the video, etc.
Most studies consider the system-level factors in the QoE modeling studies for video streaming as it is very difficult to accurately obtain other factors. In this thesis, we also consider the system-level factor where we focus on the network QoS and the application QoS features.
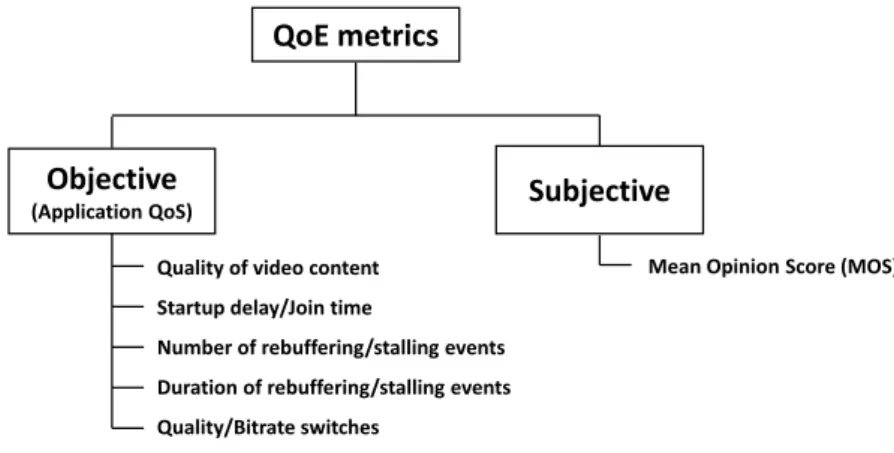
Fundamentally, there are two types of methods for gauging video QoE, 1) subjective, and 2) objective methods [54], [55], [56]. The subjective methods involve a set of real users who explicitly rate the QoE as good/bad or give a rating on a continuous scale, usually ranging from 1–5, where 1 is the lowest while 5 is highest perceived QoE [57]; the average of all the individual ratings represents the Mean Opinion Score (MOS), a QoE metric standardized by the ITU-T P.910 recommendation. The main drawbacks of the subjective approach are: it is costly, time consuming and lacks repeatability [58]. These limitations have motivated the development of objective methods that do not involve real users, rather they rely on using objective video metrics to estimate the QoE. The QoE metrics for modern HTTP adaptive video streaming are summarized in Fig-ure 2.1, which can be objective or subjective. The objective metrics include 1) the initial startup delay (join time), 2) the number and duration of stalls (rebuffering), 3) the qual-ity of playout (usually quantified in terms of the spatial resolution of the video), and 4) the quality (resolution or bitrate) switches. The subjective metric is the Mean Opinion Score (MOS) that is the average of the ratings (usually on a scale of 1 – 5) given by a set of real users.
Owing to their ease of measurement, objective QoE metrics are commonly used in video QoE modeling studies [5], [59], since these metrics accurately reflect the subjective QoE of real users. We discuss the individual metrics in detail below.
Quality of video content Startup delay/Join time
Number of rebuffering/stalling events Duration of rebuffering/stalling events Quality/Bitrate switches
Mean Opinion Score (MOS) QoE metrics
Objective
(Application QoS) Subjective
Figure 2.1: QoE metrics for modern Internet video streaming
2.2.1 Startup delay
The startup delay is the time taken by the client (measured from the instant the user requests for the playout) to start playing out the video. Normally, when the user re-quests the video playback, the client starts downloading the video chunks and begins playout when a sufficient number of chunks have been downloaded. Startup delay is an important metric for QoE and subjective studies have shown it to have an impact on user engagement as large startup delays can cause users to abandon video playout. According to a subjective study based on a dataset of 23 million views in [39], users start abandoning after 2 seconds with the abandonment rate going up to 80% after 60 seconds. This means that the startup delay has to be minimal to ensure good QoE.
2.2.2 Stalling events
Stalling events occur when the playout buffer gets empty. The impact of stalls on video QoE has been extensively studied in literature and is shown to depend on the number, the duration and the position of the stalling events in the playout. Authors in [60] find that a larger stalling duration leads to a degraded QoE. Furthermore, the authors also find that users prefer one long stalling event over frequent short ones. In [61], it is observed that the position of the stalling event also has an impact on QoE where stalls occurring at the beginning of playout have a lesser impact than stalls occurring later in the playout. Furthermore, in [62], authors show that stalls occurring at irregular intervals are worse than stalls occurring periodically. The authors of [4] find an exponential relationship between the stalling events and the MOS. Additionally, they find that users can tolerate at most one stall per video session as long as its duration is in the order of a few seconds, any additional stalls degrade the QoE severely. Overall, these studies show
that whenever possible, the videos should be played out smoothly without any stalls to ensure good QoE.
2.2.3 Video quality
Video quality is a characteristic of a video passed through a transmission system (the Internet) or a processing system (video codec) that measures the perceived degradation in the video content, generally, w.r.t the original raw video. The visual quality evaluation is performed using Visual Quality Assessment (VQA) [7] methods.
2.2.3.1 Visual Quality Assessment (VQA)
VQA methods can be subjective if real users rate the quality of the video, or objective if automatic algorithms rate the quality of the video instead of real users. The objective VQA methods can be categorized as Full Reference (FR), Reduced Reference (RR) and No Reference (NR) [7]. FR based metrics have both the original and the distorted video available, which are compared with each other to estimate how similar the two videos are frame by frame. Examples of such metrics include Peak Signal to Noise Ratio (PSNR) [63], Structural Similarity (SSIM) [64], Video Quality Metric (VQM) [63] and Video Multimethod Assessment Fusion (VMAF) [65]. In RR, only partial information of the original video is used to rate the distorted video [66], while NR methods do not have the original video and the quality assessment is done directly on the distorted video by relying on algorithms that identify different visual artifacts such as blurring, contrast variations or blockiness [67].
VQA has its relevance in evaluating the quality of a received video in real time video streaming solutions. Such streaming solutions are prone to visual distortions (the video frames getting distorted or dropped) in the playout due to packet losses as the solutions are based on UDP. However, today’s Internet video is mostly based on HAS (runs on top of TCP/QUIC) and does not have any visual distortions during playout. Therefore, most QoE studies on HAS rely on using much simpler metrics for evaluating video quality. These metrics are the encoding bitrate and the spatial resolution of playout (the number of pixels used to represent the video frames). The encoding bitrate is the data required to play one second of video; it increases with the spatial resolution, which in turn generally increases video quality. Since these metrics have a direct impact on the video quality [68], these can be used to gauge the quality for HAS [7] without relying on a complex analysis of the video content. In our work, we consider the spatial video resolution as the metric of video quality.
2.2.4 Quality switches/adaptation
In adaptive video streaming, the quality of the video (spatial resolution) can change depending upon the network conditions; the client can decrease the quality in case of low network throughput and increase it when the network throughput improves. However, too many quality changes can also have a detrimental impact on QoE [69]. The amplitude of the quality switch is also important as authors in [70] find that a stepwise decrease in quality is better than one single big decrease in quality. Furthermore, in [71], it is shown that the QoE of a video played at constant low quality is better than the QoE of a video played at a higher quality with frequent quality changes. Overall, playing with constant quality is always better, however, if a quality downgrade is needed, it should be done gradually rather than abruptly.
2.2.5 MOS prediction models
Many subjective studies have shown a direct relationship between the application QoS features and the MOS. This led to the development of MOS prediction models that esti-mate the MOS using the application QoS. Such models suggest an exponential, logarith-mic or a linear relationship between the QoS and the QoE. In [72], a general logarithlogarith-mic relationship between QoS and QoE is proposed, whereas, in [73], the authors present an exponential relationship between the QoS and the QoE and refer to it as the IQX hypothesis. According to this hypothesis, the change in the QoE depends on the current level of the QoE, that is if the QoE is already very high, then even a small disturbance in QoS can significantly affect the QoE; however, if the QoE is low, further disturbances will not be perceived. This hypothesis demonstrated better approximation to the MOS compared to the earlier logarithmic relationship. A similar exponential relationship is also observed in [4] where the MOS follows an exponential relationship with the number and duration of stalls in YouTube video streaming. In another work [50], the authors propose a composite metric to gauge video QoE that is composed of a weighted linear combination of different QoE metrics including the quality, the stalls, and the quality switches.
Given the importance of video QoE estimation for network operators, the International Telecommunications Union (ITU) has developed a MOS prediction model, namely the ITU-T P.1203 model [1] for adaptive video streaming. This model estimates the MOS considering the application QoS features only and is developed based on subjective QoE ratings obtained from experiments with real users. We discuss this model in the next section.
Figure 2.2: Building blocks of ITU-T P.1203 model. The figure is taken from [1].
Figure 2.3: Modes of operation of ITU-T P.1203 model. The figure is taken from [1].
2.2.5.1 The ITU-T P.1203 model
The ITU-T P.1203 model is a parametric model for audiovisual quality assessment of adaptive video streaming. It has three main building blocks that include the audio qual-ity estimation module (Pa), the video qualqual-ity estimation module (Pv) and the qualqual-ity integration module (Pq) as shown in Figure 2.2. The quality integration module is fur-ther composed of modules for audio/video temporal integration and for estimating the impact due to stalling.
The model has four modes of operation depending upon the complexity of the input features as shown in Figure 2.3. As can be seen, mode 0 only requires the metadata on the chunk level, while for other modes, additional information on the frame level is required.
The model takes as input the following information:
1. I.GEN: Display resolution and device type (PC/TV or mobile) 2. I.11: Audio coding information.
4. I.14: Video startup delay and stalling event information (timestamp and duration of each stall).
The I.11 and the I.13 can be on the chunk level or the frame level. Information for I.13 includes the bitrate, the frame rate, the chunk duration, the encoding resolution and the codec type for each video chunk.
The model outputs are as follows:
1. O.21: Audio coding quality per sampling interval. 2. O.22: Video coding quality per sampling interval. 3. O.23: Perceptual stall indication.
4. O.34: Audiovisual chunk coding quality per sampling interval 5. O.35: Final audiovisual coding quality score.
6. O.46: Final media session quality score. This score (ranging from 1 – 5) is the final subjective MOS for the given video session.
Model outputs O.21, O.22 and O.34 are used when frame level information of the video is provided to the model while the rest of the outputs require only the chunk level information.
We consider the ITU-T P.1203 model as the subjective MOS in our work in Chapter 5 where we try to estimate the ITU MOS (O.46) using the inband network QoS features. We use mode 0 of the model since we rely on the encrypted traffic for inferring the ITU MOS. Furthermore, the metadata needed to get the ITU MOS is obtained from the Google Chrome browser using the YouTube API [74] and the Chrome Webrequest API [75].
In the next section, we discuss the methodologies used in literature for modeling QoE of video streaming.
2.3
Methodologies for modeling video QoE
The QoE of video streaming is dependent on the application QoS metrics, which in turn are dependent on the network QoS metrics. QoE modeling studies aim at understanding and building the relationships between the application or the network QoS to the video QoE. These studies are mostly data-driven and the data required by the models is either collected in the wild or built by controlled experimentation.
2.3.1 QoE modeling using data collected in the wild
Here, the QoS-QoE models are based on data that is generated by real users using their end devices or by the collection of the measurement data observed within the networks of the service providers. A YouTube QoE model is developed in [4] that is based on data obtained through crowdsourcing. Specifically, the data is collected from 1,349 users who rate the QoE of 4,047 video streaming sessions in a Google Chrome browser using the Microworkers [76] crowdsourcing platform; the QoE metrics such as the stalling events are collected in the Chrome browser using JavaScript. The main finding of this work is that the MOS follows an exponential relationship with the number of stalls in the video playout.
In [77], an android mobile application called YoMoApp is developed to passively monitor the relevant objective metrics (i.e., player state/events, buffer, and video quality level) for YouTube QoE from end user smartphones. A field study of the dataset collected by this application is provided in [78] where the relevant application and network QoS metrics are used to characterize the performance of YouTube video streaming. Simi-larly, in [79], the authors develop a tool that actively crawls the YouTube website and downloads videos while collecting additional information about the network and the CDN characteristics. This tool allows the measurement of YouTube QoE from end user devices.
In another work [80], a real time QoE Detection method is presented for encrypted YouTube video streaming traffic. The dataset they build consists of 60 diverse YouTube video clips streamed over WiFi networks from three operators. Machine Learning (ML) is then used to predict objective QoE metrics such as buffer warning (low buffer, high buffer), video state (buffer increase, buffer decay, steady, stall), and video resolution from the inband network QoS features
Additional works such as [81] and [82] present large scale video QoE modeling studies from data that is collected using client-side instrumentation. The datasets considered are composed of 200 and 300 million video sessions respectively and are used to identify the reasons affecting QoE and user engagement. These works consider the objective QoE metrics including join time, stalling events, rebuffering ratio (total stalling time divided by the video session time), average video bitrate, rendering quality and video playback failure rate. The main findings of these works are related to the identification of issues that affect QoE and user engagement. Mainly three issues are identified as reasons for poor QoE, which are network throughput variations, CDN performance issues, and ISP overloading. Furthermore, the rebuffering ratio is found to have the greatest impact on user engagement.
2.3.2 QoE modeling by controlled experimentation
In controlled experimentation, the target video application is run in a controlled envi-ronment. Given the fact that large scale datasets collected in the wild are generally not made public, researchers working in the domain of QoE modeling have to rely on building their own datasets by controlled experimentation. Here the QoS metrics are accurately controlled to build the relationship between the QoS and the QoE. These studies can be subjective if real users rate the QoE in terms of the MOS or objective if only the application QoS metrics are used to gauge the QoE.
Authors in [6] create an experimental platform for HTTP streaming videos where the QoS metrics are artificially varied in the video playouts to study their effect on the corresponding MOS. The dataset used consists of experiments conducted with a set of 10 users and the QoS metrics used for experiments are predefined by uniform sampling of the experimental space.
In another work [83], 141 volunteers are asked to rate the QoE of adaptive video stream-ing sessions based on DASH under trace-driven network emulations. The result of their study is in line with previous studies, which states that the QoE of adaptive streaming is affected by factors such as fluency, bitrate distribution, startup bitrate level and bitrate switching frequency in the playout.
In [84], a QoS to QoE causality analysis is done with a set of sixteen test users who rate their perceived quality of YouTube videos under different emulated network conditions. In [85], the effect of different transport protocols (TCP and UDP) on the QoE of YouTube video streaming on a bottleneck link is presented. The authors derive mapping functions that accurately describe the relationship between network-level QoS features and the QoE for both the protocols.
In another work [23], a real time QoE monitoring model is developed for estimating objective QoE metrics from encrypted video traffic of YouTube that is based on both the TCP and the QUIC transport protocols. The authors perform controlled experiments and build a dataset of 5488 and 5375 video sessions for QUIC and TCP respectively. They use Linux traffic control to emulate the network conditions with random sampling of the experimental space and use ML to predict the startup delay, the stalling events and the video resolution from inband network QoS measurements such as packet interarrival times, packet sizes and throughput.
2.3.3 QoE prediction from network QoS
The video QoE depends on the network QoS. This inherent relationship allows the development of QoE models using ML to predict video QoE using only the network QoS. Using network QoS for QoE estimation is useful as it allows estimation of video QoE from encrypted traffic as well; most of today’s video traffic is encrypted and network operators do not have any visibility into the application level QoS metrics. Hence, the only possible option of network operators to estimate end user QoE is to rely on network-level measurements. These measurements can be made from end user devices or from within the networks. We refer to such measurements as outband and inband respectively (a comparison between the inband and the outband measurements is already given in Figure 1.2). We discuss each of the prediction scenarios for the respective type of QoS next.
2.3.3.1 From end user devices
Here, the network measurements consist of active packet probes sent by the client to-wards dedicated servers and are made outside the data plane (hence the name outband) of the video application. This approach is introduced in [16] for forecasting the QoE of Skype. Inline of this work, a mobile application called ACQUA [17] is also devel-oped that allows prediction of QoE of apps such as Skype and YouTube (the model for YouTube is developed in this thesis) using the outband network measurements of throughput, delay, packet loss, etc. Other than ACQUA, another android application that uses outband QoS to forecast QoE is called Meteor [18]. This application uses the network QoS measurements such as TCP throughput and delay to predict the QoE for applications such as Facebook, Netflix, etc.
The QoE models presented in [6] and [86] are also based on network measurements that are outband i.e., these models are based on measurements of throughput, delay and packet loss, which can be obtained by network monitoring applications including ACQUA, Meteor, Ookla SpeedTest, RTR-NetTest, and MobiPerf.
2.3.3.2 From within the network
The conventional approach of predicting QoE from network QoS relies on using inband QoS measurements collected directly from the video traffic on network middleboxes. This approach allows network operators to monitor the QoE of their end users. In this approach, the network QoS consists of features such as throughput, packet interarrival times and packet sizes, which are extracted from the encrypted traces to estimate the
Ref. Method Sampling Method Type of QoS NW QoS QoE metrics
[6], [86] CE Uniform NW Outband Startup delay,
num-ber and duration of stalls, MOS
[83] CE Trace based App NA Number and
dura-tion of stalls, video bitrate, MOS
[87] CE Trace based NW Inband Rebuffering ratio,
video bitrate
[85] CE Uniform NW and App Outband Number and
dura-tion of stalls, video bitrate, MOS
[23] CE Uniform NW Inband Startup delay,
num-ber of stalls, video resolution
[24] CE Uniform NW Inband Startup delay,
num-ber of stalls, video resolution, quality switches
[80] W NA NW Inband buffer state, video
state, and video res-olution
[81], [82] W NA App NA Startup delay,
stalling frequency, rebuffering ratio, video bitrate/quality and video abandon-ment rate
[77], [79] W NA NW and App Inband Buffer state,
num-ber and duration of stalls, buffer dura-tion, MOS
Table 2.1: Summary of methodologies used in literature for QoE modeling of video streaming. CE: Controlled Experimentation. W: Data collected in the Wild. NW:
Network. App: Application level. NA: Not Applicable.
video QoE. In [5], ML models based on random forests are trained to classify a video playout into three categories considering the stalling events (”no stall”, ”0-1 stalls”, or ”2 or more stalls”) and video resolution (low definition, standard definition, high definition). The data is collected from a web proxy of a mobile operator and consists of 390k video playouts in the wild. A similar approach is taken in [24] for building the models for QoE monitoring with three objective QoE classes (”low”, ”medium” or ”high”). These approaches predict the QoE for the video session in its entirety. Other works such as [23] target real-time QoE monitoring. The authors present ML models that use the network and the transport level features of the encrypted YouTube video traffic (both TCP and QUIC based) to infer the stalls and the resolution of playout in
windows of 10 second duration; the approach is similar to the preceding works, the only difference is the shorter prediction window (10 seconds instead of the entire playout). Apart from ML, in [87], the authors devise a heuristic that analyses the network and transport level features of the encrypted video traffic to infer the video bitrate and the rebuffering ratio based on a study of around 2k video playouts from two video service providers.
Overall, a summary of the QoE modeling methodologies is given in Table 2.1 where we highlight the methodology used, the measurement source, the type of network features and the QoE metrics.
In this thesis, we devise methodologies and models using controlled experimentation and ML for forecasting and monitoring QoE of video streaming using the outband and the inband network QoS features respectively. For QoE modeling with outband QoS, we use active learning to sample the experimental space to reduce the training cost, while we use trace based sampling for the QoE models based on inband QoS. Furthermore, we consider a large set of videos in our QoE modeling scenarios where we build a catalog of 1 million YouTube videos (by crawling the YouTube website offline using the YouTube Data API) that is then used to build the YouScore in Chapter 4 and the QoE monitoring models in Chapter 5.
Overall, to the best of our knowledge, we make the following novel contributions:
1. We are the first to apply active learning in the context of network QoS-QoE mod-eling by controlled experimentation; prior works either use uniform sampling or trace based sampling as shown in Table 2.1.
2. The YouScore developed in Chapter 4 takes as input only the network QoS to predict QoE in terms of a novel indicator that considers the diversity of contents offered by a content provider such as YouTube. Prior works do not quantify this variability in QoE due to the difference in contents.
3. We develop an unsupervised ML based method to infer chunk sizes directly from the encrypted traffic traces and use them as features in the ML models to show significant improvement in ML modeling accuracy (Chapter 5). Furthermore, we are the first to build ML models that link the network QoS measurements to the ITU-T P.1203 MOS.
In the next chapter, we discuss our active sampling methodology for building the QoE forecasting models for YouTube.
An Intelligent Sampling
Framework for Controlled
Experimentation and QoE
Modeling
For accurate QoE modeling, the controlled experimentation approach can result in a large number of experiments to carry out because of the multiplicity of the network features, their large span (e.g., bandwidth, delay) and the time needed to set up the experiments themselves. However, most often, the space of network features in which the experimentations are carried out shows a high degree of similarity in the training labels of QoE. This similarity, difficult to predict beforehand, amplifies the training cost with little or no improvement in QoE modeling accuracy. So, in this chapter, we aim to exploit this similarity and propose a methodology based on active learning, to sample the experimental space intelligently, so that the training cost of experimentation is reduced. We validate our approach for the case of YouTube video streaming QoE modeling from outband network performance measurements and perform a rigorous analysis of our approach to quantify the gain of active sampling over uniform sampling.
3.1
Introduction
Machine learning (ML) is gathering a huge amount of interest within the networking community. A typical example of this interest can be found in the domain of Quality of Experience (QoE) modeling of Internet applications where supervised ML classification
![Figure 2.2: Building blocks of ITU-T P.1203 model. The figure is taken from [1].](https://thumb-eu.123doks.com/thumbv2/123doknet/13209937.393182/39.893.193.625.131.373/figure-building-blocks-itu-t-model-figure-taken.webp)