HAL Id: hal-00993492
https://hal.archives-ouvertes.fr/hal-00993492
Submitted on 26 May 2014
HAL is a multi-disciplinary open access
archive for the deposit and dissemination of sci-entific research documents, whether they are pub-lished or not. The documents may come from teaching and research institutions in France or abroad, or from public or private research centers.
L’archive ouverte pluridisciplinaire HAL, est destinée au dépôt et à la diffusion de documents scientifiques de niveau recherche, publiés ou non, émanant des établissements d’enseignement et de recherche français ou étrangers, des laboratoires publics ou privés.
variabilities
I. Blanchet Letrouvé, A. Zalouk Vergnoux, A. Vénisseau, M. Couderc, B. Le
Bizec, Pierre Elie, C. Herrenknecht, C. Mouneyrac, L. Poirier
To cite this version:
I. Blanchet Letrouvé, A. Zalouk Vergnoux, A. Vénisseau, M. Couderc, B. Le Bizec, et al.. Dioxin-like, non-dioxin like PCB and PCDD/F contamination in European eel (Anguilla anguilla) from the Loire estuarine continuum: spatial and biological variabilities. Science of the Total Environment, Elsevier, 2014, 472, p. 562 - p. 571. �10.1016/j.scitotenv.2013.11.037�. �hal-00993492�
1 2 3 4 5 6 7 8 9 10 11 12 13 14 15 16 17 18 19 20 21 22 23 24 25 26 27 28 29 30 31 32 33 34 35 36 37 38 39 40 41 42 43 44 45 46 47 48 49 50 51 52 53 54 55 56 57 58 59
Dioxin-like, non-dioxin like PCB and PCDD/F contamination in European eel
1
(Anguilla anguilla) from the Loire estuarine continuum: spatial and biological
2
variabilities
3
4
I. Blanchet-Letrouvé1*, A. Zalouk-Vergnoux1, A. Vénisseau2, M. Couderc1, B. Le Bizec2, P. 5
Elie4, C. Herrenknecht1, C. Mouneyrac3, L. Poirier 1 6
1Université de Nantes, MMS, EA 2160, 9 rue Bias, Nantes F-44322, France
7
2LUNAM Université, Oniris, Laboratoire d’Étude des Résidus et Contaminants dans les Aliments (LABERCA),
8
Nantes, F-44307, France
9
3Université Catholique de l’Ouest, IBEA, CEREA, 44 rue Rabelais, Angers F-49008, France
10
4IRSTEA, 50 avenue de Verdun – Gazinet, Cestas F- 33612, France
11
* Corresponding author: +33685329898, isabelle.blanchet-letrouve@ac-nantes.fr
12 13 14
Abstract 15
To characterize the eel contamination by dioxin-like (dl) and non dioxin-like (ndl) PCBs and 16
PCDD/Fs, 62 eels from the Loire estuary (France) were analyzed. PCB contamination 17
significantly increased from glass eel stage (3.7 ±1.9 and 15.2±4.2 ng.g-1 dw) to other life 18
stages (for yellow eels: 62.8±34.4 and 381.8±181.8 ng.g-1 dw; for silver eels: 93.7±56.3 and 19
463.2±244.6 ng.g-1 dw respectively for dl and ndl PCB). An inter-site variability based on 20
PCB levels and fingerprints was observed between the three studied sites. The glass eel 21
pattern was mainly characterized by the less chlorinated PCBs contrarily to the other eels, 22
underlying a different bioaccumulation pathway. Overall, eels from this estuary showed an 23
intermediate contamination level compared to other international/national areas. However, 24
more than 60% of studied silver eels displayed WHO2005 PCDD/F and dl-PCB TEQ values
25
higher than the recommended level of 10 pg.g-1 ww. This statement indicates a potential 26
exposure to PCBs through eel consumption, especially with silver individuals, and could 27
potentially lead to damages for the eel population. 28
1 2 3 4 5 6 7 8 9 10 11 12 13 14 15 16 17 18 19 20 21 22 23 24 25 26 27 28 29 30 31 32 33 34 35 36 37 38 39 40 41 42 43 44 45 46 47 48 49 50 51 52 53 54 55 56 57 58 59 60 61 1. Introduction 30
Since the 1980s, monitoring studies in European countries have shown the decline of glass 31
eels arriving in the coastal waters and estuaries (ICES, 2006). The disappearance of the 32
prepubertal European eel (Anguilla anguilla) occurred as well a few decades earlier and 33
stocks were estimated to be divided by ten (Dekker, 2003; Moriarty and Dekker, 1997). 34
Several factors were brought forward to explain this decrease such as overfishing, obstacles to 35
migration (Robinet and Feunteun, 2002), pathogens (Palstra et al., 2007b), climate change 36
(Castonguay et al., 1994) and contaminants (Geeraerts et al., 2011; Palstra et al., 2007a; 37
Roosens et al., 2010; van Ginneken et al., 2009) 38
Among these different causes, polychlorinated biphenyls (PCBs), polychlorinated dibenzo-p-39
dioxins and furans (PCDD/Fs) seem to be particularly suspected because of their potential as 40
estrogenic and anti-estrogenic disruptors (Canapa et al., 2002) and their neuroendocrine 41
effects (Kodavanti and Curras-Collazo, 2010), endangering several fish species and notably 42
the eel population (van Ginneken et al., 2009). PCBs represent a particularly persistent 43
chlorinated chemical group of 209 congeners, ubiquitous in the environment and from 44
anthropological origin exclusively. Two classes of PCBs were distinguished according to their 45
toxicological properties: the dioxin-like PCBs (dl-PCBs) which present analogous toxicity as 46
dioxin compounds and the non dioxin-like PCBs (ndl-PCBs) (European Union, 2011). These 47
classes were related to chemical structures such as the number and chlorine positions. Due to 48
their chemical stability, insulating and fire retardant properties, PCBs were used in the 49
manufacturing of electrical equipment, heat exchangers, hydraulic systems, and several other 50
specialized applications. In spite of the ban on their production during the eighties, the 51
accumulated production all over the world was estimated at 1,200,000 tons and approximately 52
30 % of this production is scattered in the environment, essentially in the oceanic environment 53
(Voltura and French, 2000). The contamination of aquatic organisms depends on the chemical 54
properties of each congener. The exposure level in the environment and various biotic factors 55
such as the metabolic capacity influence the bioaccumulation processes (Hubaux and 56
Perceval, 2011). 57
Considered as a bottom dwelling fish, showing a high body lipid content, an important 58
longevity and a carnivorous status, the European eel is extremely exposed to lipophilic 59
persistent contaminants, such as PCBs, and represents a species sensitive to bioaccumulation 60
(Roche et al., 2000). Moreover, eels constitute an important economic value nearby estuaries 61
1 2 3 4 5 6 7 8 9 10 11 12 13 14 15 16 17 18 19 20 21 22 23 24 25 26 27 28 29 30 31 32 33 34 35 36 37 38 39 40 41 42 43 44 45 46 47 48 49 50 51 52 53 54 55 56 57 58 59
and rivers and a significant food resource (Perraudeau and Després, 2009). Significant levels 62
of PCBs were detected in European eels from the Gironde and Adour estuary (France) (Tapie 63
et al., 2011), in the Mondego estuary (Portugal) (Nunes et al., 2011), in the rivers of Italy 64
(Mezzetta et al., 2011 ) and could be responsible for migration or reproduction impairments 65
(van Ginneken et al., 2009). Assessing PCB contamination of the European eel is therefore of 66
great interest since their level is threatening public health, beyond a maximal value (European 67
Union, 2011) and is also a potential risk for its own health (for review, Geeraerts and 68
Belpaire, 2010). The present study aims to assess PCB contamination of the European eel 69
from the Loire estuary (France) which the basin (117,800 km2) drains a lot of tributaries. 70
Moreover, the Loire estuary runs through important urban sites (Nantes, Saint-Nazaire) with 71
shipping, industrial and agricultural activities. It displays a diffusive pollution including a 72
mixture of contaminants such as heavy metals (Grobois et al., 2012), pesticides (Marchand et 73
al., 2004), PAHs and PCBs (Hubaux and Perceval, 2011). For European eels, this estuary 74
constitutes one of the most important continental migration path of glass eels. The 75
preservation of its chemical quality is therefore essential for eel health. However, a real lack 76
of data on the POPs contamination levels of European eels exists in this ecosystem. Only few 77
individuals, sampling on the whole Loire river, have been analyzed in the French PCB 78
framework (ONEMA, 2012). These results cannot be sufficiently representative of eels living 79
in the estuary. In the present study, dl-PCB, ndl-PCB and PCDD/F levels were investigated in 80
European eels fished in the Loire estuary. This work was set out to reach three objectives : 81
i)to get a representative trend of PCB contaminants over life stages, from glass eels to silver 82
eels; ii) to assess spatial PCB contamination variations on yellow individuals (similar size 83
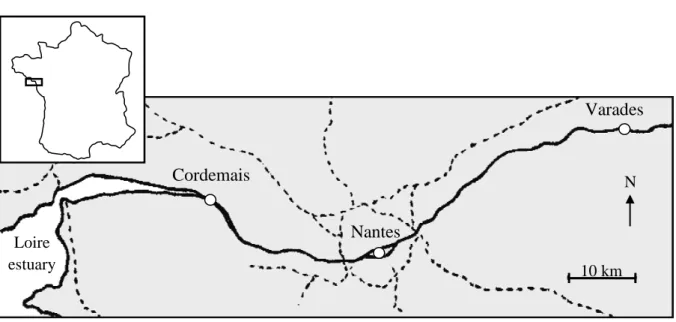
class distributions), along three different Loire estuary sites (Fig. 1), iii) to evaluate health 84
risks for local consumers with PCDD/F and dl-PCB TEQs quantification according to WHO 85
recommendations (van den Berg et al., 2006). 86
87
2. Material and methods 88
2.1. Sampling sites 89
As shown in Fig.1, three sampling sites were selected in this study. Varades is a small city 90
(about 3550 locals), located upstream in the estuary at the limit of the salinity (100 km from 91
the Loire mouth); it also presents few industrial activities and is particularly under agricultural 92
1 2 3 4 5 6 7 8 9 10 11 12 13 14 15 16 17 18 19 20 21 22 23 24 25 26 27 28 29 30 31 32 33 34 35 36 37 38 39 40 41 42 43 44 45 46 47 48 49 50 51 52 53 54 55 56 57 58 59 60 61
located at 50 km from the mouth, characterized by an industrial harbor and an urban zone 94
including two incineration factories. The third site, Cordemais, is downstream of Nantes with 95
a strong influence of the North Atlantic Ocean and is well-known for its industrial activities, 96
particularly the presence of a coal-fired power plant and closed to an industrial complex 97
including oil refineries. These three sampling sites were chosen in order to represent the 98
estuary displaying different kinds of human activities. 99
2.2. Sampled animals 100
During one year and a half, i.e. from May 2009 to January 2011, European eels were 101
captured by local fishermen according to the fishing authorizations, in the three sampling sites 102
described above. Using specific methods, 62 yellow and silver eels were collected with fyke 103
and stow nets respectively. The aim of the sampling procedure was to evaluate the potential 104
spatial variability of contaminant levels in eels on these 3 different sites, to upstream from 105
downstream. Consequently, 16 yellow eels were captured in Varades, 16 in Nantes and 17 in 106
Cordemais. The captured eels were preferentially selected in order to obtain a similar size 107
class distribution, i.e. about 4 to 5 eels per size class and par site. To evaluate the trend in 108
contaminant level over life stage, glass eels and 13 silver eels were also captured. Individuals 109
were transported to the laboratory in aerated 200 L tanks filled with water from the sampling 110
site. They were maintained in the laboratory few hours until dissection under a natural 111
photoperiod (L15/D9) and at a temperature around 12 ± 2 °C, equivalent to the fishing site 112
conditions. Glass eels were collected with a specific fishing net (authorized mesh size) in 113
January 2011 in the estuary entry, near Cordemais. These glass eels had no pigment and 114
corresponded to a stage before the onset of the feeding (Elie et al., 1982). They were directly 115
frozen at -20°C in aluminum foil after fishing and later divided into two different pools. 116
117
2.3. Biometric parameters and life stages of the biological samples 118
Eels were anesthetized in a water bath of 10 L added with 1.5 to 2 mL of clove oil solution 119
dissolved in ethanol (70%), according to the weight of eels (Palstra et al., 2007a). Once 120
anesthetized, the body length (BL in mm) and the body weight (BW in g) of each European 121
eel were measured. The animals were then sacrificed, skinned and dissected in order to collect 122
filets and otoliths. Biometric parameters were recorded to evaluate the Fulton’s condition 123
1 2 3 4 5 6 7 8 9 10 11 12 13 14 15 16 17 18 19 20 21 22 23 24 25 26 27 28 29 30 31 32 33 34 35 36 37 38 39 40 41 42 43 44 45 46 47 48 49 50 51 52 53 54 55 56 57 58 59
factor (K= (BW x 105) / BL3 with BW and BL respectively expressed as g and mm) (Fulton, 124
1904). 125
The otoliths were utilized to determine the age of the organisms. The pair of otoliths named 126
sagitta were removed from the eel's head. After extraction, otoliths were cleaned of all organic 127
membranes in distilled water, dried with ethanol, and then stored in Eppendorf tubes. The 128
otoliths were later embedded in synthetic resin (Synolithe), and then polished to the nucleus 129
with a polishing wheel (Streuers Rotopol-35) using two different grits of sandpaper (1200 and 130
2400). Fine polishing was done by hand with alumina (1µm grain) on a polishing cloth. 131
Etching was done using 10% EDTA. A drop of this solution was applied on the mold during 132
fifteen minutes. Then, the otoliths were rinsed with distilled water and stored in dry condition. 133
Yearly increments were revealed by staining with a drop of 5% Toluidine blue on the otolith 134
and letting it dry. Growth rings were then counted under binocular magnifier. The age of each 135
eel was determined by the number of increments starting from the nucleus, which was 136
considered as year 1 of the eel's life. The otolithometry was realized in partnership with the 137
IRSTEA (Cestas, France). Silver stage was determined by macroscopic characteristics such as 138
the differentiated lateral line (presence of black corpuscules), a contrasting skin color (dark 139
dorsal surface and a white ventral surface), the ocular diameter and the pectoral fin length. 140
141
2.4. PCB and PCDD/F analysis 142
Eel filets and pools of glass eels were analyzed for 18 PCBs (n= 62 and 2 pools of glass eels). 143
Among them, 12 are dl-PCBs (#77; 81; 105; 114; 118; 123; 126; 156; 157; 167; 169; 189) and 144
6 are ndl-PCBs (#28; 52; 101; 138; 153; 180). Ndl-PCB and dl-PCB levels in eel filets and 145
pools of glass eels were expressed as a sum of all congeners. In order to assess a potential 146
health risk, PCDD/F analyses were achieved on 11 out of 62 eels (5 yellow and 6 silver 147
individuals) and on the 2 pools of glass eels. The PCDD/Fs analyzed were the 17 congeners 148
regulated by the European Union (EC/1259/2011). PCB and PCDD/F levels were expressed 149
by congeners or as a sum of all congeners in ng.g-1 dry, lipid or wet weight (dw, lw or ww). 150
2.4.1 Reagents and Chemicals 151
All organic solvents (Promochem) were Picograde® quality. Silica (Fluka), sodium sulfate 152
(Merck), and sulfuric acid (SDS) were of superior analytical quality. Native and 13C-labeled 153
1 2 3 4 5 6 7 8 9 10 11 12 13 14 15 16 17 18 19 20 21 22 23 24 25 26 27 28 29 30 31 32 33 34 35 36 37 38 39 40 41 42 43 44 45 46 47 48 49 50 51 52 53 54 55 56 57 58 59 60 61
Laboratory. Standard solutions were prepared in toluene. All reference solutions were stored 155
in darkness at a temperature < 6°C. 156
2.4.2 Sample preparation procedure 157
Eel filets and pools of glass eels were homogenized, weighed and freeze-dried. Five grams of 158
filets and pools of glass eels were cut, dehydrated, and milled using a turbo-mixer with glass 159
bowl. Each experiment was realized with disposable material. Then, samples were powdered 160
and transferred into cells in order to be extracted by Accelerated Solvent Extraction (ASE) 161
using a Dionex ASE 300. Before extraction, eighteen 13C-labelled PCB congeners were added 162
to the samples for internal standard calibration and quantification by the isotope dilution 163
method. Pressure and temperature were set to 100 bars and 120°C respectively. The extraction 164
solvent was a mixture of toluene/acetone 70:30 (v/v), and three successive extraction cycles 165
(5 min each) were performed. The extract was evaporated to dryness by rotary evaporation 166
(40°C), allowing the gravimetric determination of the fat content, in order to assess the filet 167
lipid weight (LW in % of wet weight). The extracts were dissolved in 25 mL of hexane for 168
sample clean-up. 169
Three purification steps were then performed, using successively acid silica, Florisil® and 170
celite/carbon columns. After removal of fat on the first silica gel column activated with 171
sulfuric acid, PCBs were separated from PCDDs/PCDFs on the second Florisil® column. The 172
separation of coplanar (non-ortho) PCBs from non coplanar PCBs was achieved on an 173
activated mixture of Florisil®/ Carbopack C/Celite 545 (overnight at 130°C). After the 174
addition of external standards for the recovery calculation (13C12-PCB #111 for PCBs), final
175
sample extracts were evaporated under a nitrogen stream to dryness and reconstituted in 20 176
L, 50 L and 10 L of toluene for coplanar PCBs, non coplanar PCBs and PCDD/Fs 177
respectively. 178
2.4.3 GC-HRMS measurement 179
PCB and PCDD/F measurements were performed by gas chromatography coupled to high 180
resolution mass spectrometry (GC-HRMS) using an 7890A gas chromatograph (Agilent) 181
coupled to a JMS 700D or a JMS 800D double electromagnetic sector high resolution mass 182
spectrometer (Jeol, Tokyo, Japan). A DB5MS (30 m x 0.25 mm x 0.25 µm) capillary column 183
(J&W) was used in the splitless mode. The GC program for PCBs was 120°C (3 min), 184
20°C/min to 170°C (0 min), 3°C/min to 245 °C (0 min) and finally 20°C/min to 275°C 185
1 2 3 4 5 6 7 8 9 10 11 12 13 14 15 16 17 18 19 20 21 22 23 24 25 26 27 28 29 30 31 32 33 34 35 36 37 38 39 40 41 42 43 44 45 46 47 48 49 50 51 52 53 54 55 56 57 58 59
(7 min). Ionization was achieved in the electron ionization mode (42 eV electron energy). The 186
spectrometric resolution was set at 10,000 (10% valley), and the signal acquisition was 187
performed in the Single Ion Monitoring (SIM) mode focusing on the two most abundant 188
signals from each target molecular ion (35Cl and 37Cl isotopic contributions). Signals were 189
integrated by JEOL Diok software (v.4). The detection and quantification limits (LOD and 190
LOQ respectively) are calculated by JEOL Diok software according to the regulation for 191
dioxin compounds analysis (LOD=LOQ at Signal/Noise=3). A LOD is calculated for each 192
congener and each sample (according to the sample mass). 193
2.4.4 Toxic equivalency calculation 194
Toxic Equivalent Quotient values (TEQ) were calculated according to the 2005 World Health 195
Organization Toxic Equivalency Factors (van den Berg et al., 2006) and basically expressed 196
on a fresh weight basis. 197
2.4.5. Quality assurance/quality control 198
All these procedures integrated quality control parameters to fulfill the requirements of the 199
Commission Directive 2002/69/EC and 2002/70/EC of July 2002, laying down the sampling 200
methods and the methods of analysis for the official control of dioxins and the determination 201
of dl-PCBs in foodstuffs and feedingstuffs respectively. Moreover, all analyses were 202
performed upon a double quality management system associated with an accreditation system 203
according to the ISO 17025:2005 standard for analytical measurements. 204
2.5. Statistical analysis 205
The Shapiro-Wilk and the Kolmogorov-Smirnov tests were employed to determine the 206
normality of the results. Consequently to these tests, non-parametric tests (Kruskal-Wallis and 207
pair-wise comparison tests) were used in order to highlight significant differences of PCB 208
levels and fingerprints in filets of eels with different life stages and from different sites. The 209
significant level of each test was determined according to Bonferroni correction (corrected 210
significant level of 0.005). To compare PCB levels in eel filets from different sites and 211
facilitate their discrimination, Principal Component Analysis (PCA) were performed. 212
WHO2005 PCDD/F and dl-PCB TEQ values were compared according to life stages using
213
Mann-Whitney test at a significant level of 5%. All statistical treatments were realized with 214
XLstat software. 215
1 2 3 4 5 6 7 8 9 10 11 12 13 14 15 16 17 18 19 20 21 22 23 24 25 26 27 28 29 30 31 32 33 34 35 36 37 38 39 40 41 42 43 44 45 46 47 48 49 50 51 52 53 54 55 56 57 58 59 60 61 216
3. Results and discussion 217
3.1 Biometric parameters 218
Table 1 shows biometric parameters of the European eels collected in the Loire estuary 219
according to life stage, sampling site and size class. The increase of BW is positively 220
correlated with the increase of BL whatever the life stage (yellow or silver), and the sampling 221
site. The linear regression equations for yellow eels are: Varades BL=126.18 lnBW-154.9 222
R²=0.97 (n=16); Nantes BL=152.8 lnBW-292.5 R²=0.97 (n=16); Cordemais BL=113.14 223
lnBW-105.2 R²=0.98 (n=17) and those of silver eels was BL=220.94 lnBW-685.9 R²=0.98 224
(n=13). The age of eels is associated to BL and BW, only for yellow individuals from 225
Cordemais (BL=60.9 Age+109.2 R²=0.77 (n=17)). No significant correlation was observed 226
for yellow individuals from others sites and for silver eels. Fulton’s condition factor values 227
(K) are roughly similar in the range of the different size classes studied as well as according to 228
the sampling site and the life stage, with values ranging from 0.13 to 0.17. According to 229
(Feunteun, 2002), these values are representative of eel good health of in the Loire estuary. 230
Such values are similar to the Fulton’s condition factor found in other studies about European 231
areas (Gravato et al., 2010; Palstra et al., 2007b; Tapie et al., 2011). Nevertheless, better eel 232
conditions were calculated in some other studied sites like the River Rhine watershed and 233
Lake Ijsselmeer (Haenen et al., 2010). 234
3.2 Influence of life stage, sampling site and size class on dl and ndl-PCB levels 235
Table 1 shows the PCB levels (dl and ndl-PCBs) according to the life stage, the sampling site 236
and the size class. As it was already reported in a previous work (Tapie et al., 2011), PCB 237
levels determined for glass eels were higher than the limit of quantification of the analytical 238
methods. The sums of dl and ndl-PCBs are 3.7±1.9 ng.g-1 dw and 15.2±4.2 ng.g-1 dw 239
respectively. These levels could be the result of a contamination via the food web during the 240
leptocephali stage (plankton) and to a direct exposure from the aquatic compartment. Another 241
hypothesis could be an intergenerational transfer of contaminants (Palstra and van den 242
Thillart, 2011). 243
Regarding yellow eels, the PCB contamination increases and becomes significantly higher 244
compared to glass eels whatever the sampling site and the size class considered. Regarding 245
each site, the trends of ndl and dl-PCB levels expressed as ng.g-1 dw or lw are similar and 246
1 2 3 4 5 6 7 8 9 10 11 12 13 14 15 16 17 18 19 20 21 22 23 24 25 26 27 28 29 30 31 32 33 34 35 36 37 38 39 40 41 42 43 44 45 46 47 48 49 50 51 52 53 54 55 56 57 58 59
showed no significant difference according to the size classes. This observation could be 247
attributed to the low sample number per size class. Nevertheless, it is possible to conclude that 248
PCB levels were not correlated to BL and BW, except for eels from Nantes (Table 1). 249
Considering the results depicted for eels from Nantes and the eel ecology (bottom dwelling 250
fish), the increasing contamination with BL and BW could be attributed to the continental 251
phase longevity and consequently to the time spent in the estuary environment, in close 252
contact with potentially contaminated sediments. It could be also related to the trophic chain 253
based on a more or less contaminated food. 254
Regarding the silver eels, dl-PCB levels, expressed as ng.g-1 dw, were significantly higher 255
than results for yellow eels from Varades and Cordemais. Considering the same unit, ndl-PCB 256
levels for silver eels were significantly higher than levels for yellow eels from Varades only. 257
Considering dl- and ndl-PCB levels expressed as ng.g-1 lw, the results tend to decrease but are 258
only significantly different to those for yellow eels from Nantes, and whatever all the size 259
classes. This results can be explained by the highly lipid content in silver eels leading to a 260
dilution of the contaminants. 261
In a previous work (Tapie et al., 2011), a review about marker PCB levels in Anguilla 262
anguilla filets was achieved from the literature. Marker PCB congeners are #28, 52, 101, 118,
263
138, 153 and 180. To compare with this synthetic review , the values obtained in this study 264
for the last congeners were summed, , and expressed as ng.g-1 ww and lw (Table 1). The PCB 265
congener #118 is usually used as a marker PCB until now (ANSES, 2011). The percentage of 266
this congener was relatively constant and represented an average of 9.39 ± 2.7 % of total PCB 267
marker level. 268
At the international scale, eels from the Loire estuary appear to be more contaminated than 269
those from some other sites in Poland, Ireland, Spain, Italy and the UK (Bordajandi et al., 270
2003; Corsi et al., 2005; McHugh et al., 2010; Santillo et al., 2005). However, other sites are 271
more contaminated than the Loire estuary (twice to 10 times higher), i.e. the River Elbe in 272
Czech Republic and Germany, the Tevere and Gagliarino rivers in Italy, Flanders in Belgium 273
and different lakes in Finland (Belpaire et al., 2011; Maes et al., 2008; Tulonen and Vuorinen, 274
1996; van der Oost et al., 1996). Throughout France, eels from the Loire estuary are slightly 275
more contaminated than those from the Vacares lagoon and about three times more than those 276
from the Thau pound (Oliveira Ribeiro et al., 2008; Santillo et al., 2005), whereas they are 277
1 2 3 4 5 6 7 8 9 10 11 12 13 14 15 16 17 18 19 20 21 22 23 24 25 26 27 28 29 30 31 32 33 34 35 36 37 38 39 40 41 42 43 44 45 46 47 48 49 50 51 52 53 54 55 56 57 58 59 60 61
less contaminated than eels from the Rhone River (about ten times less) and the Gironde 278
estuary (about two times less, whatever the life stage and the size class) (Tapie et al., 2011). 279
In the study of Tapie et al. (2011), a significant decrease of marker-PCB levels expressed as 280
ng.g-1 dw was observed for eels exceeding 600 mm. These authors hypothesized that this 281
decrease could be induced by two parameters regarding the sexual maturity of the individuals 282
of this size class. On the one hand, eels could be at the onset of the silvering and coming from 283
upstream areas, less contaminated. On the other hand, silver eels could be already in 284
starvation and start to mobilize lipid stores as fuel energy to ensure the sexual maturation and 285
swimming towards spawning areas. This mobilization of lipids was already proposed to 286
explain a decrease in lipid contents observed in filets of eels larger than 800 mm (Durif et al., 287
2005). In this present work, no decrease is observed for eels with length superior than 600 288
mm whatever the unit expression. . 289
290
In order to evaluate the correlations between biometric parameters and PCB levels as well as 291
the sampling site effect, a principal component analysis (PCA) was performed by using 292
biometric parameters (age, BW, BL and LW) and dl and ndl-PCB levels expressed as ng.g-1 293
dw. Since silver eels are not strictly territorial, due to their downstream migration, they could 294
be originated from other sites than sampling ones. For that reason, the PCA was performed 295
with yellow eels only. As it was shown in the Table 1, the size class distributions between the 296
3 studied sites are comparable. Consequently, it is possible to study and discuss the presence 297
of an eventual sampling site effect on yellow eel impregnation. 298
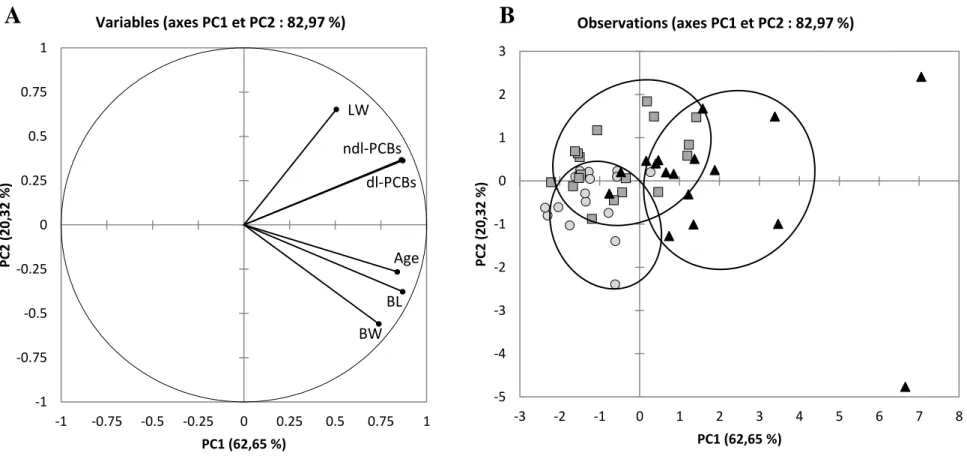
The correlation loading and sample representation are shown on figure 2 (respectively Fig.2 A 299
and Fig.2 B). The first two principal components (respectively PC1 and PC2) describe 300
82.97% of the total variability among eels. PC1 and PC2 represent respectively 62.65 and 301
20.32%. 302
The correlation loading (Fig.2A) highlights that biometric parameters (BW, BL and age) are 303
correlated to each other as it was depicted in Table 1. Concerning LW, it appears to be quite 304
correlated to both levels of dl- and ndl-PCBs. This observation was expected and already 305
well-known according to the lipophilic properties of PCBs (van der Oost et al., 1996). 306
Regarding the sample presentation in Fig.2B, the eels are relatively clustered according to the 307
three different sampling sites. The comparison of Fig.2A and Fig.2B underlines that eels from 308
1 2 3 4 5 6 7 8 9 10 11 12 13 14 15 16 17 18 19 20 21 22 23 24 25 26 27 28 29 30 31 32 33 34 35 36 37 38 39 40 41 42 43 44 45 46 47 48 49 50 51 52 53 54 55 56 57 58 59
Varades are the lowest contaminated by dl and ndl-PCBs closely related with lower LW. The 309
eels from Nantes and some of those from Cordemais are more contaminated, showing a 310
higher LW. However, eels from Nantes present a higher heterogeneity. The inter-site 311
differences observed could be also related to differences of biometric parameters such as the 312
BL and the age, characterizing a different exposition time (9.8 ± 1.9 years for eels from 313
Nantes compared to 4.4 ± 1.4 years and 5.9 ± 1.9 years for eels from Cordemais and Varades, 314
respectively). 315
Moreover, Varades is a small city (about 3550 locals), relatively preserved, located upstream 316
in the estuary, and with few industrial activities. It is probably for these reasons that the eels 317
from this sampling site are less contaminated than the others. Nantes is indeed an important 318
city (about 600000 locals) and Cordemais is downstream of Nantes and well-known for its 319
industrial activities. In this study, the living area of eels seems to affect their contamination 320
level as it was already shown in the Gironde estuary (Tapie et al., 2011). These inter-site 321
differences would be highlighted in the next section dealing with eels PCB fingerprints. 322
323
3.3 PCB fingerprints in eels according to the sampling site and life stage 324
A sampling site effect has been previously demonstrated (Fig.2). A second PCA was then 325
performed using individual PCB levels expressed as ng.g-1 dw. For the same reason that 3.2 326
paragraph, this second PCA was realized with yellow eels only. Consequently, this PCA was 327
useful in order to evaluate the influence of the sampling site on PCB fingerprints in yellow 328
eels. 329
The result of the PCA correlation loading is shown in Fig.3A. The first two principal 330
components of the PCA (respectively PC1 and PC2) describe 85.74% of the total variability 331
among eels. PC1 and PC2 respectively represent 68.85 and 16.89%. This figure highlights 332
that the first principal component is positively correlated to all the individual PCB levels. The 333
second one is negatively correlated to low chlorinated PCBs and positively correlated to 334
highly chlorinated ones. 335
Each PCB congener is represented around the right part of the correlation circle. Nevertheless, 336
the repartition of the different PCBs seems to be due to their chemical structure, i.e. the 337
number and the position of Cl atoms. Low chlorinated PCBs with few Cl atoms in meta and 338
1 2 3 4 5 6 7 8 9 10 11 12 13 14 15 16 17 18 19 20 21 22 23 24 25 26 27 28 29 30 31 32 33 34 35 36 37 38 39 40 41 42 43 44 45 46 47 48 49 50 51 52 53 54 55 56 57 58 59 60 61
of Cl atoms in meta- and para- positions are important, the upper their localization is. Ndl-340
PCBs are considered as particularly persistent and present in the environment, representing 341
about 50% of all of the PCB congeners found in food from animal origin (AFSSA, 2006). 342
According to Fig.3A, they were well distributed around the right part of the correlation circle 343
and among all the other PCBs, emphasizing their qualitative representativeness of all the PCB 344
congeners (Cariou et al., 2010). 345
Fig.3B enhances this result showing the accumulation patterns of marker-PCBs in yellow eels 346
from the three sampling sites comparatively to those in the glass and silver eels. 347
Concerning the main congener #153, it contributes to an average of 42% of the contamination 348
of the yellow eels whatever the sampling site. This PCB is interesting because it is non 349
metabolizable and a tracer of bioaccumulation process. The percentages of this congener are 350
not significantly different for glass and silver eels compared to yellow eels from Varades but 351
they are lower than those found for yellow eels from Cordemais and Nantes. 352
Considering the sampling site influence, an inter-site variability is observed, particularly for 353
eels from Cordemais which display patterns with significantly lower relative proportion of 354
PCBs #28 and 118 whereas the relative proportion of #180 is significantly higher than those 355
of the other sites. About eels from Nantes, the relative proportion of the PCB #101 is 356
significantly higher to the detriment of the #180 with a relative proportion significantly lower. 357
Finally, the PCB #180 is the only one able to discriminate the sampling sites. Its proportion is 358
higher in Cordemais eels, lower in Nantes eels and intermediate in Varades eels. For the other 359
marker-PCBs (#153, 138 and 52), no significant specific trend is observed according to the 360
sampling site. 361
The PCB contamination variability between the three sampled sites could be partially 362
explained by the anthropogenic activities existing in the area. Indeed, Varades is a relatively 363
small city, marked by several agricultural activities where PCB sources are probably less 364
important than in Nantes or Cordemais. On the contrary, Nantes is an important urban and 365
industrial city, with an important economic and demographic development, where two 366
incinerator factories and various maritime and industrial activities exist. A lot of domestic, 367
industrial and agricultural effluents are discharged into the Loire estuary more or less 368
previously depolluted in sewage treatment plants. Cordemais presents another profile because 369
it is a very small rural city but dominated by its economic and industrial activities, directly 370
1 2 3 4 5 6 7 8 9 10 11 12 13 14 15 16 17 18 19 20 21 22 23 24 25 26 27 28 29 30 31 32 33 34 35 36 37 38 39 40 41 42 43 44 45 46 47 48 49 50 51 52 53 54 55 56 57 58 59
based on the presence of the Loire estuary such as a coal-fired power plant and close to an 371
industrial complex which includes oil refineries. 372
The PCB sources are therefore multiple along the estuary and the PCB contamination of this 373
ecosystem could be done following atmospheric or aquatic routes. This complexity prevents 374
from establishing easy correlations between the congener profiles and the sources. Motelay-375
Massei et al. (2004) showed, in the Seine river basin, that less chlorinated PCB congeners are 376
transported over longer distances from the source sites because of their longer residence time 377
in the atmosphere, whereas the heaviest PCBs tend to be adsorbed on particles and to settle 378
near production sources. Therefore, our results could suggest that eels from Cordemais were 379
living closer to a PCB source than eels from the other sites. 380
Moreover, the Loire estuary presents strong hydrodynamic, sedimentary and abiotic 381
parameters (Dauvin, 2008). Today, the effects of the tide can be observed within 97 km from 382
the estuary mouth and the salinity moves upstream. This modifies also the temperature from 383
the mouth of the estuary to the upstream front of the salinity which varies of 5°C from 384
downstream to upstream. The Loire estuary is also characterized by a fluid mud which 385
extends over 20 km; it is an important factor in the rapid sedimentation of the estuary, so the 386
turbidity varies from 2 g.L-1 at the surface to 20 g.L-1 near the bottom. All these parameters 387
(salinity, turbidity, temperature and tidal amplitude) could affect the exposition level of PCBs 388
potentially present in the estuary, and their chemical bioavailability for eels. Moreover, the 389
biological variability of eel PCB levels could also be explained by differences of diets, 390
ecology, physiology or metabolism capacities in relation to polyhaline, mesohaline and 391
oligohaline ecozones. 392
Regarding the difference of the relative proportions found for silver eels compared to yellow 393
eels, the only significant one is for PCB #28 which is higher in silver eels compared to yellow 394
eels whatever the sampling site considered. The patterns of silver eels are closer to those of 395
eels from Nantes, then Varades, whereas they display many significant differences 396
comparatively to those of eels from Cordemais: all the relative proportions are significantly 397
different except the one of PCB #138. 398
Finally, concerning the glass eels, a contrasting pattern is noticed, underlying a different 399
bioaccumulation phenomenon, characterized mainly by an important proportion of less 400
chlorinated PCBs to the detriment to the heaviest PCBs. This was already shown in a previous 401
1 2 3 4 5 6 7 8 9 10 11 12 13 14 15 16 17 18 19 20 21 22 23 24 25 26 27 28 29 30 31 32 33 34 35 36 37 38 39 40 41 42 43 44 45 46 47 48 49 50 51 52 53 54 55 56 57 58 59 60 61
accumulation pattern for glass eels sampled in the Gironde estuary. Comparatively, the 403
relative proportion of these congeners (without the PCB #50 not analyzed in this study) 404
represent 53% for glass eels in our study. The less chlorinated PCBs are transported over 405
longer distances from the PCB sources sites because of their longer residence time in the 406
atmosphere (Motelay-Massei et al., 2004). Moreover, in aquatic environments, these PCBs 407
that are more polar, are found to be dominant in dissolved phase and particulate organic 408
matter (Cailleaud et al., 2007). Glass eels come from the oceanic platform after the 409
metamorphosis of larvae leptocephali stage. These transparent larvaes move with currents 410
(pelagic comportment) for months, or years, in seawaters far from important pollution 411
sources. During their travel, the larvae were mainly contaminated by feeding uptake. When 412
they approach the continental shelf claim, the metamorphosis in glass eels occurs. They stop 413
then to feed and the contamination is then by direct exposure which leads to a pattern similar 414
to that of water column dominated by less chlorinated compounds. It is likely that the specific 415
PCB pattern of glass eels could be the result of these two phenomena. Another hypothesis is 416
the transfer of PCBs from adult eels to eggs and, consequently, to glass eels, low chlorinated 417
PCBs being more efficiently transferred than the heavy chlorinated ones (Bargar et al., 2001; 418
Verreault, 2006). 419
3.5 PCDD/F, PCB levels and public health 420
Mean PCDD/F and dl-PCB levels expressed according to the 2005 WHO recommendations 421
were 5.21 ± 1.78 and 9.88 ± 4.14 pg.g-1 WHO2005 PCDD/F and dl-PCB TEQ (toxic
422
equivalents) ww for yellow (n=5) and silver individuals (n=6) respectively. Glass eels 423
depicted a mean level significantly lower (0.27 ± 0.03 pg.g-1 WHO2005 PCDD/F and dl-PCB
424
TEQ ww). The maximum level established for the level of PCDD/Fs in eel filets is currently 425
3.5 pg.g-1 WHO2005 PCDD/F TEQ ww and 10 pg.g-1 WHO2005 PCDD/F and dl-PCB TEQ wet
426
weight (European Union, 2011). These values were not reached regarding the yellow eels. 427
Nevertheless, in the case of silver ones, biological variability was high and 4 out of 6 studied 428
eels displayed WHO2005 PCDD/F and dl-PCB TEQ values higher than 10 pg WHO2005
429
PCDD/F and dl-PCB TEQ per gram of wet filet. 430
Regarding the congeners # 28, 52, 101, 138, 153 and 180 (ndl-PCB), sampled eels did not 431
present levels superior than the 2005 WHO recommendation of 300 ng.g-1 ww. Silver eels and 432
yellow individuals from Nantes depicted the highest levels (mean of 204.6 ± 113.3 and 175.7 433
± 90.7 ng.g-1 ww, respectively), but few individuals (3/29) presented concentrations higher 434
1 2 3 4 5 6 7 8 9 10 11 12 13 14 15 16 17 18 19 20 21 22 23 24 25 26 27 28 29 30 31 32 33 34 35 36 37 38 39 40 41 42 43 44 45 46 47 48 49 50 51 52 53 54 55 56 57 58 59
than the recommended level (Table 1). Yellow individuals from Cordemais presented 435
intermediate levels (mean of 117.9 ± 47.7 ng.g-1 ww) and those from Varades the lowest ones 436
(mean of 75.5 ± 25.2 ng.g-1 ww). 437
Our results indicate a potential exposure to PCBs through eel consumption in this estuary, and 438
especially with silver ones. The French Food Safety Agency proposed a tolerable daily intake 439
(TDI) of 10 ng/ kg body weight/day (for the 6 ndl-PCB congeners), which represents 700 440
ng/day for a 70 kg person or 150 ng/day for a child of 15 kg (under 3 years) (French Food 441
Safety Agency, 2010). We could thus recommend to limit the consumption of eel from the 442
Loire estuary to one portion (150 g) per month for the general population, which represent an 443
average dietary daily intake of 694 ng/day. This is more restricted than the French Food 444
Safety Agency recommendations which limit the consumption of PCB bioaccumulating fish 445
to two portions per month for the general population. Specific recommendations (a portion of 446
60 g every two months) exist for the most sensitive populations (pregnant and breastfeeding 447
women, young and adolescent girls, women of childbearing age, and children under 3) and are 448
in agreement with our results, representing an average dietary daily intake of 139 ng/day. 449
A national study assessing the PCB impregnation of freshwater fish consumers performed on 450
six investigation sites including the Loire (French Food Safety Agency, 2011), revealed that 451
only 13% of participants (on a total of 606 amateur anglers and members of their households 452
and 16 professional anglers) are strong PCB-bioaccumulator freshwater fish consumers, with 453
a moderate consumption frequency of 1 time per month. Among the strong PCB-454
bioaccumulator freshwater fish species, eel is consumed with a mean annual frequency of 2.6 455
times per year. Considering these local practices and our results, a dietary daily intake of ndl-456
PCBs varying from 22 to 504 ng/day with a mean of 150 ng/day could be estimated. The TDI 457
value is not exceeded and the risk seems then to be moderate for an adult consumer but really 458
present for the most sensitive populations. 459
460
Conclusion 461
This study gives a first assessment of the PCB contamination of a European eel population 462
fraction from the Loire estuary, along a hundred-km long portion of ecosystem. The 463
quantitative and qualitative contents of PCBs in eel filets are different depending on their life 464
stage and the sampling sites. The eels sampled in the site next to Varades (small city under 465
1 2 3 4 5 6 7 8 9 10 11 12 13 14 15 16 17 18 19 20 21 22 23 24 25 26 27 28 29 30 31 32 33 34 35 36 37 38 39 40 41 42 43 44 45 46 47 48 49 50 51 52 53 54 55 56 57 58 59 60 61
agricultural pressure) appeared less contaminated than the two other sites, i.e. Nantes (an 466
important city) and Cordemais (a town hosting a coal-fired power station). Regarding the 467
PCB patterns, the sampled sites of Varades and Nantes could be associated to urban 468
influences whereas the one of Cordemais, more impacted by heavy chlorinated PCBs, would 469
be nearer from a PCB industrial source. Compared to other international or national areas, the 470
ndl-PCB levels in eels from Loire estuary show an intermediate contamination. Our results 471
indicate a potential exposure to PCBs through eel consumption, and especially with silver 472
ones. According to TDI value, the consumption must be limited to once per month for the 473
general population and to once every two month for the most sensitive ones. 474
Apart from an eventual sanitary problem, the contamination of eels could lead to damages for 475
the eel population by affecting their reproduction and by a transfer of pollutants to eggs. 476
Indeed, since these compounds are lipophilic, the results showed that the PCB levels are 477
correlated to the lipid content in the filets. Lipids are essential compounds for the migration 478
reproduction (van Ginneken et al., 2009) and for both fat deposition in the oocytes and later 479
incorporation of vitellogenic stores in eggs. Moreover, acclimation of eels to seawater, 480
silvering process and reproduction migration are under different endocrine controls and fuel 481
consuming. This energetic cost is described to increase significantly when lipid filets of 482
swimming eels are charged in PCB mixture (after intraperitoneally injection of 5000 ng g-1 483
PCB # 153, 7 ng g-1 PCB # 126 and 50 ng g-1 PCB # 77) (Thillart et al., 2009). PCB levels 484
determined in eels from the Loire estuary could thus potentially have an impact on the 485
reproduction success of European eels. 486
The comparison of eel biomonitoring studies highlighted heterogeneity in sampled 487
individuals. To better correlate studies at the international level, it appears necessary to 488
standardize parameters such as age, length, sex and sexual maturation stage. To preserve this 489
endangered species and such as recommended by scientists (van Ginneken et al., 2009), the 490
environmental quality of its habitats should be restored and protected. Considering our results, 491
the European eels from the Loire estuary appeared moderately contaminated compared to eels 492
from other major international estuaries, suggesting a moderate PCB contamination of the 493
Loire estuarine system. These conditions could contribute therefore to preserve genitors. 494
495
Acknowledgments 496
1 2 3 4 5 6 7 8 9 10 11 12 13 14 15 16 17 18 19 20 21 22 23 24 25 26 27 28 29 30 31 32 33 34 35 36 37 38 39 40 41 42 43 44 45 46 47 48 49 50 51 52 53 54 55 56 57 58 59
The authors want to express their special thanks to the region Pays de la Loire and the 497
AADPPMFEDLA (Association Agréée Départementale des Pêcheurs Professionnels 498
Maritimes et Fluviaux en Eau Douce de Loire-Atlantique) for their technical and financial 499 support. 500 501 References 502
AFSSA. Avis de l’Agence française de sécurité sanitaire des aliments relatif à l'établissement 503
de teneurs maximales pertinentes en polychlorobiphényles qui ne sont pas de type 504
dioxine (PCB « non dioxin-like », PCB-NDL) dans divers aliments In: N°2006-SA-505
0305 S, editor. AFSSA, 2006, pp. 28. 506
ANSES. http://www.anses.fr 2011. 507
Bargar TA, Scott GI, Cobb GP. Maternal transfer of contaminants: case study of the 508
excretion of three polychlorinated biphenyl congeners and technical-grade 509
endosulfan into eggs by white leghorn chickens (Gallus domesticus). . Environ. 510
Toxicol. Chem. 2001; 20: 61-67. 511
Belpaire C, Geeraerts C, Roosens L, Neels H, Covaci A. What can we learn from monitoring 512
PCBs in the European eel? A Belgian experience. Environ. Int. 2011; 37: 354-364. 513
Bordajandi LR, Gomez G, Fernandez MA, Abad E, Rivera J, Gonzalez MJ. Study on PCBs, 514
PCDD/Fs, organochlorine pesticides, heavy metals and arsenic content in freshwater 515
fish species from the River Turia (Spain) Chemosphere 2003; 53: 163-171. 516
Cailleaud K, Forget-Leray J, Souissi S, Lardy S, Augagneur S, Budzinski H. Seasonal 517
variation of hydrophobic organic contaminant concentrations in the water-column of 518
the Seine Estuary and their transfer to a planktonic species Eurytemora affinis 519
(Calanoïd, copepod). Part 2: Alkylphenol-polyethoxylates. Chemosphere 2007; 70: 520
281-287. 521
Canapa A, Barucca M, Celeste A, Olmo E, Regoli F. Preliminary investigations on 522
vitellogenin m-RNA induction in some bioindicator Mediterranean fish species. Mar. 523
Environ. Res. 2002; 54: 673-677. 524
Cariou R, Marchand P, Vénisseau A, Brosseaud A, Bertrand D, Qannari EM, et al. Prediction 525
of the PCDD/F and dl-PCB 2005-WHO-TEQ content based on the contribution of six 526
congeners: Toward a new screening approach for fish samples? Environ. Pollut. 2010; 527
158: 941-947. 528
1 2 3 4 5 6 7 8 9 10 11 12 13 14 15 16 17 18 19 20 21 22 23 24 25 26 27 28 29 30 31 32 33 34 35 36 37 38 39 40 41 42 43 44 45 46 47 48 49 50 51 52 53 54 55 56 57 58 59 60 61
Castonguay M, Hodson P, Moriarty C, Drinkwater K, Jessop B. Is there a role of ocean 529
environment in American and European eel decline? Fish Oceanogr. 1994; 3: 197-203. 530
Corsi I, Mariottini M, Badesso A, Caruso T, Borghesi N, Bonacci S, et al. Contamination and 531
sub-lethal toxicological effects of persistent organic pollutants in the European eel 532
(Anguilla anguilla) in the Orbetello lagoon (Tuscany, Italy). Hydrobiologia 2005; 550: 533
237-249. 534
Dauvin J-C. The main characteristics, problems, and prospects for Western European coastal 535
seas. Mar. Pollut. Bull. 2008; 57: 22-40. 536
Dekker W. Did lack of spawners cause the collapse of the European eel, Anguilla anguilla? 537
Fisheries Manag. Ecol. 2003; 10: 365-376. 538
Durif C, Dufour S, Elie P. The silvering process of Anguilla anguilla: a new classification 539
from the yellow resident to the silver migrating stage. J. Fish Biol. 2005; 66: 1025-540
1043. 541
Elie P, Lecomte-Finiger R, Cantrelle I, Charlon N. Définition des limites des différents stades 542
pigmentaires durant la phase civelle d'anguilles Anguilla sp.(poisson téléostéen 543
anguilliforme). Vie et Milieu 1982; 32: 149-157. 544
European Union CR. No 1259/2011 of 2 December 2011 amending Regulation (EC) N° 545
1881/2006 as regards maximum levels for dioxins, like PCBs and non dioxin-546
like PCBs in foodstuffs, 2011, pp. 18-23. 547
Feunteun E. Management and restoration of European eel population (Anguilla anguilla): An 548
impossible bargain. Ecol. Eng. 2002; 18: 575-591. 549
French Food Safety Agency. Opinion of the French Food Safety Agency on interpreting the 550
health impact of PCB concentration levels in the French population 2010, pp. 20. 551
French Food Safety Agency. Étude nationale d’imprégnation aux polychlorobiphényles des 552
consommateurs de poissons d’eau douce, 2011, pp. 176. 553
Fulton TW. The rate of growth of fishes. 22nd Annual Report of the Fishery Board of 554
Scotland. 1904, 3: 141-241. 555
Geeraerts C, Belpaire C. The effects of contaminants in European eel: a review. 556
Ecotoxicology 2010; 19: 239-266. 557
Geeraerts C, Focant JF, Eppe G, De Pauw E, Belpaire C. Reproduction of European eel 558
jeopardised by high levels of dioxins and dioxin-like PCBs? Sci. Tot. Environ. 2011; 559
409: 4039-4047. 560
Gravato C, Guimarães L, Santos J, Faria M, Alves A, Guilhermino L. Comparative study 561
about the effects of pollution on glass and yellow eels (Anguilla anguilla) from the 562
1 2 3 4 5 6 7 8 9 10 11 12 13 14 15 16 17 18 19 20 21 22 23 24 25 26 27 28 29 30 31 32 33 34 35 36 37 38 39 40 41 42 43 44 45 46 47 48 49 50 51 52 53 54 55 56 57 58 59
estuaries of Minho, Lima and Douro Rivers (NW Portugal). Ecotoxicol. Environ. Saf. 563
2010; 73: 524-533. 564
Grosbois C, Meybeck M, Lestel L, Lefèvre I, Moatar F. Severe and contrasted polymetallic 565
contamination patterns (1900-2009) in the Loire River sediments (France). Sci. Tot. 566
Environ. 2012; 435-436: 290-305. 567
Haenen OLM, Lehmann J, Engelsma MY, Stürenberg FJ, Roozenburg I, Kerkhoff S, et al. 568
The health status of European silver eels, Anguilla anguilla, in the Dutch River Rhine 569
Watershed and Lake IJsselmeer. Aquaculture 2010; 309: 15-24. 570
Hubaux N, Perceval O. Pollution des milieux aquatiques par les PCBs en France."PCB dans 571
les milieux aquatiques: enjeux de gestion et lacunes dans les connaissances". 572
ONEMA, 2011, pp. 52. 573
ICES ICftEotSac. annual congres. http://www.ices.dk 2006. 574
Kodavanti PRS, Curras-Collazo MC. Neuroendocrine actions of organohalogens: Thyroid 575
hormones, arginine vasopressin, and neuroplasticity. Front. Neuroendo. 2010; 31: 479-576
496. 577
Maes J, Belpaire C, Goemans G. Spatial variations and temporal trends between 1994 and 578
2005 in polychlorinated biphenyls, organochlorine pesticides and heavy metals in 579
European eel (Anguilla anguilla L.) in Flanders, Belgium. Environ. Pollut. 2008; 153: 580
223-237. 581
Marchand J, Quiniou L, Riso R, Thebaut M-T, Laroche J. Physiological cost of tolerance to 582
toxicants in the European flounder Platichthys flesus, along the French Atlantic Coast. 583
Aquat. Toxicol. 2004; 70: 327-343. 584
McHugh B, Poole R, Corcoran J, Anninou P, Boyle B, Joyce E, et al. The occurrence of 585
persistent chlorinated and brominated organic contaminants in the European eel 586
(Anguilla anguilla) in Irish waters. Chemosphere 2010; 79: 305-313. 587
Mezzetta S, Cirlini M, Ceron P, Tecleanu A, Caligiani A, Palla G, et al. Concentration of DL-588
PCBs in fish from market of Parma city (north Italy): Estimated human intake. 589
Chemosphere 2011; 82: 1293-1300. 590
Moriarty C, Dekker W. Management of the European Eel. Fisheries Bulletin 1997; 15: 110. 591
Motelay-Massei A, Ollivon D, Garban B, Teil MJ, Blanchard M, Chevreuil M. Distribution 592
and spatial trends of PAHs and PCBs in soils in the Seine River basin, France. 593
Chemosphere 2004; 55: 555-565. 594
1 2 3 4 5 6 7 8 9 10 11 12 13 14 15 16 17 18 19 20 21 22 23 24 25 26 27 28 29 30 31 32 33 34 35 36 37 38 39 40 41 42 43 44 45 46 47 48 49 50 51 52 53 54 55 56 57 58 59 60 61
Nunes M, Marchand P, Vénisseau A, Bizec BL, Ramos F, Pardal MA. PCDD/Fs and dioxin-595
like PCBs in sediment and biota from the Mondego estuary (Portugal). Chemosphere 596
2011; 83: 1345-1352. 597
Oliveira Ribeiro CA, Vollaire Y, Coulet E, Roche H. Bioaccumulation of polychlorinated 598
biphenyls in the eel (Anguilla anguilla) at the Camargue Nature Reserve - France. 599
Environ. Pollut. 2008; 153: 424-431. 600
ONEMA. Les données du plan national d'action PCB. 2012. 601
http://www.pollutions.eaufrance.fr/pcb/resultats-xls.html. 602
Palstra AP, Curiel D, Fekkes M, de Bakker M, Székely C, van Ginneken V, et al. Swimming 603
stimulates oocyte development in European eel. Aquaculture 2007a; 270: 321-332. 604
Palstra AP, Heppener DFM, van Ginneken VJT, Svakely C, van den Thillart GEEJM. 605
Swimming performance of silver eels is severely impaired by the swim-bladder 606
parasite Anguillicola crassus. J. Exp. Mar. Biol. Ecol. 2007b; 352: 244-256. 607
Palstra AP, van den Thillart GEEJM. Swimming physiology of European silver eels (Anguilla 608
anguilla L.): energetic costs and effects on sexual maturation and reproduction. Fish
609
Physiol. Biochem. 2011; 36: 297-322. 610
Perraudeau Y, Després L. L'estuaire de la Loire: un territoire en développement durable? 611
Rennes: Presses Universitaires de Rennes; 2009. 612
Robinet TT, Feunteun EE. Sublethal Effects of Exposure to Chemical Compounds: A Cause 613
for the Decline in Atlantic Eels? Ecotoxicology 2002; 11: 265-277. 614
Roche H, Buet A, Jonot O, Ramade F. Organochlorine residues in european eel (Anguilla 615
anguilla), crucian carp (Carassius carassius) and catfish (Ictalurus nebulosus) from 616
Vaccarès lagoon (French National Nature Reserve of Camargue) - effects on some 617
physiological parameters. Aquat. Toxicol. 2000; 48: 443-459. 618
Roosens L, Geeraerts C, Belpaire C, Van Pelt I, Neels H, Covaci A. Spatial variations in the 619
levels and isomeric patterns of PBDEs and HBCDs in the European eel in Flanders. 620
Environ. Int. 2010; 36: 415-423. 621
Santillo D, Johnston P, Labunska I, Brigden K. Swimming in Chemicals Widespread. 622
Presence of Brominated Flame Retardants and PCBs in eels (Anguilla anguilla) 623
from Rivers and Lakes in 10 European Countries. In: Note T, editor. 12. Greenpeace 624
International; 2005, pp. 56. 625
Tapie N, Le Menach K, Pasquaud S, Elie P, Devier MH, Budzinski H. PBDE and PCB 626
contamination of eels from the Gironde estuary: From glass eels to silver eels. 627
Chemosphere 2011; 83: 175-185. 628
1 2 3 4 5 6 7 8 9 10 11 12 13 14 15 16 17 18 19 20 21 22 23 24 25 26 27 28 29 30 31 32 33 34 35 36 37 38 39 40 41 42 43 44 45 46 47 48 49 50 51 52 53 54 55 56 57 58 59
Thillart G, Dufour S, Rankin JC, Palstra A. Artificial Maturation and Reproduction of the 629
European Eel. Spawning Migration of the European Eel. Springer Netherlands; 2009. 630
Tulonen J, Vuorinen PJ. Concentrations of PCBs and other organochlorine compounds in eels 631
(Anguilla anguilla, L.) of the Vanajavesi watercourse in southern Finland, 1990-1993. 632
Sci. Tot. Environ. 1996; 187: 11-18. 633
van den Berg M, Birnbaum LS, Denison M, De Vito M, Farland W, Feeley M, et al. The 2005 634
World Health Organization Re-evaluation of Human and Mammalian Toxic 635
Equivalency Factors for Dioxins and Dioxin-like Compounds Toxicol. Sci. 2006; 93: 636
223-241. 637
van der Oost R, Opperhuizen A, Satumalay K, Heida H, Vermeulen NPE. Biomonitoring 638
aquatic pollution with feral eel (Anguilla anguilla) I. Bioaccumulation: biota-sediment 639
ratios of PCBs, OCPs, PCDDs and PCDFs. Aquat. Toxicol. 1996; 35: 21-46. 640
van Ginneken V, Palstra A, Leonards P, Nieveen M, van den Berg H, Flik G, et al. PCBs and 641
the energy cost of migration in the European eel (Anguilla anguilla L.). Aquat. 642
Toxicol. 2009; 92: 213-220. 643
Verreault J, Villa, R.A., Gabrielsen, G.W., Skaare, J.U., Letcher, R.J. Maternal transfer of 644
organohalogen contaminants and metabolites to eggs of arctic-breeding glaucous 645
gulls. Environ. Pollut. 2006; 144: 1053-1060. 646
Voltura MB, French JB. Effects of dietary polychlorinated biphenyl exposure on energetics of 647
white-footed mouse, Peromyscus leucopus. Environ. Toxicol. Chem. 2000; 19: 2757-648 2761. 649 650 651 652
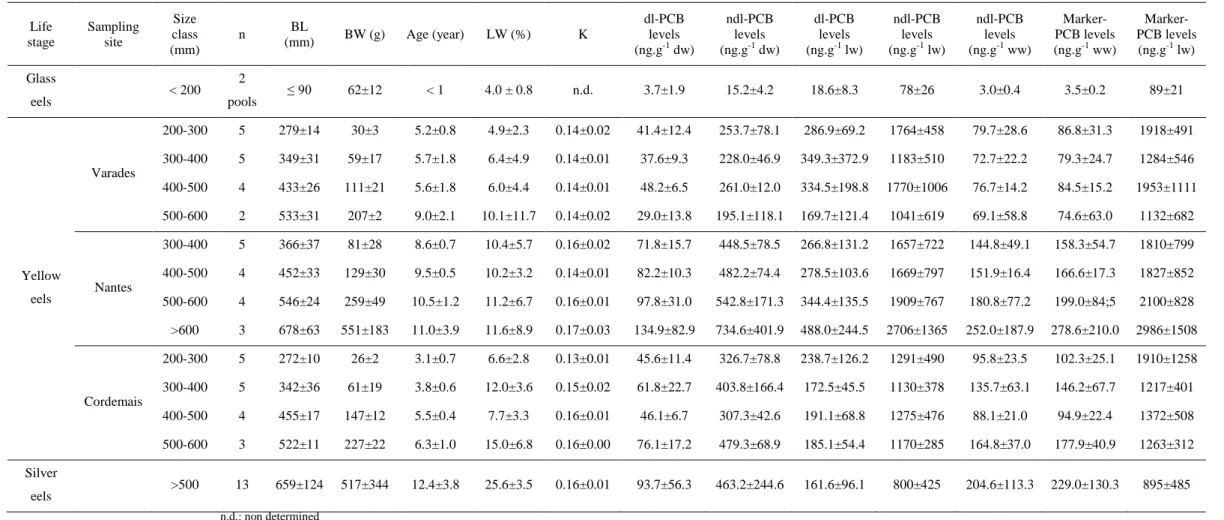
Table 1: Means and standard deviations of PCB levels (dl, ndl and marker) and biometric parameters (Body Length BL, Body Weight BW, Lipid
Weight LW), Fulton’s condition factor (K) and age of sampled European eels (n = 62) from the three studied sites in the Loire estuary according to life stage and size classes.
Life stage Sampling site Size class (mm) n BL (mm) BW (g) Age (year) LW (%) K dl-PCB levels (ng.g-1 dw) ndl-PCB levels (ng.g-1 dw) dl-PCB levels (ng.g-1 lw) ndl-PCB levels (ng.g-1 lw) ndl-PCB levels (ng.g-1 ww) Marker-PCB levels (ng.g-1 ww) Marker-PCB levels (ng.g-1 lw) Glass eels < 200 2 pools ≤ 90 62±12 < 1 4.0 ± 0.8 n.d. 3.7±1.9 15.2±4.2 18.6±8.3 78±26 3.0±0.4 3.5±0.2 89±21 Yellow eels Varades 200-300 5 279±14 30±3 5.2±0.8 4.9±2.3 0.14±0.02 41.4±12.4 253.7±78.1 286.9±69.2 1764±458 79.7±28.6 86.8±31.3 1918±491 300-400 5 349±31 59±17 5.7±1.8 6.4±4.9 0.14±0.01 37.6±9.3 228.0±46.9 349.3±372.9 1183±510 72.7±22.2 79.3±24.7 1284±546 400-500 4 433±26 111±21 5.6±1.8 6.0±4.4 0.14±0.01 48.2±6.5 261.0±12.0 334.5±198.8 1770±1006 76.7±14.2 84.5±15.2 1953±1111 500-600 2 533±31 207±2 9.0±2.1 10.1±11.7 0.14±0.02 29.0±13.8 195.1±118.1 169.7±121.4 1041±619 69.1±58.8 74.6±63.0 1132±682 Nantes 300-400 5 366±37 81±28 8.6±0.7 10.4±5.7 0.16±0.02 71.8±15.7 448.5±78.5 266.8±131.2 1657±722 144.8±49.1 158.3±54.7 1810±799 400-500 4 452±33 129±30 9.5±0.5 10.2±3.2 0.14±0.01 82.2±10.3 482.2±74.4 278.5±103.6 1669±797 151.9±16.4 166.6±17.3 1827±852 500-600 4 546±24 259±49 10.5±1.2 11.2±6.7 0.16±0.01 97.8±31.0 542.8±171.3 344.4±135.5 1909±767 180.8±77.2 199.0±84;5 2100±828 >600 3 678±63 551±183 11.0±3.9 11.6±8.9 0.17±0.03 134.9±82.9 734.6±401.9 488.0±244.5 2706±1365 252.0±187.9 278.6±210.0 2986±1508 Cordemais 200-300 5 272±10 26±2 3.1±0.7 6.6±2.8 0.13±0.01 45.6±11.4 326.7±78.8 238.7±126.2 1291±490 95.8±23.5 102.3±25.1 1910±1258 300-400 5 342±36 61±19 3.8±0.6 12.0±3.6 0.15±0.02 61.8±22.7 403.8±166.4 172.5±45.5 1130±378 135.7±63.1 146.2±67.7 1217±401 400-500 4 455±17 147±12 5.5±0.4 7.7±3.3 0.16±0.01 46.1±6.7 307.3±42.6 191.1±68.8 1275±476 88.1±21.0 94.9±22.4 1372±508 500-600 3 522±11 227±22 6.3±1.0 15.0±6.8 0.16±0.00 76.1±17.2 479.3±68.9 185.1±54.4 1170±285 164.8±37.0 177.9±40.9 1263±312 Silver eels >500 13 659±124 517±344 12.4±3.8 25.6±3.5 0.16±0.01 93.7±56.3 463.2±244.6 161.6±96.1 800±425 204.6±113.3 229.0±130.3 895±485 n.d.: non determined
Figure 1: Studied area: the Loire estuary (France). Three sampling locations (Cordemais; Nantes and Varades)
Figure 2: Principal Component Analysis of biometric parameters and dl- and ndl-PCB levels expressed in ng.g-1 dw in muscles of yellow eels from 3 sampling sites (n = 49): Varades, Nantes and Cordemais.
A: correlation loadings (BW: body weight; BL: body length; LW: lipid weight);
B: sample representation (circles = eels from Varades; triangles = eels from Nantes; squares = eels from Cordemais).
Figure 3: Representation of PCB patterns.
A: correlation loadings of Principal Component Analysis of dl and ndl-PCB muscle levels expressed in ng.g-1 dw in yellow eels from 3 sampling sites (n = 49): Varades, Nantes and Cordemais (dl-PCBs: black circles; ndl-PCBs: white circles);
B: Relative proportion (in %) of marker-PCBs in eel filets according to the life stage and the sampling site.
Figure 1 10 km Varades Nantes Cordemais Loire estuary N
Figure 2 BW BL Age LW dl-PCBs ndl-PCBs -1 -0.75 -0.5 -0.25 0 0.25 0.5 0.75 1 -1 -0.75 -0.5 -0.25 0 0.25 0.5 0.75 1 PC2 (20, 32 % ) PC1 (62,65 %) Variables (axes PC1 et PC2 : 82,97 %) -5 -4 -3 -2 -1 0 1 2 3 -3 -2 -1 0 1 2 3 4 5 6 7 8 PC2 (20, 32 % ) PC1 (62,65 %) Observations (axes PC1 et PC2 : 82,97 %) A
B
A
0 5 10 15 20 25 30 35 40 45 50
glass eels Varades yellow eels Nantes yellow eels Cordemais yellow eels Silver eels R e lativ e p ro p o rtion o f m ar ke r-PCB s 28 52 101 118 138 153 180 Figure 3 77 81 126 169 105 114 118 123 156 157 167 189 28 52 101 138 153 180 -1 -0.75 -0.5 -0.25 0 0.25 0.5 0.75 1 -1 -0.75 -0.5 -0.25 0 0.25 0.5 0.75 1 F2 (16, 89 % ) F1 (68,85 %) Variables (axes F1 et F2 : 85,74 %) A
B
A
AUTHOR DECLARATION
We wish to confirm that there are no known conflicts of interest associated with this publication entitled " Dioxin-like, non-dioxin like PCB and PCDD/F contamination in European eel (Anguilla anguilla) from the Loire estuarine continuum: spatial and biological variabilities" and there has been no significant financial support for this work that could have influenced its outcome.
We confirm that the manuscript has been read and approved by all named authors and that there are no other persons who satisfied the criteria for authorship but are not listed. We further confirm that the order of authors listed in the manuscript has been approved by all of us.
We confirm that we have given due consideration to the protection of intellectual property associated with this work and that there are no impediments to publication, including the timing of publication, with respect to intellectual property. In so doing we confirm that we have followed the regulations of our institutions concerning intellectual property.
We further confirm that any aspect of the work covered in this manuscript that has involved experimental animals has been conducted with the ethical approval of all relevant bodies and that such approvals are acknowledged within the manuscript.
We understand that the Corresponding Author is the sole contact for the Editorial process (including Editorial Manager and direct communications with the office). She is responsible for communicating with the other authors about progress, submissions of revisions and final approval of proofs.
We confirm that we have provided a current, correct email address which is accessible by the Corresponding Author and which has been configured to accept email from (isabelle.blanchet-letrouve@ac-nantes.fr). Signed by all authors as follows:
Author name Date Signature
I. Blanchet-Letrouvé 27/06/2013 A. Zalouk-Vergnoux 09/07/2013 A. Vénisseau 11/07/2013 M. Couderc 09/07/2013 B. Le Bizec 1st July 2013 P. Elie 27/06/2013 C. Herrenknecht 10/07/2013 C. Mouneyrac 27/06/2013 L. Poirier 27/06/2013