HAL Id: hal-00862459
https://hal-univ-rennes1.archives-ouvertes.fr/hal-00862459
Submitted on 16 Sep 2013HAL is a multi-disciplinary open access archive for the deposit and dissemination of sci-entific research documents, whether they are pub-lished or not. The documents may come from teaching and research institutions in France or abroad, or from public or private research centers.
L’archive ouverte pluridisciplinaire HAL, est destinée au dépôt et à la diffusion de documents scientifiques de niveau recherche, publiés ou non, émanant des établissements d’enseignement et de recherche français ou étrangers, des laboratoires publics ou privés.
Adsorption of small organic solutes from beet distillery
condensates on reverse-osmosis membranes:
Consequences on the process performances
Claire Fargues, Camille Sagne, Anthony Szymczyk, Patrick Fievet,
Marie-Laure Lameloise
To cite this version:
Claire Fargues, Camille Sagne, Anthony Szymczyk, Patrick Fievet, Marie-Laure Lameloise. Adsorp-tion of small organic solutes from beet distillery condensates on reverse-osmosis membranes: Conse-quences on the process performances. Journal of Membrane Science, Elsevier, 2013, 446, pp.132-144. �10.1016/j.memsci.2013.06.051�. �hal-00862459�
Adsorption of small organic solutes from beet distillery condensates on reverse-osmosis membranes: consequences on the process performances
Claire FARGUES*1, 2, Camille SAGNE1, 2, Anthony SZYMCZYK3, Patrick FIEVET4, Marie-Laure
LAMELOISE1, 2
1
AgroParisTech, UMR 1145 Ingénierie Procédés Aliments, 1 av des Olympiades, F-91300 Massy, France
2
INRA, UMR 1145 Ingénierie Procédés Aliments, 1 av des Olympiades, F-91300 Massy, France 3
Université de Rennes 1, Institut des Sciences Chimiques de Rennes - UMR 6226 CNRS, 263 av du général Leclerc, 35042 Rennes Cedex, France
4
Institut UTINAM, UMR CNRS 6213, Université de Franche-Comté, 16 route de Gray, 25030 Besançon Cedex, France
Corresponding author: Claire FARGUES, AgroParisTech, UMR 1145 Ingénierie Procédés Aliments, 1 av des Olympiades, F-91300 Massy, France.
Phone: +33 (0)1 69 93 50 95. Fax: +33 (0)1 69 93 50 44. E-mail: claire.fargues@agroparistech.fr
Abstract
Reverse osmosis (RO) is an attractive process for the detoxification of distillery condensates before their recycling at the fermentation stage. However, transfer mechanisms through dense NF and RO membranes are still not well understood for the organic solutes to eliminate, and rejection results could be disappointing. This study aims at correlating the membrane and solute characteristics (polarity, surface charge, molecular weight…) to the transfer results and further to the process performances. This was achieved through the study of the sorption isotherms of five target inhibitory compounds (acetic and butanoic acids, furfural, 2-phenethyl alcohol and 2,3-butanediol) on three commercial RO membranes (ESPA2, CPA2 and BW30), the compounds being alone as well as mixed in order to evaluate the competition effects. Results reveal that acetic acid and 2,3-butanediol develop few interactions with the membrane material while furfural and 2-phenethyl alcohol present strong sorption of Langmuir type. Extended Langmuir equation succeeded in accounting for the solutes’ sorption in mixtures insofar as acetic acid is not considered as competitor since it follows a different transfer mechanism. Coupled with their molecular weight (MW), low rejections obtained for acetic acid and furfural at pilot-scale as well as high rejection results for 2,3-butanediol and 2-phenylethanol could be explained.
Keywords: reverse osmosis, organic solute, sorption, extended Langmuir, interaction mechanisms
1. Introduction
With a growing concern for water resources, water treatment and reuse is becoming a major challenge for a lot of industries. Membrane processes such as nanofiltration (NF) and reverse osmosis (RO) are admitted to be cost-effective and efficient for the separation or removal of small organic molecules in various industry fields such as textile [1, 2], pharmaceutical [3], tannery [4], paper [5] or biomass refinery [6, 7].
In beet distilleries, stillage is co-produced with ethanol at the distillation stage. Its concentration by evaporation before land-spreading leads to the production of important quantities of condensates. This wastewater containing low concentration of organic pollutants could be wisely reused as dilution water into the fermentation step, provided that fermentation inhibitors had been previously eliminated. Five molecules have to be followed in priority because of their high concentrations in raw condensates and/or their high inhibiting activity: acetic and butanoic acids, furfural, 2-phenethyl alcohol and 2,3-butanediol [8]. These compounds are commonly encountered in intermediate stages of bioresource processing. Reverse osmosis was shown to be an interesting process within this context [9, 10]. However, transfer mechanisms through those dense membranes are not well characterized for organic molecules: membrane permeability to the solute may be dependent on its concentration in solution due to non-linear interactions occurring between the solute and the membrane and influencing the rejection results [11-14]. In these conditions and in industrial contexts where multi-stage RO devices are used and great concentration effects obtained, it would be wrong to use the widely applied solution-diffusion model with constant membrane permeability to predict the overall treatment performances.
In order to take these phenomena into account in the context of the beet distillery effluents, we chose to follow a modified Solution-Diffusion model as described in [13, 14]. Adsorptions were therefore quantified through batch isotherm experiments for the target solutes selected, on three different membranes of “brackish water” type, adapted to the low salinity of the effluent to treat. Measurements were done for single-solute solutions of increasing concentrations in each of the inhibitory compounds, as well as for synthetic mixtures and for a real industrial condensate in order to evaluate the competition effects. Study of characteristics of the membrane surfaces (hydrophobicity, charge) helped understanding the differences of affinity obtained. Eventually, rejections obtained at pilot-scale were measured and analyzed facing the interaction parameters observed.
2. Experimental
2.1 Membranes and effluents
Membranes studied were of “brackish water” type with an active layer made in cross-linked aromatic polyamide (PA). CPA2 (standard) and ESPA2 (low energy) from HYDRANAUTICS (Nitto Denko Group) and BW30 (standard) from DOW FILMTEC (Dow Chemical Company) were chosen because of their ability to treat distillery condensates [10]. Their characteristics are collected in Table 1.
Behavior of five main solutes in the industrial effluent were more specifically investigated: acetic and butanoic acids, furfural, 2-phenethyl alcohol and 2,3-butanediol. Their main properties are summarized in Table 2. For the isotherm sorption measurements as well as for pilot-plant experiments, different solutions were tested: single-solute solutions, an industrial condensate (IC) and a model condensate (MC) containing the five main solutes with the same proportions as those in the industrial condensate (Table 2). pH of the condensates as well as those of the single-acid solutions was about 3.5, whereas it was about 7 for single-solute solutions of neutral compounds (furfural, 2-phenethyl alcohol and 2,3-butanediol). For CPA2 membrane, equimolar mixtures of the five solutes were also studied. Its concentration was 1 mol m-3 in each solute for the pilot-plant run.
2.2. Analytical methods
Target compounds were quantified by HPLC and GC. The analyses of acetic and butanoic acids, furfural and 2-phenethyl alcohol were performed with the HPLC system, composed of a 321 pump (Gilson, Roissy, France), a Degasys DG-1310 degassing system (Uniflow, Tokyo, Japan), a Biotek Kontron Instruments 465 automatic autosampler (Gilson, Roissy, France) and a Waters 996 photodiode array detector (Guyancourt, France) operating at 207 nm except for furfural where it was set at 277 nm for the most diluted samples. Data were acquired and processed by Empower software (Waters, Guyancourt, France). A high density C18 column, BetaMax Neutral was used (150 mm x 4.6 mm i.d., 5 µm particle size; Thermo-Electron Corporation, Courtaboeuf, France), heated at 50°C (± 0.8 °C) by an Igloo-cil oven (Cluzeau Info Labo, Courbevoie, France). The mobile phases for the elution gradient were (A) H2SO4 5 x 10⁻⁴ mol L-1 aqueous solution and (B) acetonitrile. Mobile phase A was filtered and B sonicated prior to use. Flow rate was 1 mL min-1. The optimized gradient consists in an increase of B from 5% to 40% in 10 min; after a 5 min plate it is returned to 5% B in 1 min and kept constant 5 min more.
The concentration of 2,3-butanediol was obtained by gas chromatography (GC) using a HP5890 system equipped with a Siltek deactivated insert (Restek, Lisses, France) and a flame ionization detector. The temperature of the RTX200 capillary column (30 m x 0.25 mm ID, film thickness 0.25 µm, Restek, Lisses, France) was set at 90°C and that of the injector and detector at 250°C. The gas carrier was helium at 150 kPa. Split injection mode was used (split flow rate = 40 mL min-1) with injection volume of 0.5 µ L. Each sample run lasted 5.5 min.
2.3. Pilot-scale reverse osmosis experiments
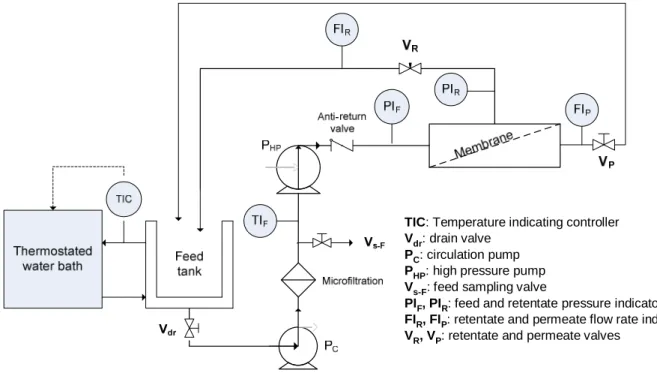
As described by Sagne [16] experiments were run on a 2540 spiral-wound RO pilot (2.6 m2 of membrane surface area) from Polymem (France) (Fig. 1). The feed tank was of stainless steel as well as much of the different parts of the pilot to avoid artifact sorption. Each experiment was preceded by a cleaning step with KOH at 0.4 g L-1 followed by rinsing with de-ionized water.
Experiments were performed in the recycling mode, where both permeate and retentate were returned to the feed tank. Temperature was set at 20°C and retentate flow rate at about 400 L h-1. Experiments were run at five transmembrane pressures (TMP: 5; 10; 15; 20 and 30 bar). The volume of feed solution was 10 L. For each condition, retentate and permeate samples were taken after a 30 min stabilization period and further analyzed.
In order to quantify the process performances, rejection of solute i Ri was calculated taking account of the average composition of the retentate CRave,i, and the permeate concentration CP,i.
Assuming a solution-diffusion mechanism for water, permeate flux Jp is proportional to the effective transmembrane pressure (TMPeff) and the membrane permeability to water, A, can be calculated. For the synthetic solutions (single-solute solutions and model condensate) with a well-known composition and total concentration lower than 25 mol m-3, the differential osmotic pressure between average retentate and permeate (∆Π) was estimated by the Van't Hoff relation:
T R C n i i1 2 3 4 5 6 = Π
7
=1 (Pa) (1)Concerning solute flux Js the standard solution-diffusion model assumes a partition of the solute between solution and membrane, quantified by a constant coefficient K1,i. The sorbed solute
then diffuses through the membrane according to its diffusivity Di (m2 s-1) and its concentration gradient from one side to the other of the membrane. The following expression arises for solute i:
(
Ri Pi) (
i Ri Pi)
i i i s C C B C C K D J , = , , − , = , − ,δ
1 (mol m-2 s-1) (2)Rejection can be related to permeate flux through the following equation: p i i J B R 1 1 1 + = (3)
The relation between 1/Ri and 1/Jp, which is linear in the case of a constant permeability of the membrane to the solute (Bi = constant) is not linear anymore when specific interactions occur between solute and membrane material.
Fig. 1. Scheme of the spiral-wound RO pilot from Polymem - Recycling mode.
2.4. Sorption isotherm experiments
Equilibrium sorption properties were studied through batch experiments. A volume V = 100 mL of the solution at initial concentration C0,i in solute i was added to a 250 mL flask containing S = 260 cm2 of membrane cut into pieces (about 2 x 2 cm²). The volume-to-membrane surface ratio was therefore the same as for RO experiments in recycling mode. The initial solute concentrations were set in such a way that, after adsorption, the equilibrium concentrations lie in a range relevant to the concentrations of the industrial condensate. More concentrated solutions were also tested so as to appreciate the evolution of the quantity sorbed when the retentate goes concentrating along the treatment process, as it is the case for high volume reduction ratio runs at the industrial scale. The initial concentrations investigated for single-solute tests were in the following ranges: 0.4 < C0,aa < 18 mol m-3; 0.2 < C0,ba < 12 mol m-3; 0.2 < C0, f < 10 mol m-3; 0.1 < C0,phol < 9 mol m-3; 0.05 < C0,bdiol < 8 mol m-3. For experiments with the model condensate, C0,i
TIC: Temperature indicating controller Vdr: drain valve
PC: circulation pump PHP: high pressure pump Vs-F: feed sampling valve
PIF, PIR: feed and retentate pressure indicators FIR, FIP: retentate and permeate flow rate indicators
ranged from one tenth to ten times the average composition of the industrial condensate. For the industrial condensate, solutions of various C0,i levels were obtained by concentration of the effluent using the RO pilot equipped with the membrane under study. Therefore five volume reduction ratios (VRR) were run: 1, 1.33, 2, 4 and 8, and the corresponding retentates were used as initial solutions to put into contact with the membranes. For CPA2 membrane, an additional sorption isotherm was run with synthetic mixtures containing the five main solutes in equimolar proportion (equimolar mixture).
The sheets of membrane were previously cleaned in a KOH 0.4 g L-1 bath for one hour and next rinsed in two water baths for one hour in each. Increasing concentrations of the solution under study were tested in separate flasks. The flasks were let to equilibrate 24 h at 20 °C and 140 rpm on a shaking table. Next, samples of the solutions were taken for measurement of the equilibrium concentration in solute i (Ceq,i). A preliminary kinetic study had shown that at least 95% of the adsorbed quantity Qi was obtained after 24 h contact for all the compounds, except for 2-phenethyl alcohol for which about 85% was reached.
For each flask, HPLC and GC analyses of the samples allowed the determination of the sorbed quantity Qi (mol m-2) of solute i on the membrane in equilibrium with Ceq,i (mol m-3), according to a mass balance:
(
0,i eq i,)
i C C V Q S − = (mol m-2) (4)The variation of Qi with Ceq,i was fitted by either linear adsorption isotherm or Langmuir-type adsorption isotherm: Linear: Qi =K C1,i eq i, (5) Langmuir: max, , , , , 1 i s i eq i i s i eq i Q K C Q K C = + (6)
where K1,i (m) is the partition coefficient for the linear relationship. Qmax,i (mol m-2), the maximal sorbed quantity and Ks,i, the Langmuir equilibrium constant (m3 mol-1) can be optimized using a multidimensional unconstrained nonlinear minimization method based on a simplex algorithm (Nelder-Mead).
For mixtures, the extended Langmuir model based on the mechanism of direct competition of solutes for the adsorption sites was tested. Adsorption of the solute i in a mixture of n solutes was then evaluated by:
j eq, j s, i eq, i s, i max, C K 1 C K Q Q n i,
7
= + = n 1 j (7)with Qmax,j and Ks,j the model parameters obtained for each of the n solutes separately by Langmuir
modeling (Eq. 6) and Ceq, j their concentration at the equilibrium in the mixture.
2.5. Membrane characterization
2.5.1. Contact angle measurements
Contact angles were measured for each membrane by the sessile drop technique using 1
-bromonaphtalene as apolar compound and formamide and water as polar ones. Moreover, formamide presents a basic character. Before measurements, membranes were washed with a 0.4 g
L-1 KCl solution and rinsed with deionized water. They were then conditioned by immersion in the
studying solution. Three solutions were studied: water in order to characterize fresh membranes and synthetic and industrial condensates to assess solute/membrane interaction. The membrane samples obtained were then dried with sterile air.
A 0.5 µ L droplet of pure liquid was placed on the membrane with a syringe and contact angle was measured with a goniometer (G40, Krüss) and averaged for 6 - 7 droplets for each membrane sample and liquid tested.
2.5.2. Zeta potential measurements
Tangential streaming potential measurements were performed for each membrane with a ZETACAD zeta-meter (CAD Inst., France) following a procedure described by Fievet et al. [17]. This apparatus measures the electrical potential difference generated by the imposed movement of an electrolyte solution through a thin slit channel formed by a couple of identical membranes. The liquid is forced through the slit channel of well-defined dimensions using nitrogen gas. The
electrical potential difference (23s) is measured alternatively for continuously increasing pressures
values (from 0 to 500 mbar). The streaming potential coefficient 1
2 3 4 5 6 ∆ ∆ P s
ϕ
is obtained from the slope
of the plot of 23s versus 2P. For the studying membranes preliminary experiments performed at
different channel heights (between 60 µm and 450 µm) showed no dependency of the streaming
potential coefficient with the height. This result means that the porous support did not contribute to the cell electric conductance and the streaming current [18]. In this case, the classical
Helmholtz-Smoluchowski equation is applicable to determine
ζ
, the zeta-potential of the membrane surface:0 0 0
µλ
ζ
ε
ε
ϕ
r I s P 12 = 3 4 5 6 ∆ ∆ = (8) whereε
0 is the vacuum permittivity,ε
r the relative dielectric constant of the solvent, λ0 theMeasurements were made in 10-3 M KCl solution at 20 °C for a single channel height. pH was adjusted with hydrochloric acid or potassium hydroxide to cover a range from 3 to 10 and the equilibration process was monitored experimentally via the time dependency of the streaming potential.
3. Results and discussion
3.1. Membrane characterization
The top (active) layer of the commercial RO thin-film composite membranes studied in the present work consists of cross-linked fully aromatic polyamide obtained from interfacial polymerization of 1,3-benzenediamine (or m-phenylenediamine (MPD)) and trimesoyl chloride (TMC) on the polysulfone microporous sub layer (Fig. 2) [19]. ESPA2 and CPA2 membranes are known to be uncoated ones whereas BW30 membrane presents an additional n-alkyl alcohols coating layer [20, 21]. Due to their composition, uncoated membranes can be positive at acidic pH
because of the ionization of the free amine groups at their surface into – NH3+, due to terminal MPD
residues not involved in the cross-link. When pH rises, they become negative because of the
neutralization of these groups and the dissociation of free carboxylic groups of TMC into – COO-.
Results from the streaming potential and contact angle measurements made on the surface of the three fresh membranes are given in Fig. 3 and Table 3, respectively. ESPA2 membrane appears positively charged at pH smaller than 5 when CPA2 is negative or neutral. As already noticed by Tang et al. [22] for the ESPA3 generation, this difference could be explained by a higher cross-linked structure for ESPA2 as compared to CPA2. Actually, cross-linking by MPD decreases the number of free – COOH groups and potentially increases the number of amine groups if not completely involved in the cross-link. Both phenomena could be responsible for the shift of the isoelectric point (IEP) towards more basic values with IEP = 5.1 for ESPA2 against IEP = 3.2 for CPA2 membrane. IEP of BW30 (3.5) is close to CPA2 one but BW30 membrane acquires a more negative charge at high pH.
Fig. 2. Cross-linked aromatic polyamide composition (MPD = 1,3-benzenediamine; TMC = trimesoyl chloride). R2 = 0.9973 R2 = 0.978 R2 = 0.945 -40 -30 -20 -10 0 10 20 2 3 4 5 6 7 8 9 10 pH ζζζζ ( m V ) BW30 CPA2 ESPA2
Fig. 3. 3-potential measurements performed in 10-3 M KCl for ESPA2, CPA2 and BW30 fresh membranes.
The contact angle measurements with water show that CPA2 membrane is the most hydrophilic,
followed by BW30 and ESPA2 (Table 3). Formamide and 1-bromonaphtalene totally spread on the
Hydranautics membranes due to strong interactions with polyamide material, indicating that CPA2 MPD TMC MPD Cross-link MPD residue TMC residue MPD TMC MPD Cross-link MPD residue TMC residue
and ESPA2 membrane surfaces are mainly apolar and acid. With its two phenyl rings, 1
-bromonaphtalene would interact through 4-4 forces with the aromatic rings of the aromatic
polyamide while formamide would develop Lewis acid-base interactions with the free carboxylic groups of the membrane surface. The more hydrophilic character of the CPA2 membrane is
consistent with the 3-potential results. According to its contact angle with formamide, BW30
membrane seems less acid than the other two membranes. In order to evaluate changes of surface properties due to interactions with the organic solutes, measurements were made with membranes previously equilibrated with the model and the industrial condensates. Formamide then totally spread on the CPA2 and ESPA2 membranes showing an increase of the acid behaviour of the surface due to interactions with the carboxylic acids in solution. CPA2 surface appears less hydrophilic when put into contact with the industrial condensate. Its neutral charge at the pH of the condensate could favour the interactions with additional hydrophobic compounds contained in this more complex mixture. Such modifications are less obvious in the case of the BW30 with contradictory results for the contact angle measurements between model and industrial condensates.
3.2. Sorption isotherms of the solutes
3.2.1. Single-solute solutions
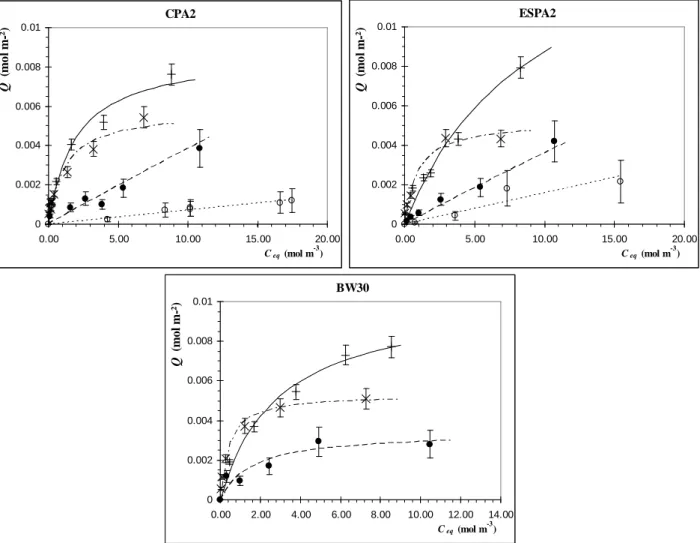
Sorption isotherms obtained with single-solute solutions on the three membranes are shown in Fig. 4. Furfural always displays the highest sorption with for example ~8 x 10⁻³ mol m-2 of membrane for a 10 mol m-3 solution, followed by 2-phenethyl alcohol (~4-5 x 10⁻³ mol m-2) and
butanoic acid (~3 10-3 mol m-2). Acetic acid sorption is very low (~0.5-1 x 10⁻³ mol m-2 for a 10 mol
m-3 solution) whereas 2,3-butanediol does not interact at all with the membranes: its concentration
in solution does not evolve.
With resolution coefficients close to 0.95, Langmuir equation correctly represents the sorption isotherms for furfural, 2-phenethyl alcohol and butanoic acid (Table 4). Concerning acetic acid, a linear fitting could well represent its sorption in the membrane (no saturation feature in the concentration range investigated) but Langmuir parameters were also estimated to allow testing the extended Langmuir model for the further study of competition between all the solutes in solution.
Except for furfural, the more hydrophobic the molecule (logKOW >> 0, Table 2), the more adsorbed
it is. Being highly hydrophilic, 2,3-butanediol (logKOW = -0.92) stays in the solution and its large
size (MW = 90.15 g mol-1 ; VDW area = 127 Å2 ) and solvation sphere prevent its incorporation to
interstitial water, so no sorption is measured. Similarly, acetic acid low sorption on the membranes can be explained by its high polarity (logKOW = -0.17) due to its carboxylic function and small
interactions between its hydroxyl group and the free amine groups of the polyamide should occur, explaining a small but measurable sorption. Due to its small size it can also dissolve into the interstitial water of the polymer. Its sorption appears higher for ESPA2 membrane than for CPA2, which could be explained by the thicker skin-layer of ESPA2, twice that of CPA2 as mentioned by [23]. ESPA2 would then exhibit a higher active layer area for an equivalent flat surface corresponding to a higher roughness and leading to more interaction sites as well as a higher interstitial water volume in which the smallest polar solutes as acetic acid can dissolve. For bigger and more hindered compounds these effects do not exist anymore and no more adsorption difference is noticed. Acetic acid is not sorbed at all on BW30. It is less attracted by the alcohol functions at the surface than by the carboxylic groups, this coating probably also hindering the penetration of this solute inside the membrane. Butanoic acid sorption is similar on the uncoated CPA2 and ESPA2 membranes and two to five times more important than acetic acid one. The carbon chain of this apolar solute should interact through Lifshitz-van der Waals interactions with the aromatic rings of the polyamide. In the concentration range investigated, its sorption on these membranes could be considered quite proportional to the solution concentration, unlike on the BW30 membrane where its sorption is smaller and follows a clear saturating pattern, probably due to its coating layer. These results are in agreement with the contact angle modification of Hydranautics membranes noticed previously.
On all the membranes, butanoic acid adsorption is less important than furfural and 2-phenethyl alcohol which can both interact through 4-4 dispersion forces with the membrane. For
both aromatics, Qmax,i and Ks,i measured for CPA2 and ESPA2 membranes are close to each other,
when BW30 membrane leads to a quite different result. Furfural adsorption is slightly higher when its affinity estimated by Ks seems slightly inferior to that of 2-phenethyl alcohol. The affinity difference could be due to the difference of its ring structure (a 5 atoms hetero cycle) compared to the aromatic sites of the membrane (homogeneous cycle of 6 atoms). Taken the electron-drawing properties of its aldehyde substituent into account it is also expected to have a smaller electron
density in its ring which supports a smaller π−π interaction. Actually, its polarisability is high and
its dipolar moment the highest amongst the studied compounds (5.51 D) when calculated by
molecular modeling (Cerius2- Accelrys, USA)). For both molecules, isotherms clearly follow a
saturating pattern, which indicates that sorption occurs on a finite number of sites and the smaller
size of furfural would explain its higher sorption (VDW area about 115 Å2 compared to 173 Å2 for
Fig. 4. Sorption isotherms of single-solute solutions on CPA2, ESPA2 and BW30 membranes and
their simulations (Table 4) ( acetic acid; butanoic acid; 1 furfural; 1 2-phenethyl alcohol).
3.2.2. Competitive effects in mixtures
As expected, once in solution with other compounds, the adsorbed quantity of most of the solutes on the membrane is smaller than for single-solute solution due to competition effects for the adsorption sites. In the industrial and model condensates, molecules have very different concentration levels (from 0.2 mol m-3 for furfural up to 33.3 mol m-3 for acetic acid) so that possible competition effects can be hidden. Therefore an equimolar mixture was also tested. Results are similar for CPA2 and ESPA2. Best simulation results with the extended Langmuir model were obtained for CPA2 and are given as an example in figures 5, 6, and 7. In that case, fitting can only be represented by dots and not lines, as each experimental sorption point for a given solute hides a given proportion of the other solutes in the mixture, different to that of its neighbours. Even if sorption was almost linear for acetic acid alone on the membranes (Fig. 4), its Langmuir constants had to be calculated to apply the model and consider its possible competitive effect. Concerning the model condensate which composition is well defined, Fig. 5 shows a rather good modeling at moderate concentration levels but an underestimation for the high concentration ranges. Better
CPA2 0 0.002 0.004 0.006 0.008 0.01 0.00 5.00 10.00 15.00 20.00 Ceq (mol m -3 ) Q ( m o l m -² ) ESPA2 0 0.002 0.004 0.006 0.008 0.01 0.00 5.00 10.00 15.00 20.00 Ceq (mol m -3 ) Q ( m o l m -² ) BW30 0 0.002 0.004 0.006 0.008 0.01 0.00 2.00 4.00 6.00 8.00 10.00 12.00 14.00 Ceq (mol m -3 ) Q ( m o l m -² )
(0,0): this molecule clearly does not interfere with other compounds and should not be taken into account in the competitive model of the adsorption. In the equimolar mixture (Fig. 6) its relative proportion is much lower than in the condensates and its influence thus less important, explaining there is nearly no difference between the models taking or not its sorption into account. Moreover its sorption is not affected by the other molecules and this for any proportion of the mixture, as shown for the equimolar model solution where modeling by its mono-component Langmuir equation is the best. It confirms that its sorption mechanism is different, probably not based on physical-chemical interactions with the membrane surface but mainly through dissolution in the interstitial water. Thus the competitive adsorption model does not fit its behaviour well: it always leads to underestimation of its sorption in the membrane material. Decrease of the butanoic acid sorption is more important in the equimolar mixture than for the condensates. It indicates that competitive effects occur with furfural and 2-phenethyl alcohol which concentrations are multiplied by five in this solution. Concerning the industrial condensate (Fig. 7), adsorptions are well predicted by the extended Langmuir model, especially for the smallest concentrations.
Concerning BW30 membrane (results not shown here) no sorption of the acetic acid had been noticed, so modeling with the extended Langmuir model with or without its contribution gives the same result. Simulation for the model condensate leads to an over-estimation of the adsorbed quantity for butanoic acid and furfural and an under-estimation for 2-phenethyl alcohol, when it is good for the industrial condensate. This shows that interaction mechanisms are more complex in the case of this coated membrane; model should be improved especially for furfural adsorption.
Fig. 5. Experimental and calculated sorption isotherms of the solutes in the model condensate
for CPA2 membrane (+ experimental adsorption; extended Langmuir model; extended
Langmuir model with no acetic acid contribution; ___ mono-component Langmuir model for aa).
Acetic acid - Model Conde nsate
0 0.001 0.002 0.003 0.004 0.005 0.00 100.00 200.00 300.00 400.00 Ceq (m ol m-3) Q ( m o l m -2)
Butanoic acid - Mode l Condensate
0 0.001 0.002 0.003 0.004 0.005 0.00 5.00 10.00 15.00 20.00 Ceq (m ol m-3) Q ( m o l m -2)
Furfural - Mode l Condensate
0 0.0005 0.001 0.0015 0.002 0.00 0.10 0.20 0.30 0.40 Ceq (m ol m-3) Q ( m o l m -2)
2-phenethyl alcohol - Mode l Condensate
0 0.0005 0.001 0.0015 0.002 0.00 0.20 0.40 0.60 0.80 1.00 Ceq (m ol m-3) Q ( m o l m -2)
Fig. 6. Experimental and calculated sorption isotherms of the solutes in the equimolar model
condensate for CPA2 membrane (+ experimental adsorption; extended Langmuir model;
extended Langmuir model with no acetic acid contribution; ___ mono-component Langmuir model
for aa).
Ace tic acid - Equim olar m ixture
0 0.0002 0.0004 0.0006 0.0008 0.001 0.00 2.00 4.00 6.00 8.00 10.00 12.00 Ceq (m ol m-3) Q ( m o l m -2)
Butanoic acid - Equim olar m ixture
0 0.0002 0.0004 0.0006 0.0008 0.001 0.0012 0.00 2.00 4.00 6.00 8.00 10.00 12.00 Ceq (m ol m-3) Q ( m o l m -2)
2-phene thyl alcohol - Equim olar m ixture
0 0.001 0.002 0.003 0.004 0.005 0.00 2.00 4.00 6.00 8.00 10.00 Ceq (m ol m-3) Q ( m o l m -2)
Furfural - Equim olar m ixture
0 0.001 0.002 0.003 0.004 0.005 0.00 2.00 4.00 6.00 8.00 10.00 Ceq (m ol m-3) Q ( m o l m -2)
Fig. 7. Experimental and calculated sorption isotherms of the solutes in the industrial condensate for CPA2 membrane (+ Experimental adsorption; extended Langmuir model; extended Langmuir
model with no acetic acid contribution; ___ mono-component Langmuir model for aa).
3.3. Consequences on the RO process
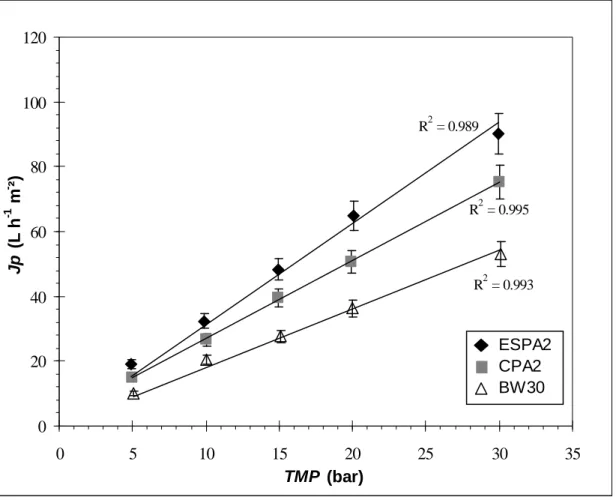
Solutes interactions with the membrane material will have an influence on the process performances. Concerning the water flux, Fig. 8 shows that as expected by SD model, it increases linearly with the effective pressure for the three membranes. Permeability to water A, corresponding to the slope of the lines drawn are gathered in Table 5. Related to its thickness and roughness, ESPA2 membrane exhibits the highest permeability followed by CPA2 and BW30 membranes, this latter being nearly half of ESPA2 one. With the solutions, permeate flux diverges slightly to linearity at high effective pressure (above 15 bar). For single-solute solutions, the permeability
calculated from the evolution of Jp vs (TMP-
∆Π
) tends to decrease as solute concentration increasesas shown for 2-phenethyl alcohol and CPA2 in Table 5. This effect is observed whatever the membrane but its magnitude differs from one solute to another. For CPA2 membrane, the permeability decrease follows the order of solutes sorption. A decrease of the permeate flux is also
Acetic acid - Indus trial Condens ate
0 0.005 0.01 0.015 0.02 0.00 10.00 20.00 30.00 40.00 Ceq (m ol m-3) Q ( m o l m -2)
Butanoic acid - Industrial Conde nsate
0 0.002 0.004 0.006 0.008 0.01 0.00 5.00 10.00 15.00 Ceq (m ol m-3) Q ( m o l m -2)
2-phenethyl alcohol - Indus trial Condensate
0 0.0005 0.001 0.0015 0.002 0.00 0.10 0.20 0.30 0.40 0.50 0.60 Ceq (m ol m-3) Q ( m o l m -2)
which contains additional molecules in solution. This phenomenon appears to be related to concentration polarization, which increases with pressure and depends on both solute type and its concentration.
Fig. 8. Pure water flux versus transmembrane pressure for CPA2, ESPA2 and BW30 membranes. Permeability to water A (Table 5) corresponds to the slope of the lines drawn.
Solutes rejection is the result of the combination of different influences: both low affinity with the membrane material and hindrance due to a high molecular weight will impede the solute's transfer through the reverse osmosis membrane and consecutively favor its rejection. Moreover when effective pressure increases, so does the rejection because of the dilution of the permeate stream due to the enhancement of the permeate flux generated. An example of the permeate flux influence is given on Fig. 9 for single-solute solutions of similar concentrations and the CPA2 membrane. When alone in solution, furfural and acetic acid transport through the membrane is the highest with rejections below 60%, followed by butanoic acid, 2-phenethyl alcohol and 2,3-butanediol. The same classification is obtained with the three membranes when compared at equivalent permeate flux (Fig. 10). These results can be related to the solutes properties (Table 2) and sorption behavior. Acetic acid and 2,3-butanediol do not interact with the membrane. Acetic acid which molecular weight is the lowest accesses interstitial water as already discussed and is
R2 = 0.995 R2 = 0.989 R2 = 0.993 0 20 40 60 80 100 120 0 5 10 15 20 25 30 35 TMP (bar) J p ( L h -1 m - ²) ESPA2 CPA2 BW30
extracted jointly to water, while 2,3-butanediol is excluded of the membrane by a molecular sieving mechanism. As a polyol, its solvation by water probably participates to its steric hindrance and both low affinity and diffusivity prevent its transfer through the membrane. Furfural presents an important sorption on the membrane surface which is favorable to its transfer. Because its hydrophobicity and molecular weight are relatively low, it can also diffuse easily through the membrane swept along by water with which it has a relative attraction due to its polar groups.
2-Phenethyl alcohol is strongly adsorbed as well but with a molecular weight of 122 g mol-1 and its
bigger size (VDW area about 173 Å2), its diffusion kinetics inside the membrane material is
probably extremely slow, prevailing over the affinity parameter: as a consequence its rejection is over 85% for most of the conditions tested. Butanoic acid behavior appears intermediate due to its average molecular weight and sorption.
As far as membranes are concerned, for similar solute concentration and permeate flux, solutes are better rejected by the ESPA2 than by the CPA2 membrane (Fig. 10). On both membranes, adsorptions were equivalent. The rejection's differences should be a consequence of a slower diffusion in the ESPA2 polymer, probably explained by the more cross-linked structure as observed through the ζ-potential measurements. Best rejection of the acetic acid is obtained with the BW30 membrane which is consistent with the smaller sorption previously measured. For butanoic acid and furfural at their concentration in the condensates, sorption is much higher on this membrane than on the uncoated ones. As a consequence, rejections appear smaller than on the ESPA2 but not with the CPA2, in which diffusion should be higher.
0 10 20 30 40 50 60 70 80 90 100 0 20 40 60 80 100 120 Jp (L h-1 m-2) R ( % )
aa - 2.81 mol m-3 ba - 1.5 mol m-3 f - 0.93 mol m-3 phol - 0.8 mol m-3 bdiol - 0.63 mol m-3
Fig. 10. Solute rejections in single-solute solutions for the three membranes tested, for concentrations close to those in the condensates.
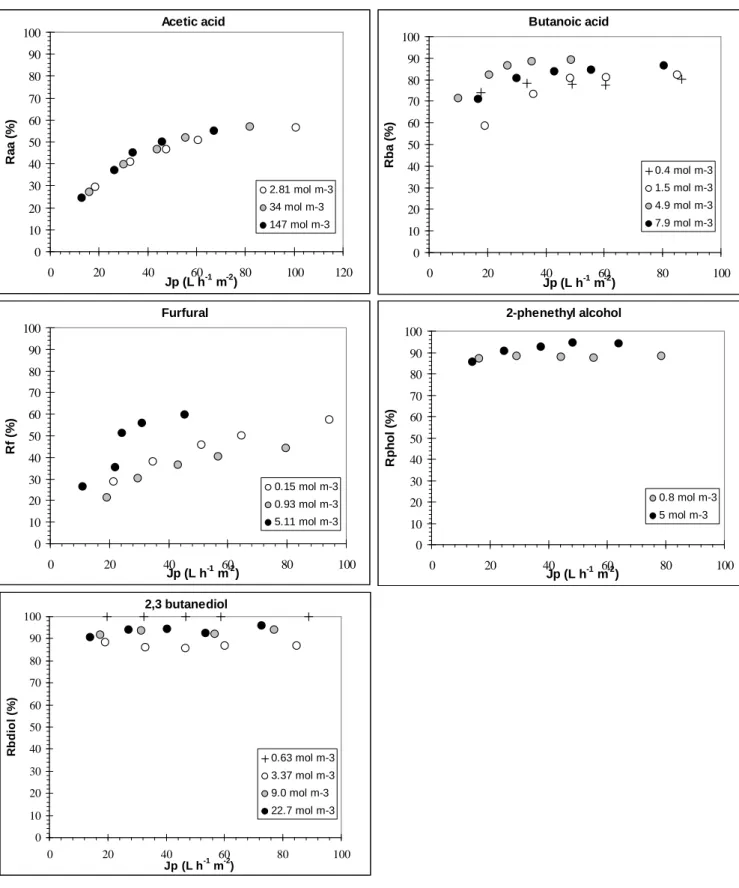
As seen in subsection 2.3., for a linear sorption of the solute in the membrane, permeability B to the solute should stay constant whatever the concentration in solution (Eq. 2). Consecutively and for a given permeate flux, the concentration increase on the retentate side should result in an equivalent increase on the permeate side and the rejection remain unchanged. Actually, this is what is observed for acetic acid (Fig. 11). On the contrary, when interactions deviate from a simple partitioning and lead to a saturating pattern as is obvious for furfural and 2-phenethyl alcohol (Fig. 4, for concentrations above 0.5 - 1 mol m-3), increase of the concentration in solution would result in a
smaller increase inside the membrane and then a smaller increase of CP in the permeate, leading to
an improvement of the rejection. As expected, furfural rejection follows this tendency for
concentrations above 1 mol m-3 and in a lesser extent 2-phenethyl alcohol, because its rejection is
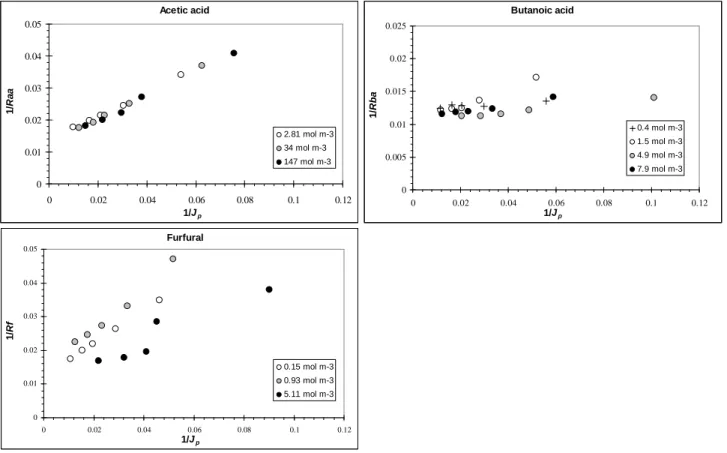
always very high. For both solutes in the linear part of the sorption isotherm, a concentration increase has quite no effect on the rejection as for acetic acid. To confirm this deviation to the
standard SD model, plots of 1/R vs 1/JP were drawn for each solute at the different concentrations
tested (Fig. 12). Results for CPA2 confirm that SD model with a constant solute permeability B is
Acetic acid 0 10 20 30 40 50 60 70 80 90 100 0 20 40 60 80 100 Jp (L h-1 m-2) R a a ( % ) CPA2 34 mol m-3 ESPA2 34.8 mol m-3 BW30 42.1 mol m-3 Butanoic acid 0 10 20 30 40 50 60 70 80 90 100 0 20 40 60 80 100 Jp (L h-1 m-2) R b a ( % ) CPA2 1.5 mol m-3 ESPA2 2.5 mol m-3 BW30 2.21 mol m-3 Furfural 0 10 20 30 40 50 60 70 80 90 100 0 20 40 60 80 100 Jp (L h-1 m-2) R f ( % ) CPA2 0.29 mol m-3 ESPA2 0.23 mol m-3 BW30 0.22 mol m-3
2-phe nethyl alcohol
0 10 20 30 40 50 60 70 80 90 100 0 20 40 60 80 100 Jp (L h-1 m-2) R p h o l (% ) CPA2 0.1 mol m-3 ESPA2 0.13 mol m-3 BW30 0.22 mol m-3
only applicable to acetic acid, all points being on a single line. For furfural the curves obtained are not linear and do not overlap, especially above 1 mol m-3. Butanoic acid gives an intermediate result. Being highly rejected, concentration variations have few effect on 2,3-butanediol or
2-phenethyl alcohol rejection and consecutively on their 1/R vs 1/JP plots (not shown here).
Fig. 11. Concentration influence on solutes rejection for CPA2 membrane – Single-solute solutions. Acetic acid 0 10 20 30 40 50 60 70 80 90 100 0 20 40 60 80 100 120 Jp (L h-1 m-2) R a a ( % ) 2.81 mol m-3 34 mol m-3 147 mol m-3 Butanoic acid 0 10 20 30 40 50 60 70 80 90 100 0 20 40 60 80 100 Jp (L h-1 m-2) R b a ( % ) 0.4 mol m-3 1.5 mol m-3 4.9 mol m-3 7.9 mol m-3 Furfural 0 10 20 30 40 50 60 70 80 90 100 0 20 40 60 80 100 Jp (L h-1 m-2) R f (% ) 0.15 mol m-3 0.93 mol m-3 5.11 mol m-3 2-phenethyl alcohol 0 10 20 30 40 50 60 70 80 90 100 0 20 40 60 80 100 Jp (L h-1 m-2) R p h o l (% ) 0.8 mol m-3 5 mol m-3 2,3 butanediol 0 10 20 30 40 50 60 70 80 90 100 0 20 40 60 80 100 Jp (L h-1 m-2) R b d io l (% ) 0.63 mol m-3 3.37 mol m-3 9.0 mol m-3 22.7 mol m-3
Fig. 12. Validity of the solution-diffusion model (Eq. (3)) - example for CPA2 membrane and single-solute solutions.
Rejection of the five solutes is also affected in different ways by competitive effects. Most often, solute rejection increases when solutes are in mixtures, which is consistent with the smaller adsorptions measured. An example is given in Fig. 13 for CPA2 membrane for which the equimolar mixture was also tested. Butanoic acid being in competition with aromatic compounds for the adsorption, its rejection increases in mixtures, and is the highest for the industrial condensate which may contain additional apolar solutes. The same tendency is obtained for 2-phenethyl alcohol, its major competing solutes being furfural or other aromatics. Surprisingly, the contrary is observed for furfural with rejection on CPA2 decreasing in model condensate and even more in the equimolar mixture. We previously showed that an extended Langmuir model (especially with no contribution of acetic acid) succeeded in fitting its lower adsorption on the membrane when in mixture with other competing solutes. It then appeared twice less adsorbed in the equimolar mixture than when
alone for Ceq = 1 mol m-3 (Figs 4 and 6). Even if less adsorbed, its rejection is there decreased, as if
its diffusion was enhanced. The presence of other solutes and especially when they are concentrated would then favor its transfer through the membrane. This result remained unexplained and is in opposition with those obtained for the model condensate on BW30 and ESPA2 where furfural rejection was enhanced as expected.
Acetic acid 0 0.01 0.02 0.03 0.04 0.05 0 0.02 0.04 0.06 0.08 0.1 0.12 1/Jp 1 /R a a 2.81 mol m-3 34 mol m-3 147 mol m-3 Butanoic acid 0 0.005 0.01 0.015 0.02 0.025 0 0.02 0.04 0.06 0.08 0.1 0.12 1/Jp 1 /R b a 0.4 mol m-3 1.5 mol m-3 4.9 mol m-3 7.9 mol m-3 Furfural 0 0.01 0.02 0.03 0.04 0.05 0 0.02 0.04 0.06 0.08 0.1 0.12 1/Jp 1 /R f 0.15 mol m-3 0.93 mol m-3 5.11 mol m-3
Fig. 13. Mixture influence on the solute rejection for CPA2 membrane.
5. Conclusion
Reverse osmosis membranes are composite membranes, with a skin-layer in polyamide polymerized on two porous sub-layers. In this work, the underlying modified SD model assumes that an overall sorption of the solutes on the membrane, easily measured through batch experiments, can represent their behavior in the dynamic reverse-osmosis process. We showed that such approach is helpful for understanding the rejections observed and could be used to predict them.
For a small and polar solute such as acetic acid, no specific interaction occurs with the membrane and transfer mechanism appears to be mainly by dissolution into the interstitial water of the polymer, resulting in poor rejection. Associated with a higher roughness and specific area, ESPA2 membrane gives a higher sorption of the carboxylic acids than both other studied membranes. More apolar solutes and especially aromatic ones strongly interact with the membrane material resulting in a saturating pattern of the sorption isotherm measured, for concentrations
Butanoic acid 0 20 40 60 80 100 0 20 40 60 80 100 Jp (L h-1 m-2) R b a ( % ) Alone - 1.5 m ol m-3 Model Condensate Industrial Condensate Equim olar mixture - 1 m ol m-3
Acetic acid 0 20 40 60 80 100 0 20 40 60 80 100 Jp (L h-1 m-2) R a a ( % ) Alone - 34 m ol m -3 Model Condensate Industrial Condens ate Equimolar mixture - 1 mol m -3
Furfural 0 20 40 60 80 100 0 20 40 60 80 100 Jp (L h-1 m-2) R f ( % ) Alone - 0.18 m ol m-3 Model Condensate Equim olar mixture - 1 m ol m-3
2-phenethyl alcohol 0 20 40 60 80 100 0 20 40 60 80 100 Jp (L h-1 m-2) R p h o l (% ) Alone - 0.2 mol m -3 Model Condensate Industrial Condensate Equimolar mixture - 1 mol m -3
those in the effluent to be treated could easily be reached at the industrial scale. Langmuir equation was found to be convenient for modeling this behavior and should be taken into account for rejection prediction in that case. Furthermore, experiments performed with various solutes mixtures showed that the extended Langmuir equation is a suitable model to represent the multi-component sorption of non polar solutes. They also confirmed that acetic acid does not compete for sorption onto the interaction sites of the membrane, due to its different sorption mechanism.
For the non polar and highly adsorbed compounds, depending on their size and diffusion properties in the polymer of the membrane, rejections observed at pilot-scale are much different: for
furfural, which is the smallest (96 g mol-1) and the most adsorbed, rejection varies between 20% and
80% depending on concentration and pressure. On the contrary, when the solute is bigger as for
2-phenethyl alcohol (122 g mol-1), diffusion is so small that its high sorption has no positive effect on
its permeation, with rejections always above 85%. For aromatic solutes, a molecular weight cut-off
of about 110 g mol-1 then arises on these membranes: bigger solutes are always well rejected when
for smaller ones, the study of the influence of process parameters (pressure, permeate flux, feed concentration) and their integration in a transport model appear essential for the optimization of their rejection.
Such modeling approach including multi-component Langmuir isotherms was already undertaken for this application [13]. It could now be improved since we showed it could be based directly on the mono-component isotherm data, via an adequate competitive model. However, the modified SD model we have considered appears as a simplification of the actual complex transfer mechanism of a solute in a composite membrane: improvement would be through a detailed transfer mechanisms taking account of the three layers separately.
Nomenclature
A water permeability
B solute permeability
C0 initial concentration in batch experiments
Ceq equilibrium concentration in batch experiments
CP permeate concentration
CR retentate concentration
CRave average composition of the retentate
D diffusivity coefficient
I net electrical current
IC industrial condensate
Jp permeate flux
Js solute flux through the membrane
K1 partition coefficient for linear adsorption isotherm
KOW octanol to water partition coefficient
Ks Langmuir equilibrium constant
MC model condensate
MPD 1,3-benzenediamine
MW molecular weight
2P applied pressure for zeta-potential measurements
Q quantity sorbed on the membrane in batch experiments
Qmax maximal quantity sorbed on the membrane
R solute rejection
S membrane surface for batch experiments
T absolute temperature
TMC trimesoyl chloride
TMP transmembrane pressure
TMPeff effective transmembrane pressure
V volume of the solution in batch experiments
VRR volume reduction ratio
Greek symbols
∆Π
differential osmotic pressure between permeate and average retentateε
0 vacuum permittivityε
r relative dielectric constant of the solventλ0 conductivity of bulk electrolyte
µ
viscosityζ
zeta-potential Subscript i, j, n solute aa acetic acid ba butanoic acid f furfuralphol 2-phenethyl alcohol
bdiol 2,3-butanediol
References
[1] E. Kurt, D.Y. Koseoglu-Imer, N. Dizge, S. Chellam, I. Koyuncu, Pilot-scale evaluation of
nanofiltration and reverse osmosis for process reuse of segregated textile dyewash wastewater, Desalination 302 (2012) 24-32.
[2] P.S. Zhong, N. Widjojo, T.S. Chung, M. Weber, C. Maletzko, Positively charged
nanofiltration (NF) membranes via UV grafting on sulfonated polyphenylenesulfone (sPPSU) for effective removal of textile dyes from wastewater, J. Membr. Sci. 417 (2012) 52-60.
[3] D. Dolar, T.I. Zokic, K. Kosutic, D. Asperger, D.M. Pavlovic, RO/NF membrane treatment
of veterinary pharmaceutical wastewater: comparison of results obtained on a laboratory and a pilot scale, Environ. Sci. Pollut. Res. 19 (2012) 1033-1042.
[4] R. Suthanthararajan, E. Ravindranath, K. Chitra, B. Umamaheswari, T. Ramesh, S.
Rajamani, Membrane application for recovery and reuse of water from treated tannery wastewater, Desalination 164 (2004) 151-156.
[5] R. Ordonez, D. Hermosilla, I.S. Pio, A. Blanco, Replacement of fresh water use by final
effluent recovery in a highly optimized 100% recovered paper mill, Water Sci. Technol. 62 (2010) 1694-1703.
[6] B. Qi, J. Luo, X. Chen, X. Hang, Y. Wan, Separation of furfural from monosaccharides by
nanofiltration, Bioresource Technology 102 (2011) 7111-7118.
[7] Y.-H. Weng, H.-J. Wei, T.-Y. Tsai, W.-H. Chen, T.-Y. Wei, W.-S. Hwang, P. Wang,
C.-P. Huang, Separation of acetic acid from xylose by nanofiltration, Sep. Purif. Technol. 67 (2009) 95-102.
[8] E. Morin Couallier, T. Payot, A. Pastore Bertin, M.L. Lameloise, Recycling of distillery
effluents in alcoholic fermentation: role in inhibition of 10 organic molecules, Appl. Biochem. Biotechnol. 133 (2006) 217-238.
[9] E. Morin Couallier, B. Salgado Ruiz, M.-L. Lameloise, M. Decloux, Usefulness of reverse osmosis treatment of condensates arising from concentration of distillery vinasses, Desalination 196 (2006) 306-317.
[10] C. Sagne, C. Fargues, R. Lewanddowski, M.-L. Lameloise, M. Decloux, Screening of
reverse osmosis membranes for the treatment and reuse of distillery condensates into alcoholic fermentation, Desalination 219 (2008) 335-347.
[11] C. Bellona, J.E. Drewes, P. Xu, G. Amy, Factors affecting the rejection of organic solutes during NF/RO treatment - a literature review, Water Res. 38 (2004) 2795-2809.
[12] K. Kimura, G. Amy, J. Drewes, Y. Watanabe, Adsorption of hydrophobic compounds onto
NF/RO membranes: an artifact leading to overestimation of rejection, J. Membr. Sci. 221 (2003) 89-101.
[13] C. Sagne, C. Fargues, B. Broyart, M.-L. Lameloise, M. Decloux, Modeling permeation of
volatile organic molecules through reverse osmosis spiral-wound membranes, J. Membr. Sci. 330 (2009) 40-50.
[14] M.E. Williams, J.A. Hestekin, C.N. Smothers, D. Bhattacharyya, Separation of organic
pollutants by reverse osmosis and nanofiltration membranes: mathematical models and experimental verification, Ind. Eng. Chem. Res. 38 (1999) 3683-3695.
[15] C. Hansch, A. Leo, D. Hoekman, Exploring QSAR - Hydrophobic, Electronic, and Steric
Constants. A. C. Society ed., Washington DC, 1995.
[16] C. Sagne, C. Fargues, R. Lewandowski, M.-L. Lameloise, M. Gavach, M. Decloux, A pilot
scale study of reverse osmosis for the purification of condensate arising from distillery stillage concentration plant, Chem. Eng. Process: Process Intensification 49 (2010) 331-339.
[17] P. Fievet, A. Szymczyck, M. Sbaï, C. Magnenet, N. Fatin-Rouge, Tangential streaming
potential as a tool in the characterisation of microporous membranes: Theory and Experiments, in Transworld research network ed., Recent developments in colloids and interface research, Trivvandrum, 2004, pp. 1-27.
[18] A. Yaroshchuk, T. Luxbacher, Interpretation of electrokinetic measurements with porous
films: role of electric conductance and streaming current within porous structure, Langmuir 26 (2010) 10882-10889.
[19] S.-Y. Kwak, S.G. Jung, S.H. Kim, Structure-motion-performance relationship of flux
enhanced reverse osmosis (RO) membranes composed of aromatic polyalide thin films, Environ. Sci. Technol. 35 (2001) 4334-4340.
[20] C.Y. Tang, Q.S. Fu, A.P. Robertsin, C.S. Criddle, J.O. Leckie, Use of reverse osmosis to
remove perfluorooctane sulfonate (PFOS) from semiconductor wastewater,
Environnemental Science and Technology 40 (2006) 7343-7349.
[21] C.Y. Tang, Y.N. Kwon, J.O. Leckie, Effect of membrane chemistry and coating layer on
physicochemical properties of thin film composite polyamide RO and NF membranes I. FTIR and XPS characterization of polyamide and coating layer chemistry, Desalination 242 (2009) 149-167.
[22] C.Y.Y. Tang, Y.N. Kwon, J.O. Leckie, Probing the nano- and micro-scales of reverse
osmosis membranes - A comprehensive characterization of physiochemical properties of uncoated and coated membranes by XPS, TEM, ATR-FTIR, and streaming potential measurements, J. Membr. Sci. 287 (2007) 146-156.
[23] R. Gerard, H. Hachisuka, M. Hirose, New membrane developments expanding the horizon
Tables captions
Table 1 Characteristics of reverse osmosis membranes (manufacturers’ data)
Manufacturer Name Type Tmax (°C)
Pmax
(bar) pH
NaCl Rejection / Feed concentration ESPA2 Brackish water
Low pressure 45 41.4 3 - 10
99.6% at 10.5 bar / 1500 ppm HYDRANAUTICS
CPA2 Brackish water
High rejection 45 41.4 3 - 10
99.5% at 15.5 bar / 1500 ppm DOW FILMTEC BW30 Brackish water 45,
35 at pH 10 41 2 - 11
99.5% at 15.5 bar / 2000 ppm
Table 2 Properties and concentration of components in synthetic and industrial solutions for pilot-scale reverse-osmosis experiments
Concentration (mol m-3) Component MW (g mol-1) VDW Areaa (52) logKOW [15] Formula Single-solute solution Model Condensate Industrial condensate Acetic acid (aa) (ethanoic) 60.05 82 -0.17 3.0 33.3 142 34 11.5 Butanoic acid (ba) 88.10 129 0.79 1.6 4.3 8.0 1.5 2 2,3-butanediol (bdiol) 90.12 127 -0.92 2.5 9.3 46.5 9 5 Furfural (f) (furaldehyde) 96.08 115 0.41 0.2 1.0 5.0 0.2 nd 2-phenethyl alcohol (phol) 122.17 173 1.36 0.2 1.0 5.0 0.2 0.1 a
Table 3 Contact angle measurements (deg) for ESPA2, CPA2 and BW30 membranes performed
with water, formamide and 1-bromonaphtalene on membranes conditioned in water, model (MC)
and industrial (IC) condensates
Membrane Pretreatment Water Formamide 1-Bromonaphtalene
Water 16.7 ± 6 10 ± 4 Totally spread MC 16.7 ± 5 Totally spread Totally spread CPA2
IC 35.4 ± 16 Totally spread Totally spread Water 30.1 ± 2 10.3 ± 5 Totally spread MC 25.3 ± 5 Totally spread Totally spread ESPA2
IC 29.4 ± 3 Totally spread Totally spread Water 26.0 ± 0 18.2 ± 4 Totally spread
MC 17.5 ± 4 Totally spread 17.7 ± 4 BW30
IC 50.5 ± 14 26.6 ± 3 Totally spread
Table 4 Langmuir constants for single-solute sorption isotherms on CPA2, ESPA2 and BW30 membranes CPA2 ESPA2 BW30 Qmax = 5.0 10 -3 mol m-2 Ks = 0.018 m 3 mol-1 R2 = 0.971 Qmax = 5.1 10 -3 mol m-2 Ks = 0.051 m 3 mol-1 R2 = 0.899 aa K1 = 7.18 10 -5 m R2 = 0.960 K1 = 1.58 10 -4 m R2 = 0.837 No sorption ba Qmax = 1.0 10 -1 mol m-2 Ks = 0.004 m 3 mol-1 R2 = 0.936 Qmax = 9.4 10 -2 mol m-2 Ks = 0.004 m 3 mol-1 R2 = 0.983 Qmax = 3.4 10 -3 mol m-2 Ks = 0.625 m 3 mol-1 R2 = 0.770 f Qmax = 8.7 10 -3 mol m-2 Ks = 0.518 m 3 mol-1 R2 = 0.965 Qmax = 1.7 10 -2 mol m-2 Ks = 0.106 m 3 mol-1 R2 = 0.964 Qmax = 7.3 10 -3 mol m-2 Ks = 15.5 m 3 mol-1 R2 = 0.862 phol Qmax = 5.8 10 -3 mol m-2 Ks = 0.837 m 3 mol-1 R2 = 0.947 Qmax = 5.2 10 -3 mol m-2 Ks = 1.115 m 3 mol-1 R2 = 0.952 Qmax = 5.3 10 -3 mol m-2 Ks = 2.443 m 3 mol-1 R2 = 0.990
Table 5
Permeability to the solvent: influence of membrane, solution type and solute concentration.
Membrane type Solution type Solute concentration
Permeability to water (L h-1 m-2 bar-1) ESPA2 permeability (L h-1 m-2 bar-1) Cphol (mol m-3) CPA2 permeability (L h-1 m-2 bar-1) ESPA2 3.1 ( ± 0.3) Water 3.1 ( ± 0.3) 0.15 3.0 ( ± 0.3) CPA2 2.6 ( ± 0.2) Model C 2.9 ( ± 0.3) 0.93 2.8 ( ± 0.3) BW30 1.8 ( ± 0.2) Industrial C 2.6 ( ± 0.2) 5.1 2.4 ( ± 0.2) Figures captions
Fig. 1. Scheme of the spiral-wound RO pilot from Polymem - Recycling mode.
Fig. 2. Cross-linked aromatic polyamide composition (MPD = 1,3-benzenediamine; TMC = trimesoyl chloride).
Fig. 3. 3-potential measurements performed in 10-3 M KCl for ESPA2, CPA2 and BW30 fresh membranes.
Fig. 4. Sorption isotherms of single-solute solutions on CPA2, ESPA2 and BW30 membranes and
their simulations (Table 4) ( acetic acid; butanoic acid; 1 furfural ; 1 2-phenethyl alcohol).
Fig. 5. Experimental and calculated sorption isotherms of the solutes in the model condensate for CPA2 membrane (+ experimental adsorption; extended Langmuir model; extended Langmuir
model with no acetic acid contribution; ___ mono-component Langmuir model for aa).
Fig. 6. Experimental and calculated sorption isotherms of the solutes in the equimolar model
condensate for CPA2 membrane (+ experimental adsorption; extended Langmuir model;
extended Langmuir model with no acetic acid contribution; ___ mono-component Langmuir model
for aa).
Fig. 7. Experimental and calculated sorption isotherms of the solutes in the industrial condensate for
CPA2 membrane (+ experimental adsorption; extended Langmuir model; extended Langmuir
Fig. 8. Pure water flux versus transmembrane pressure for CPA2, ESPA2 and BW30 membranes. Permeability to water A (Table 5) corresponds to the slope of the lines drawn.
Fig. 9. Rejection of the five target solutes in single-solute solutions for CPA2 membrane.
Fig. 10. Solute rejections in single-solute solutions for the three membranes tested, for concentrations close to those in the condensates.
Fig. 11. Concentration influence on solutes rejection for CPA2 membrane – Single-solute solutions.
Fig. 12. Validity of the solution-diffusion model (Eq. 3) - example for CPA2 membrane and single-solute solutions.