HAL Id: hal-02996430
https://hal.archives-ouvertes.fr/hal-02996430
Submitted on 13 Nov 2020HAL is a multi-disciplinary open access archive for the deposit and dissemination of sci-entific research documents, whether they are pub-lished or not. The documents may come from teaching and research institutions in France or abroad, or from public or private research centers.
L’archive ouverte pluridisciplinaire HAL, est destinée au dépôt et à la diffusion de documents scientifiques de niveau recherche, publiés ou non, émanant des établissements d’enseignement et de recherche français ou étrangers, des laboratoires publics ou privés.
A multi-method, multi-scale theoretical study of He and
Ne diffusion in zircon
Cécile Gautheron, Duval Mbongo Djimbi, Jérôme Roques, Hilal Balout,
Richard Ketcham, Eric Simoni, Raphaël Pik, Anne-Magali
Seydoux-Guillaume, Laurent Tassan-Got
To cite this version:
Cécile Gautheron, Duval Mbongo Djimbi, Jérôme Roques, Hilal Balout, Richard Ketcham, et al.. A multi-method, multi-scale theoretical study of He and Ne diffusion in zircon. Geochimica et Cos-mochimica Acta, Elsevier, 2020, 268, pp.348-367. �10.1016/j.gca.2019.10.007�. �hal-02996430�
A multi-method, multi-scale theoretical study of He and Ne
1
diffusion in zircon
2
3
Cécile Gautheron1*, Duval Mbongo Djimbi2, Jérôme Roques2, Hilal Balout1, 2, 4
Richard A. Ketcham3, Eric Simoni2, Raphael Pik4, Anne-Magali Seydoux-Guillaume5,6,
5
Laurent Tassan-Got2 6
7
1- GEOPS, CNRS, Univ. Paris-Sud, Université Paris-Saclay, Rue du Belvédère, Bât. 504, 8
F-91405 Orsay, France 9
2- Institut de Physique Nucléaire d’Orsay, CNRS-IN2P3, Univ. Paris-Sud, Université Paris- 10
Saclay, 91406 Orsay cedex, France 11
3- Jackson School of Geosciences, The University of Texas at Austin, Austin, Texas, U.S.A. 12
4- CRPG, 15 rue ND des pauvres BP20, 54501 Vandoeuvre-Lès-Nancy Cedex, France 13
5- Université Clermont Auvergne, CNRS, IRD, OPGC, Laboratoire Magmas et Volcans, F-14
63000 Clermont-Ferrand, France 15
6- Univ Lyon, UJM-Etienne, UCA, CNRS, IRD, LMV UMR 6524, F-42023 Saint-16
Etienne, France 17
18
* corresponding author, [email protected] 19 20 10 figures; 4 Tables 21 2 appendices 22 23
Abstract
24
The quantification of He and Ne diffusion behavior in crystals rich in U and Th such as 25
zircon is key for the interpretation of (U-Th)/ 4He and (U-Th)/21Ne thermochronometric ages. 26
Multiple parameters such as chemical substitution, channel obstruction and damage can modify 27
the diffusivity compared to a pristine structure. To investigate the impact of these parameters, 28
we have conducted a theoretical diffusion study combining a series of methods and approaches 29
to address the problem across the necessary range of scales (atomic to crystal size). First, using 30
quantum calculation, we determine the different He and Ne insertion sites, insertion energies 31
and diffusion pathways at the atomic scale for an ideal pristine zircon structure (i.e. damage 32
free). These results serve as input for a 3D random walk simulation of atomic trajectories that 33
provides diffusion coefficients for damage-free zircon crystals. Second, as natural zircon 34
crystals are not perfect, we model the impact of different types of damage and diffusion 35
pathway obstruction at the atomic level on He and Ne diffusion in 3D. The calculated He and 36
Ne diffusion coefficients for pure ZrSiO4 exhibit strongly anisotropic behavior and very high
37
diffusivity along the c-axis, and with 3D, closure temperatures of -197°C and -202 °C 38
respectively. The results for He are comparable to previous DFT studies but strongly different 39
from experimental diffusion results; results for Ne are similar in this respect. Modelling the 40
impact of different types of damage (vacancies, recoil, fission, voids or fluid inclusions) and 41
obstruction on He and Ne diffusion reveals important implications for the Th)/He and (U-42
Th)/Ne thermochronometers. First, obstruction alone does not significantly modify He and Ne 43
diffusion except to reduce anisotropy. Second, trapping is the primary mechanism altering He 44
and Ne diffusion even at low dose, and we predict the maximal trapping energies for He and 45
Ne to be 164 and 320 kJ/mol, similar to values inferred from experimental data. We also 46
propose that the closure temperature increases non-linearly with damage, with effective 47
trapping energy increasing with dose until a threshold, possibly corresponding to a percolation 48
transition, after which retentivity decreases. Based on field data sets we also anticipate a value 49
for this threshold of around ~2-5×10¹⁷ /g, lower than previously proposed. We show Ne to be 50
highly blocked by damage and predict similar diffusion behavior to He, but with higher 51
retentivity. We demonstrate the importance of investigating rare gas diffusion at the atomic 52
level for comparison with experimental data, in order to build a predictive diffusion law at 53
different scales. 54
1. Introduction
55
In the last two decades, radiogenic 4He and nucleogenic 21Ne have been used for (U-56
Th)/4He and (U-Th)/21Ne thermochronology in different minerals such as apatite, zircon and 57
iron oxides for a broad range of geological applications (e.g. Farley and Flowers, 2012; Farley 58
and Stockli, 2002; Gautheron et al., 2006; Reiners et al., 2002; Shuster et al., 2005; Zeitler et 59
al., 1987). Robust He and Ne age interpretation strongly depends on quantitative knowledge of 60
diffusion behavior in crystals, which is linked to the closure temperature Tc (Dodson, 1973), 61
representing to first order the temperature below which He and Ne are significantly retained 62
during cooling. He and Ne diffusion in crystals theoretically follows a simple Arrhenius law 63
with isotropic or anisotropic diffusion. However, it has been shown that, for apatite and zircon, 64
diffusion behavior is highly variable. Experimental data sets have Tc values ranging from 40 65
to 120°C for He in apatite (Shuster et al., 2006) and from -60 to 190°C for zircon (Guenthner 66
et al., 2013, and references therein). For Ne diffusion in zircon, data are sparse due to analytical 67
difficulties, and Tc estimates come only from indirect assessment and one published abstract 68
(Gautheron et al., 2006; van Soest et al., 2013). 69
Radiation damage is considered to be a primary contributor to this variability, although 70
the impacts of damage type (alpha, recoil and fission damage) and topology (Frenkel-pair, large 71
damage and amorphous zone) on He diffusion in zircon are not well defined. In addition to 72
forming traps for diffusing elements (Farley, 2000), damage can also change diffusive behavior 73
for even low-damage zircon by reducing the strong anisotropy along the c-axis (Bengtson et 74
al., 2012; Farley, 2007). Similar complications may arise from other imperfections such as 75
inclusions, voids, and defects (Zeitler et al., 2017; Danišík et al., 2017). 76
The relationship between He diffusivity and dose in zircon suggests another topological 77
effect. Diffusivity has been shown to decrease with increasing dose until a threshold is reached, 78
after which it strongly increases with further damage (Guenthner et al., 2013), although recent 79
work suggests that this threshold dose may vary (Anderson et al., 2017). This flip in behavior 80
may be linked to the onset of percolation, in which overlapping damage zones start to form an 81
interconnected network (Salje et al., 1999), essentially dividing the crystal into two transport 82
regimes, one through normal crystal (albeit with imperfections) and one through the damage 83
network (Ketcham et al., 2013). Superimposed on the complexity of diffusion is the process of 84
annealing, which changes the landscape in which diffusion occurs, as it is happening. Recent 85
work suggests that damage annealing in zircon also may depend on dose (Ginster et al., 2019), 86
further highlighting the challenges to understanding the regime in which diffusion operates. 87
As a result of this complexity, there are limits to how much progress can be made using 88
exclusively empirical observations and experiments on incompletely-understood natural 89
materials (e.g., Reiners et al., 2004; Reiners, 2005; Cherniak et al., 2009; Guenthner et al., 2013; 90
Anderson et al., 2017; Ginster et al., 2019; Zeitler et al., 2017; Danišík et al., 2017). A rigorous 91
physical understanding of the diffusion process and how it is affected by imperfections is an 92
indispensible complement for the varied and extensive data gathering currently underway. 93
Although the inevitably chaotic and variable nature of damage zones makes them hard to 94
characterize, transport of He and Ne in the areas between damage zones, and between damaged 95
and undamaged crystal, is accessible through theoretical and computational approaches. 96
Several studies have been conducted using Density Functional Theory (DFT) 97
calculations to quantify the He diffusion coefficient in damage-free zircon (Reich et al., 2007; 98
Saadoune and De Leeuw, 2009; Saadoune et al., 2009). Independent studies consistently find 99
that He is not expected to be retained in the zircon structure at Earth-surface temperatures; for 100
example, Bengtson et al. (2012) calculate Tc ~ -150°C along the crystallographic c-axis.
101
However, recent DFT studies on He and Ne diffusion in apatite and hematite give results more 102
similar to experimental data on real specimens, supporting the veracity and applicability of this 103
theoretical approach (Balout et al., 2017a; Djimbi et al., 2015; Gerin et al., 2017). 104
In this contribution, we investigate He and Ne diffusion in zircon from atomic to grain 105
scales using a coordinated series of methodologies developed in recent studies (Djimbi et al., 106
2015, Balout et al., 2017a, b; Gerin et al., 2017) to examine important factors that can modify 107
diffusion rates, including trapping, anisotropy, and path obstruction. As no published Ne 108
diffusion data exist, we use DFT at the atomic scale to build and optimize the ideal zircon unit 109
cell accounting for quantum features, and we inventory the insertion and interstitial sites. Once 110
these sites are identified, we combine the DFT approach with the Nudged Elastic Band (NEB) 111
method to determine the migration energies between them. We complete our atomic-scale 112
characterization using Transition State Theory (TST) to compute jump rates between sites. To 113
extend to a larger scale spanning defects, DFT and TST outputs are used in a Kinetic Monte 114
Carlo (KMC) simulation to determine the diffusion trajectories and the effective diffusion 115
coefficients in 3D. We then compare our results with published experimental data and 116
investigate the processes that can modify He and Ne diffusion in zircon. We simulate and 117
evaluate different hypotheses, such as trapping of He and Ne in damage, and diffusion pathway 118
obstruction, in 3D, and their impact on closure temperature. Finally, we discuss the model 119
implications for the (U-Th)/He and (U-Th)/Ne thermochronometers. 120
2. Methods, the multi-scale approach
121
We first provide a general summary of our methods and how they interact with each 122
other, as illustrated in Figure 1. Density Functional Theory (DFT) is a computational modeling 123
method to calculate the energy of interacting atoms by calculating their external electronic 124
configuration. This is done by solving the Schrödinger equation for the electrons using 125
functionals of the electron density. The DFT just solves static problems, atoms at given 126
positions, and does not include dynamics, contrary to molecular dynamics. However, in contrast 127
to molecular dynamics it includes the quantum effects for the electrons, thereby providing the 128
most accurate energy estimation of an ensemble of interacting atoms. Due to the high 129
calculation time, requiring cluster computing, the number of considered atoms remains small 130
(<150 atoms) compared to a real crystal, and therefore a super-cell containing a small number 131
of motionless atoms is used and an infinite repetition of this super-cell is assumed to represent 132
an infinite lattice. The stable position of the atoms for a crystal lattice is found by nudging atom 133
positions until the total energy is minimized. In the same way, an insertion site for He or Ne is 134
found by inserting it into a pre-computed lattice and finding the positions with the minimum 135
energy with respect to displacement after relaxation of the neighboring atoms. 136
He and Ne atoms can statistically jump between insertion sites when they vibrate as a 137
consequence of the finite temperature. This is a dynamical process, beyond the scope of DFT, 138
which addresses static configurations only. Therefore, another approach has to be followed, 139
namely the Transition State Theory (TST), which computes the jumps statistically. It is based 140
on a full mapping of the energy field encountered when the inserted atom moves along its path 141
to its neighboring site, as delivered by the DFT analysis. This approach is valid because the 142
Born-Oppenheimer approximation allows consideration of the motion of atoms as quasi-143
stationary from the electron viewpoint. 144
The ideal pristine crystal represented by DFT and TST does not capture all the 145
properties of a natural one, which will always contain defects, distortions, dislocations and 146
substitutions, and typically mineral and/or fluid inclusions. However, even in a highly degraded 147
crystal, diffusion occurs in pristine lattice for at least some length scale. The approach we 148
develop here is to consider the ideal case and see how it should be amended when alterations 149
of the pristine lattice are added. Only when significant amorphisation takes place does this 150
approach become invalid. The alteration of the ideal lattice by vacancies, interstitial atoms, and 151
substitutions breaks the periodicity of the lattice and introduces heterogeneity over length scales 152
much larger than the lattice cell dimension. Their effects on diffusion depend on their energy 153
and their topology. Therefore, the easiest way to study them is the simulation of diffusion by 154
random walk over many lattice cells spanning many defects. For this we use the Kinetic Monte 155
Carlo method (KMC), which operates at the mesoscopic level and delivers diffusion 156
coefficients for a heterogeneous medium, based on the energetics of the DFT and the transition 157
rates of the TST (Figure 1). Finally, to compute He and Ne ages in crystals the diffusion 158
equation has to be solved at the macroscopic level using the diffusivities delivered by KMC, or 159
directly by DFT and TST in case of an ideal crystal. 160
In summary, DFT calculates the mapping of energy as a function of atom location. TST 161
then computes the transition rates by using this mapping and by making use of thermodynamic 162
equilibrium in phase space. KMC then quantifies the effect of randomly distributed alterations 163
of the crystal-like traps or obstructions, independently of the mechanism producing them 164
(interstitial atoms, substitutions, etc.). This pipeline delivers bulk diffusion coefficients for 165
solving the 3D diffusion equation for a finite grain, as illustrated in Figure 1. 166
2.1 Density Functional Theory
167
Following the approach described in detail by Djimbi et al. (2015), we use the Periodic 168
Density Functional Theory (DFT; Hohenberg and Kohn, 1964; Kohn and Sham, 1965), as 169
implemented in the Vienna Ab-initio Simulation Package (VASP) (Kresse and Furthmüller, 170
1996; Kresse and Hafner, 1993), for all structural optimization and insertion site investigations 171
of both He- and Ne-doped zircon lattices. All parameters were optimized on the zircon unit cell, 172
and the relaxed unit cell geometrical parameters are in good agreement with experimental 173
values. To minimize the volume relaxation effect due to the incorporation of Ne and He atoms, 174
and to avoid interactions between He or Ne with neighboring cells, the zircon unit cell was 175
duplicated along each spatial direction, resulting in a 2×2×2 super cell consisting of 192 atoms 176
(Figure 2A and 2B). We determine the insertion energy of He and Ne in each interstitial site by 177
relaxing the structure with the help of the gradient technique at constant volume. The insertion 178
energy is defined as the energy needed to bring the He or Ne from outside the crystal into the 179
interstitial site. It is calculated as: 180
𝐸𝑖𝑛𝑠 = 𝐸𝐻𝑒+𝑧𝑖𝑟𝑐𝑜𝑛− (𝐸𝑧𝑖𝑟𝑐𝑜𝑛+ 𝐸𝐻𝑒) (Eq. 1)
181
where 𝐸𝐻𝑒+𝑧𝑖𝑟𝑐𝑜𝑛, 𝐸𝑧𝑖𝑟𝑐𝑜𝑛 and 𝐸𝐻𝑒 are respectively the absolute energy of the system with He 182
or Ne in the zircon host lattice, the absolute energy of the host lattice, and the energy of the 183
isolated He or Ne atom. 184
We use the Nudged Elastic Band (NEB) (Jónsson et al., 1998; Mills et al., 1995) method 185
to determine the migration energy between insertion sites. NEB is an efficient approach to 186
estimating the minimum energy path (MEP) and the migration energy between two interstitial 187
sites (
𝐸
𝑚𝑖𝑔𝑖𝑗)
, which is defined as the difference in energy from when the atom is at the saddle 188point to when it is in the insertion site. It is also called the barrier energy. The NEB is a chain-189
of-states method (Elber and Karplus, 1987; Pratt, 1986) found by constructing a series of system 190
images between states. Adjacent images are linked by a spring force to ensure the continuity of 191
the path, thus mimicking an elastic band. In this study, all NEB calculations are performed with 192
a spring constant of -5 eV/Å2.
193
2.2. Transition State Theory
194
Interstitial diffusion occurs through a random walk of an atom from one site in the 195
crystal lattice to another neighboring free one. The atom needs enough energy to accomplish 196
this motion; as there is an energy barrier to overcome, diffusion is a thermally activated process. 197
As already mentioned, this dynamical process cannot be directly calculated by DFT, which 198
addresses static configurations. However, as the motion occurs in thermodynamic equilibrium 199
the canonical ensemble is assumed in phase space. This leads to the transition state theory 200
(Vineyard, 1957; Voter, 1986; Wert and Zener, 1949), in which the atomic motion is controlled 201
by the jump probabilities, Γ, which depend exponentially on temperature. 202 𝛤𝑖𝑗 = 𝜈 0 𝑒− 𝐸𝑚𝑖𝑔𝑖𝑗 𝑘𝐵𝑇 (Eq. 2) 203 With 𝜈0 = ∏3𝑁𝑖=1𝜈𝑖𝑖𝑛𝑖𝑡 ∏3𝑁−1𝑖=1 𝜈𝑖∗ Vineyard approx. ⇒ ≈∏3𝑖=1𝜈𝑖𝑖𝑛𝑖𝑡 ∏2𝑖=1𝜈𝑖∗ (Eq. 3) 204 And 𝐸𝑚𝑖𝑔𝑖𝑗 = 𝐸∗− 𝐸𝑖𝑛𝑖𝑡 (Eq. 4) 205
Where 𝜈0 is the attempt frequency; 𝜈𝑖𝑖𝑛𝑖𝑡 and 𝜈
𝑖∗ are the normal mode frequencies at,
206
respectively, the initial and transition states; 𝐸𝑚𝑖𝑔𝑖𝑗 represents the migration energies; and N is 207
the number of atoms in the system. For a molecule with N atoms there are 3N degrees of 208
freedom. For a non-linear molecule three degrees of freedom can be assigned to translation of 209
a body as a whole (Tx, Ty, Tz) and three to rotations (Rx, Ry, Rz). The remaining motions of the
210
atoms are displacements of the atoms from their mean positions. These fundamental vibrations 211
are referred to as "normal modes". Thus, a non-linear molecule has 3N-6 normal modes. In the 212
insertion location, the energy is minimum, and therefore the energy has an upward curvature 213
for any displacement of the inserted atom. This 3D-curvature can be expressed with three 214
eigenvalues, which translate directly to the three normal frequencies. This translation is exactly 215
the same as for any harmonic oscillator like a pendulum. At the saddle point, the same features 216
apply, but only transverse motion relative to the transition path is involved, and therefore there 217
are two frequencies. According to the Vineyard (1957) approximation, for one atom (He or Ne), 218
the energetics of other atoms are not affected by the position of the migrating atom being 219
considered. The TST allows thus provides a well-understood theoretical approach for 220
calculating the frequency factor (Figure 1). 221
2.3. Kinetic Monte Carlo Method 222
In a pristine lattice, the activation energy (Ea) corresponds to the migration energy
223
obtained from DFT, and the frequency factor (D0) can be extracted directly from the TST
224
formulas (Fig. 1). However, when obstructions occur the diffusivity depends on their topology, 225
and a simulation over macroscopic crystals has to be run to determine the modified diffusion 226
coefficients. The Kinetic Monte Carlo (KMC) method (Bortz et al., 1975; Gillespie, 1976) is 227
particularly apt for our purposes because it can be used to extend simulation to time scales far 228
beyond the vibrational period and lengths much larger than the cell size. The KMC simulates, 229
at a given temperature, a random walk over the interstitial sites based on the microscopic jump 230
probabilities (Γ), which have been calculated from TST using the DFT results (Fig. 1). In 231
addition, it takes into account potential obstructions and traps, as well as anisotropy. 232
For a selected temperature, one He (or Ne) atom is placed randomly in one available 233
insertion site. For the possible diffusion directions, with the calculated jumping frequencies 234
given by the TST, we randomly choose a number to simulate the jumping time for each 235
direction. The distribution of jumping times follows an exponential decay. The jump direction 236
with the lowest time is chosen, the time and coordinate are updated, and the time is added to 237
the total travel time. This is repeated m times for each atom, and n trajectories (atoms) are 238
simulated, using the method of Djimbi et al. (2015). For each trajectory, the total time is 239
computed as the sum of the residence times in each site between jumps. The diffusion 240
coefficient is obtained by averaging over the ensemble of n trajectories. If <x2>, <y2>, <z2> are 241
the averages over the trajectories of the squares of distances between initial and final points in 242
x, y and z, <t> is the average time of the trajectories, and if we denote as Dx, Dy, Dz the diffusion
243
coefficient along the axes, then according to the Einstein relation. 244
𝐷𝑥 =<𝑥 2> 2<𝑡>
𝐷𝑦 = <𝑦2<𝑡>2> (Eq. 5) 246
𝐷𝑧 =<𝑧2<𝑡>2> 247
From the above relations the diffusion coefficients can be assessed even in the case of 248
anisotropic diffusion, as is necessary for zircon. The temperature dependence is obtained by 249
running the random walk at different temperatures. 250
To account for highly anisotropic behavior along the c axis and its possible obstruction, 251
the random walk operates on a sub-lattice of 1281284096 interstitial sites. When an atom 252
jumps against an edge of the sub-lattice it is automatically re-inserted into the opposite side, so 253
that the geometry can be considered as infinite with a periodicity given by the size of the sub-254
lattice. Obstructions are simulated by inhibiting some fraction of sites randomly distributed 255
over the sub-lattice. 256
2.4 3D diffusion modeling
257
Finally, these two descriptions provide a bulk diffusion coefficient, which is used to 258
calculate the diffusion over a finite grain where the surface is taken into account by solving in 259
3D the diffusion equation appropriate to surface boundary conditions. A modified version of 260
the rare gas 3D diffusion code published in Gautheron and Tassan-Got (2010) and used in 261
subsequent studies (Djimbi et al., 2015; Gautheron et al., 2009; 2012) has been implemented to 262
simulate He and Ne diffusion in zircon. This code solves the diffusion equation by a Monte 263
Carlo method at the macroscopic level, using the diffusivity extracted from the KMC 264
simulation. This approach accounts for crystal surface boundaries, which is not possible in the 265 KMC code. 266 3. Results 267
3.1. Investigation of He and Ne interstitial sites
268
Zircon crystallizes as a body-centered tetragonal unit cell, with a structure consisting of 269
a chain of alternating edge-sharing (SiO4) tetrahedral and (ZrO8) triangular dodecahedra
270
parallel to c-axis (Figure 2A and 2B). The lateral connection of these chains provides two types 271
of possible sites (S1 and S1’) into which He or Ne atoms can be inserted; these insertion site
272
positions, and the diffusion pathways between them, are identical He and Ne. The connection 273
of these interstitial sites provides open channels along each direction in which He or Ne could 274
diffuse (Figure 2A’ and 2B’). In this part of our analysis, a periodic–DFT is run first to build 275
an optimized model of zircon. Next, the model is used to identify diffusion channels and all 276
possible interstitial insertion sites for both He and Ne atoms. As mentioned above, a 2×2×2 277
supercell was optimized as the host lattice (Figure 2), which was large enough to simulate and 278
study the He and Ne insertion in the zircon crystal lattice free of boundary effects. 279
The c-axis channel is formed by alternating edge-sharing SiO4 tetrahedron and ZrO8
280
dodecahedron units (Figure 2A), and Figure 2A’ illustrates the different He (or Ne) insertion 281
sites along this pathway. In each c-channel four sites are inventoried for each lattice cell and 282
they are energetically identical due to the symmetries of the crystal. They are spaced by 1.5 Å. 283
Two types of sites are recognized: S1, which allows a jump to an adjacent c channel along a
284
(jump along b forbidden), and S1’, which allows a jump along b to an adjacent c channel. Along
285
c, the sites form a sequence S1-S1’-S1-S1’ … (Figure 2A’). Therefore, along a, diffusion
286
pathways connect S1 sites. The same applies along b with the S1’ sites. The channels along the
287
a- and b-axis are energetically identical and they will be noted a/b-(axis or channel) for
288
simplicity. To move along the a/b-axis, He (or Ne) atoms have to pass through a rhombic 289
(Rhom.) or rectangular (Rect.) gap as shown on Figure 2B’. The former is formed by the 290
intersection of Zr – Zr and O – O diagonals. The latter is formed by the intersection of Si – Si 291
and O – O diagonals, and its area is much larger than the rhombic gap. Each channel consists 292
of an alternating series of the two gap types (Figure 2B’); for example, along a the sequence is 293
S1-Rhom.-S1-Rect.-S1-Rhom.-S1-Rect. This configuration makes the a/b-channels 294
considerably less diffusive than the c-axis due to the narrow rhombic gaps. 295
After channel determination, the two possible interstitial sites, called S1 and S1’, were
296
optimized. They are structurally symmetrical and energetically equivalent. Only one interstitial 297
site environment exists for He and Ne, an octahedral-like site formed by the six oxygen atoms. 298
The interatomic He – O distances have three different values of 2.02, 2.22 and 2.36 Å. For the 299
Ne insertion case, the Ne atom is located 2.16, 2.30 and 2.42 Å from neighboring oxygen atoms. 300
These larger distances are due to the larger size of the Ne atom, making the relaxation effect 301
important for Ne. 302
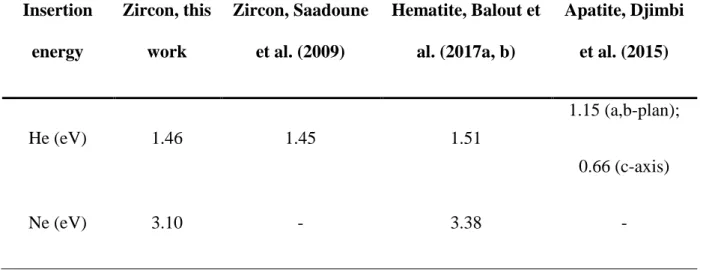
The insertion energies calculated based on equation 1 for He and Ne in the different 303
insertion sites are listed in Table 1. The derived helium insertion energy is 1.46 eV, which is in 304
good agreement with other DFT calculations performed by Saadoune et al. (2009) and for 305
comparison obtained insertion value in hematite is given (Balout et al., 2017a, b). In the case 306
of Ne, the insertion energy of 3.10 eV is almost twice that calculated for He. This is related to 307
the larger atomic radius of Ne, which must repel the neighboring atoms more to enter the 308
interstitial site. 309
3.2. Migration Energies (Emig)
310
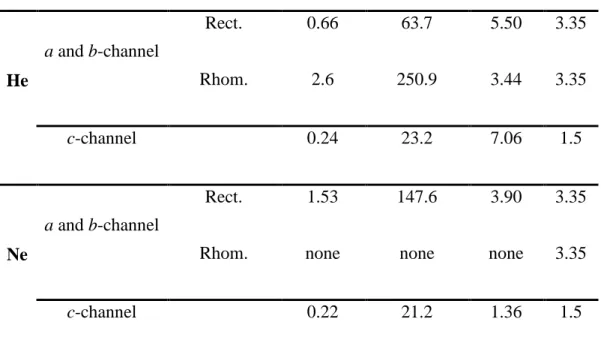
In the c-channel, since the inter-site distance S1 – S1’ is about 1.5 Å, only one image is
311
taken between the two sites for the NEB calculation. Figure 3A and 3A’ present the migration 312
energies path results along the c-channel for He and Ne migration, respectively. The migration 313
energies, reported in Table 2, are 0.24 eV for He (Figure 3A) and 0.22 eV (Figure 3A’) for the 314
Ne atom. According to a (b)-channel structures, the S1 (S1’) sitesare separated on one side by
315
a rhombic gap and on the other by a rectangular one. Hence, two NEB calculations were 316
performed for He and Ne migration, corresponding to the energy necessary to pass through 317
each gap. For NEB calculation in this channel we start with a linear path composed of a series 318
of 4 images connecting the two S1 (S1’) sites. After the relaxation process we found that the
319
migration energy between the sites separated by the rectangular gap is equal to 0.66 and 1.53 320
eV for He and Ne atoms, respectively (Table 2; Figure 3B). For the rhombic gap, we find a 321
migration energy of 2.60 eV for He, but for Ne the NEB calculation indicated that no migration 322
is possible (Figure 3B’). Figure 4 illustrates the sequence of the interstitial sites along c and 323
how they are connected to the pathways along a and b. 324
The paradoxical result is that along c the energy barrier for Ne is lower than for He, 325
even though its radius is larger as already recognized in the insertion energy calculation. This 326
can be understood by noting that the height of the barrier is a difference in energy. For Ne both 327
the energy in the interstitial site and at the top of the barrier are higher in comparison to He, 328
reflecting the atom radius effect, but this does not say anything about the difference. As a 329
conclusion, contrary to the insertion energy, the activation energy is not well controlled by the 330
ionic or atomic radius. This outcome was already evident in Farley (2007). 331
According to our results, one can say that, at low temperature, in an ideal crystal He and 332
Ne will diffuse mainly along the c-channel. However, as temperature increases, there will be 333
competition between the probability of jumping the 0.24 eV barrier and the 0.66 eV barrier in 334
the case of He diffusion. For Ne-diffusion, however, even at high temperature diffusion along 335
the c-axis remains strongly favored. 336
3.3. Ideal lattice results
337
Using Transition State Theory as presented in section 2, the attempt frequencies ν, 338
which allow determination of relative jump probabilities, were calculated for each jump case. 339
All calculated jump probabilities are provided in Table 3. From the parameters listed in this 340
table, the diffusion coefficient along the c-axis can be derived analytically for a pristine crystal: 341
𝐷𝑧 = 𝜈. 𝑎2. exp (−𝐸𝑘𝑚𝑖𝑔
𝐵𝑇) (Eq. 6)
342
with a=1.5 Å. In the same way the diffusivity along a and b for an undamaged crystal and for 343
practical temperatures (T<104 K) is obtained as: 344
𝐷𝑥𝑦 =𝜈.𝑎42. exp (−𝐸𝑟𝑒𝑐𝑡
𝑘𝐵𝑇) (Eq. 7)
345
with a=3.35 Å. The factor 4 accounts for the fact that only one site over four allows a jump in 346
a given direction (Fig. 4), as crossing the rhombic diamond is quasi-forbidden. 347
We get respectively for He and Ne: 348 𝐷𝑧,𝐻𝑒 = 1.6 × 10⁻⁷𝑒𝑥𝑝 (−0.24 𝑘𝐵𝑇) 𝑚 2⁄ 𝑠 (Eq. 8) 349 𝐷𝑥𝑦,𝐻𝑒 = 1.5 × 10⁻⁷𝑒𝑥𝑝 (−0.66 𝑘𝐵𝑇) 𝑚 2⁄ 𝑠 (Eq. 9) 350 351 𝐷𝑧,𝑁𝑒= 1.2 × 10⁻⁸𝑒𝑥𝑝 (−0.22 𝑘𝐵𝑇) 𝑚 2⁄ 𝑠 (Eq. 10) 352 𝐷𝑥𝑦,𝑁𝑒 = 1.1 × 10⁻⁷𝑒𝑥𝑝 (−1.53𝑘 𝐵𝑇) 𝑚 2⁄ 𝑠 (Eq. 11) 353
From these results one can conclude that Ne diffusivity is slightly higher at low 354
temperature than He diffusivity in a perfect zircon host lattice. In addition, the diffusivity is 355
highly anisotropic and diffusion occurs essentially along the c-axis. The anisotropy is even 356
stronger in the Ne case due to the high energy barrier when crossing the rectangular gap. 357
4. Discussion
358
4.1. He and Ne diffusion in non-damaged zircon structure
359
4.1.1. Comparison to previous calculations
360
Helium diffusivity in zircon, calculated by DFT and molecular dynamics, has already 361
been reported (Bengtson et al., 2012; Reich et al., 2007; Saadoune et al., 2009), and for 362
comparison the insertion energy and barriers are listed respectively in Tables 1 and 2. It is 363
interesting to point out that only Bengtson et al. (2012) recognizes the 1.5 Å inter-site distance 364
along the c-axis, which results from the crystal symmetries. Reich et al. (2007) and Saadoune 365
et al. (2009) missed this feature although a dip is visible in the energy landscape for the former, 366
indicating that the minimal energy path was not found along the c-axis. Concerning the 367
migration energies, which have the strongest impact on the diffusivity, we are in good 368
agreement with Saadoune et al. (2009) along the c-axis, and at variance with the other 369
calculations. Although we found the same energy pattern along this channel as Bengtson et al. 370
(2012), our migration energy is lower. As the variations of the energy along this channel are 371
small the computations of the barrier are very sensitive to the finding of the minimum energy 372
path. When comparing to the previous calculations along the a/b directions we find the same 373
barrier across the rhombic gaps, but a higher one through the rectangular gap (0.66 instead of 374
~0.45 eV, Figure 4, Table 2), for a reason which is not elucidated. We will see later that this is 375
barrier is the one that mainly controls the diffusivity in zircon in practical situations. 376
Concerning He diffusivity, differences exist with respect to the other calculations 377
beyond the migration energy. Reich et al. (2007) and Saadoune et al. (2009) used a 1D formula 378
which is known to be inadequate because it assumes that the energetic shape around the 379
interstitial site and the saddle-point is the same. However, this assumption only acts on the pre-380
exponential factor and its impact is limited. Bengtson et al. (2012) did not use this assumption 381
but assumed that along a/b the higher barrier (~2.6 eV) dominates, disregarding the relatively 382
easy intermediate jump along c that can bypass this barrier. This explains why they obtained a 383
very low diffusivity along a/b. 384
4.1.2. Comparison to experimental data
385
For Ne only one abstract reports diffusion data, with an Ea value of ~339 kJ/mol and
386
closure temperature of 396-410°C for a 10°C/Ma cooling rate (van Soest et al., 2013). This 387
value is much higher than that computed in this work. Similarly, He diffusion data obtained on 388
natural zircon crystals present significantly higher apparent activation energies than obtained 389
by theoretical studies. In addition, measured (U-Th)/He and (U-Th)/Ne zircon ages confirm that 390
He and Ne are strongly retained in this mineral. For illustration, Figure 5 presents some He 391
diffusion data obtained on natural zircon crystals (e.g., Reiners et al., 2004; Cherniak et al., 392
2009; Guenthner et al., 2013) compared to our data for a pristine zircon. In detail, Figure 5 393
shows the distribution of activation energy, frequency factor and closure temperature for He 394
obtained for natural zircon, and the deduced activation energy for Ne needed to explain a (U-395
Th)/Ne age (Gautheron et al., 2006). The authors based their estimate on the known thermal 396
history of the Gold Butte, Nevada area (Reiners et al., 2000) and measured ZNe ages (777±122 397
and 963±164 Ma) that are much older than the ZHe age (19.1±1.5 and 16.7±1.3 Ma 398
respectively). From this, they deduced a closure temperature for Ne in zircon of ~400±50°C, 399
similar to the diffusion data from Van Soest et al. (2013). The activation energy for Ne in zircon 400
should thus be greater than the one for He (i.e., >170 kJ/mol), as Ne appears much more strongly 401
retained than He (Figure 5), in contradiction with the result of our calculation in which a larger 402
diffusivity is found along c. Based on the linear relationship between Ea and closure
403
temperature, for Ne we can anticipate an activation energy value above ~170 kJ/mol, but we 404
cannot clearly define the upper limit, and the lower limit is below the value determined by van 405
Soest et al. (2013). 406
4.2. Processes modifying He and Ne diffusion
407
A strong discrepancy exists between results obtained using theoretical and experimental 408
approaches, leading to a misinterpretation of the validity of the theoretical method. However, 409
recent DFT studies on He and Ne diffusion in apatite (Djimbi et al., 2015) and hematite (Balout 410
et al., 2017a; b), which produce expectations consistent with experiments, bring a strong credit 411
to this theoretical approach. If the discrepancy is not due to a methodological issue, additional 412
features and processes are likely to be modifying He and Ne diffusion in zircon, as already 413
discussed by Reich et al. (2007), Saadoune et al. (2009) and Bengtson et al. (2012). 414
Until now, our calculation has only considered an ideal pristine crystal, but in real 415
crystals defects are present and change local diffusion properties. The defects can be 416
substitutions in which an atom of the ideal lattice (Zr usually) is exchanged for another, such 417
as a rare earth element. Another type is Frenkel pairs, consisting of an atom knocked out from 418
its original lattice site, leaving a vacancy, and inserted somewhere else. Frenkel pairs are 419
thermally activated and exist at any temperature, meaning that they can be created and 420
recombined by thermal motion. They are highly enhanced by irradiation due to the decay of U 421
and Th. The first effect of the alpha particle, and more strongly, the recoiling daughter is to 422
create Frenkel pairs by knocking atoms out of the lattice. For high radiation doses the density 423
of vacancies and interstitial atoms becomes high enough to make the lattice unstable, collapsing 424
it into amorphized zones. The diffusivity in such zones is not known and only hypotheses can 425
be proposed. Dislocations are yet another likely pervasive defect type that can alter diffusional 426
pathways. The detailed description of these defects is far beyond the scope of this work. 427
Similarly, meso-scale features that may alter diffusivity and retention, such as mineral and fluid 428
inclusions, are also beyond our scope. Our methodology is based on a simple modeling of their 429
effect on the diffusion of inserted He and Ne atoms, by considering that they diffuse in an ideal 430
crystal (Figure 6A) until they find some defect altering the diffusion (Figure 6B and 6C). We 431
address only two phenomena, obstruction and trapping. 432
Obstruction may occur when an interstitial atom, knocked out due to irradiation for 433
example, is already in an interstitial site, preventing He or Ne from entering the site. This 434
mechanism is efficient for slowing down diffusion along fast pathways along the c-axis in 435
zircon, because it requires the atom to jump over higher barriers to span long distances. The 436
motion is illustrated in Figure 6B, whereas Figure 6A shows the ideal case where the jumps 437
occur primarily along the c-axis due to the low barrier. Obstruction can also result from 438
chemical substitutions that alter the energetics along the diffusion pathway. This has been 439
shown to occur for Cl-rich apatite compared to F-apatite (Djimbi et al., 2015), although the 440
authors demonstrate that a significant effect on diffusion only occurs at a relatively high 441
substitution level (some dozens of percent of the halogen sites) in that mineral. For zircon, Hf 442
substitution can be quite important (some wt% percent, e.g., Hanchar and van Westrenen, 2007) 443
and will modify He diffusivity. Dislocations could also lead to obstruction by a local shrinking 444
of the original cell. In Figure 6B for example, the He atom first diffuses along the c-axis and 445
crosses the rhombic gap but is then blocked due to the obstruction. Finally, the He atom will go 446
back as it will demand too much energy to cross the rectangular gap, where the migration energy 447
is 2.6 eV (251 kJ/mol). As already emphasized in Djimbi et al. (2015), obstruction is very 448
efficient in reducing diffusion anisotropy, which is an important feature in the case of zircon. 449
The other effect we consider is trapping. This phenomenon has been already considered 450
in several works (Farley, 2000; Shuster et al., 2006; Gautheron et al., 2009; Flowers et al., 2009; 451
Shuster and Farley, 2009; Gerin et al., 2017) and can result from different kinds of defects. 452
When vacancies are created, in particular under irradiation, they offer more space to the 453
diffusing atom at lower energy. Therefore additional energy, noted (EaT), is necessary to
454
extract it from its location and bring it to a normal interstitial site. In general, trapping may 455
occur in any situation where the interstitial atom has more space to be accommodated. The 456
amorphized zones could offer this more open space and serve as He and Ne storage. If the zones 457
are not interconnected, diffusion still occurs through an ideal lattice endowed with trapping 458
volumes. Even substitutions in some cases can act as traps. Saadoune and de Leeuw (2009) 459
demonstrate that when U4+ and Pu4+ are present at the percent level in the zircon lattice in the 460
vicinity of an He insertion site, U and Pu increase He solubility by decreasing He insertion 461
energy, leading to a trapping effect. 462
Radiation damage is the favored mechanism producing trapping because it creates 463
vacancies, and in the case of zircon amorphized zones (Figure 6C). This mechanism was 464
initially proposed for apatite, where radiation damage strongly influences He diffusion by 465
trapping He inside damage (Farley, 2000; Shuster et al., 2006). As a guideline, the maximum 466
available trapping energy corresponds to a case where the diffusing atom is far from its 467
neighbors, such as in a cavity (large damage, voids, fluid inclusions). Any short distance to its 468
neighbors will repel it and increase its energy, thereby reducing (EaT). The extreme case where
469
the atom is far from any other atom is equivalent to an atom outside of the crystal, and in this 470
case the trapping energy is merely the insertion energy. Therefore, the maximal trapping energy 471
is the insertion energy. The only exception to this rule would occur if atoms in the crystal would 472
interact with the He or Ne by attracting it. Gerin et al. (2017) described the energetics of this 473
process for apatite but similar conclusions can be drawn for zircon. As the insertion energy is 474
1.46 and 3.1 eV for He and Ne respectively, one can infer that the maximal trapping energy for 475
large damage such as recoil damage (EaT) will be respectively 1.46 eV (with global Ea 1.7
476
eV = 1.46+0.24 eV; 164 kJ/mol) and 3.31 eV (with global Ea 3.32 eV = 3.10+0.22 eV; 320 477
kJ/mol). In crystals with real damage, different geometries of defects are present, entailing a 478
distribution of EaT. In addition, when radiation damage accumulates vacancies can connect
479
creating larger spaces, increasing the trapping energy. Figure 6C illustrates a diffusion 480
trajectory with different topologies of damage, with small damage (such as point defects), single 481
recoil damage or recoil damage clusters. The EaT will be different for each case according to
482
the available free space. An important feature of trapping is that, unlike obstruction, it has no 483
effect on the anisotropy of diffusion, so that it cannot be responsible for the reduction of the 484
anisotropy in case of zircon, although it has the capability to reduce diffusivity strongly, and 485
may be spatially associated with other defects. 486
4.3. Impact of blocking pathways, i.e. obstruction, on He and Ne diffusion in zircon
It is expected that atoms displaced into the c-axis channel as a result of radiation damage 488
strongly affects diffusion along c, which is quasi-free at normal temperature in an ideal lattice. 489
In this section, we test the obstruction model using the KMC method and discuss the impact of 490
obstructed pathways on He and Ne diffusion coefficients, by using the model described in 491
section 2.3; additional details are given in Appendix A. 492
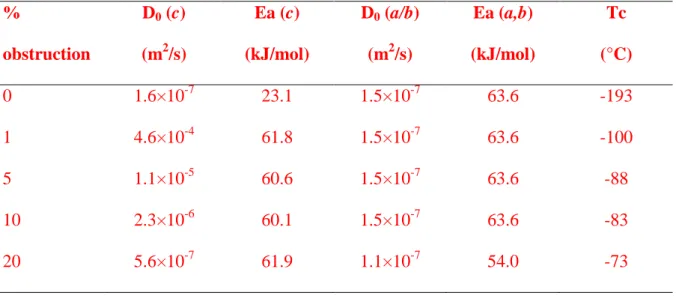
Figure 7 presents the dependence of the diffusion coefficient Da,b and Dc (respectively
493
along a, b and c-axis) as a function of inverse temperature for a set of fractions of obstructed 494
sites (1, 5, 10, 20%). We define the obstruction level as the fraction of sites occupied. In the 495
hypothesis of obstructions produced by displaced atoms, the obstruction level is the fraction of 496
displaced atoms multiplied by 1.5, because there are 1.5 more atoms than interstitial sites S1 497
and S1’. Therefore, the considered set of obstruction levels corresponds respectively to 0.7, 3.3, 498
7, 13% of displaced atoms. Table 4 provides all obtained diffusion coefficients (Ea and D0)
499
along the a/b-axis and c-axis and associated closure temperatures 500
Along a- and b-channels the diffusion coefficient (Da,b or Dx,y) is only slightly affected
501
by the amount of obstruction (Figure 7A). The curves do not diverge significantly from each 502
other; at most the 20% case reduces the diffusivity slightly, keeping the same slope defined by 503
the barrier of 0.66 eV. Along the c-channel, obstruction strongly affects diffusivity (Dc or Dz),
504
especially at low temperature where the slope of the diffusion behavior changes significantly 505
(Figure 7B). An important result is that, surprisingly, the impact of obstruction on 3D diffusion 506
is higher at low temperature with an important deviation from the ideal lattice. As the fraction 507
of obstruction increases the dependence moves closer to the a/b diffusivity. For T<300°C all 508
the curves are almost straight lines parallel to the a/b Arrhenius law, implying similar activation 509
energy, but with D0 scaling down as the level of obstruction increases.
510
As soon as the latter exceeds 1%, He diffusion along the c-axis is significantly blocked 511
leading to a change in diffusivity. One particular outcome is that the anisotropy, which was 512
very strong in the ideal lattice, is reduced by a factor depending of the level of obstruction, but 513
almost independent of the temperature. For example, at 10% obstruction the anisotropy drops 514
down to 20. It is worth noting that the above key trends are observed experimentally by 515
Guenthner et al. (2013), who show that He activation energy orthogonal to c is only slightly 516
affected by damage, whereas with increasing damage diffusion along c approaches a constant 517
Ea close to that of the transverse direction. This experimental effect is reproduced by our
518
calculation. It reduces the anisotropy, compared to ideal crystal, and cannot be explained by a 519
trapping effect alone. However, our modeled activation energy in any direction remains much 520
smaller (64 kJ/mol) in comparison to those measured in natural zircon (Reiners et al., 2004; 521
Guenthner et al., 2013), which are around 169 kJ/mol. 522
In conclusion, although obstruction strongly slows down He diffusion along c, it is not 523
the primary parameter that drives retentivity of He in natural zircons. However, obstruction is 524
the main parameter acting on the anisotropy of diffusion, reducing it strongly with respect to 525
the ideal lattice case. 526
For Ne the change of diffusivity with obstruction is not progressive but total. At 527
obstruction levels as low as 1%, Ne diffusion is already frozen because the activation energy 528
along the a- and b-axes is so high (147 kJ/mol, Table 3). Nevertheless, as with He, diffusion 529
pathway obstruction alone cannot reproduce the inferred natural Ne diffusion behavior of 530
zircon; as described in section 4.2, an activation energy >180 kJ/mol is necessary to reproduce 531
Ne ages (Gautheron et al., 2006), well above the maximum activation energy of ~147 kJ/mol 532
obtainable from obstruction. Thus, for He and Ne, pathway obstruction mechanisms are not 533
sufficient to block He and Ne diffusion in zircon to the degree observed in natural specimens. 534
4.4. Impact of traps on He and Ne diffusion in zircon
535
In this section, the trapping model is tested and the amount of trapping energy necessary 536
to reproduce the inferred natural He and Ne diffusion coefficients is discussed. For this purpose, 537
the model published in Gerin et al. (2017) is used where the diffusion coefficient modified by 538
damage, denoted 𝐷̃, follows a formula (eq. 12) that includes a trapping term: 539
(Eq. 12) 540
Where D(T) is the diffusion coefficient of undamaged zircon (data from this study), f is 541
the damage fraction ranging from 0 to 1, representing the normalized amount of displaced atoms 542
in the structure, and EaT is the additional activation energy necessary for an He or Ne atom to
543
jump out of the trap to the next insertion site. Appendix B provides a complete explanation and 544
demonstration of the equation, and the conversion between damage fraction and alpha dose. In 545
this study, the trapping model is correct only if damage stays as an isolated trap and does not 546
form a percolating network connecting to the grain surface, as then it would not be a trap 547
anymore. 548
The evolution of the simulated He closure temperature using Eq. 12 to account for 549
equivalent alpha dose is reported in Figure 8A, for a 60-µm radius spherical grain. The 550
simulation was done for Ea values of 40, 80, 120 and 140 kJ/mol, where 140 kJ/mol is the
551
maximum predicted value from the insertion energy (EaT) (see section 4.2). One can observe
552
from Figure 8A that a minimum Ea of 120kJ/mol is necessary to reproduce retentive behavior
553
in low-damage zircon of Guenthner et al. (2013). Interestingly, the activation energies and 554
closure temperatures reported in Figure 8B are similar to those reported for natural samples in 555
Figure 5B, lending support to the idea that our calculations have reproduced the natural range 556
of trap diffusivities quite accurately. For Ne, a similar simulation was done for the same 60-µm 557
radius zircon, and results are reported in Figure 8C and D for Ea of 160,200 and 300 kJ/mol,
558
as these values bracket the needed trapping to reproduce the inferred Ne closure temperature. 559
One can note that a trapping energy of ≥200 kJ/mol is necessary to reproduce the inferred Ne 560
closure temperature. The data from van Soest et al. (2013) could not be used in this figure as 561
the required information are not given in the conference paper. However, we note that the sum 562
of the insertion and migration energies we calculated for Ne corresponds to 320 kJ/mol, which 563
is comparable with the van Soest et al. (2013) value, and compatible with their Tc range if D0
564
is adjusted. 565
For He, closure temperature will increase with the equivalent alpha-dose for relatively 566
low trapping energy Ea (<40 kJ/mol). It seems paradoxical that the closure temperature 567
depends only slightly on the damage fraction, as illustrated in Figure 8A, but this is well 568
understood as this fraction shows up in the pre-exponential factor f in Eq. 12, whereas the 569
activation energy is in the exponential, giving rise to a much stronger effect. In other words 570
when the trapping energy is high most of the helium is trapped, whatever the number of traps 571
provided it is higher than the number of helium atoms, and only a high temperature (some 572
hundreds of °C during geological time) can extract them from the traps. This effect has been 573
seen with the DFT calculation in zircon (Saadoune and De Leeuw, 2009) and apatite (Gerin et 574
al., 2017), yet the damage topology between the two minerals is different. However, in the case 575
of zircon a higher trapping energy is needed to reproduce experimental data with respect to 576
expectations and calculations for apatite (~30-40 kJ/mol for apatite (Gerin et al., 2017; Shuster 577
and Farley, 2009) compared to 120-140 kJ/mol for zircon). The difference can be explained by 578
the higher insertion energy for He and even higher for Ne (Table 1) in zircon compared to 579
apatite (~0.6 to 1 eV; Djimbi et al., 2015), as modification of the crystal structure during damage 580
creation will produce a site more energetically favorable compared to the lattice. In this case, 581
the insertion energy strongly drops, leading to an increase of the trapping energy until a 582
threshold EaT. The higher necessary trapping energy can be explained by the damage topology
583
in zircon, as the crystal structure behaves quite differently than apatite. It is well known that 584
natural apatites are almost always crystalline in contrast to zircon, which is often reported to be 585
partially or fully metamict (e.g. Ewing et al., 2003); additional infomation on damage can be 586
found in Appendix B. 587
4.5. Damage percolation threshold
588
For zircon, at high dose, several authors have reported that damage overlap or 589
percolation may create amorphous zones (e.g. Ewing et al., 2003; Pidgeon, 2014; Salje et al., 590
1999). The more recent amorphous-crystal threshold has been estimated to be at ~2.21018 /g 591
(Pidgeon, 2014), which has been interepreted as the recoil percolation damage threshold 592
(Trachenko et al., 2003). The transition to rapidly rising diffusivity occurs at ~21018 /g in the
593
diffusivity data set used by Guenthner et al. (2013), although data by Anderson et al. (2017) 594
suggest a lower value at 2-51017 /g. In addition, Ketcham et al. (2013) calculated that alpha 595
recoil and fission damage percolate at different thresholds than previously assumed (~21016 596
and ~21017 /g for alpha-recoil damage in 6-8-step decay chains and isolated decays (no-597
chain) respectively, and ~21018 /g for fission tracks), due to the elongate nature of recoil and 598
fission damage not taken into account by Trachenko et al. (2003). 599
Recent ZHe data measured in Hercynian granites from the Pyrenees (Bosch et al., 2016; 600
Vacherat et al., 2016) exhibit age versus maximum alpha dose correlations that suggest that this 601
retentivity maximum may be reached at ~2-51017 /g (Figure 9). It is not straightforward to
602
estimate the effective alpha dose needed to explain an age-eU pattern, so we have provided two 603
solutions. First, as an end-member over-estimate, we simply retain all damage for each grain 604
throughout its entire history since crystallization at 305 Ma (U/Pb age); the dose can be no 605
higher than this (Figure 9A). Second, we posit that the divergence of measured ages was due to 606
a reheating and partial resetting event at some time in the past that caused more He loss in the 607
less retentive grains, and so we should consider only the possible damage production prior to 608
that event. A conservative estimate for its timing is the age of the youngest grain, leading to the 609
relationship shown in Figure 9B. Even this dose is likely to be a significant over-estimate of 610
the pertinent dose for explaining the spread in ages, as it presumes that after crystallization 611
damage retention began immediately. 612
The implied transition dose from increasing to decreasing He retentivity is significantly 613
lower than to the one considered in the RDAAM model of Guenthner et al. (2013) and is closer 614
to the no-chain alpha recoil percolation level calculated by Ketcham et al. (2013). The no-chain 615
case is a possibly more appropriate approximation for connectivity that leads to fast pathways, 616
as the connectivity due to U and Th decay chains is “tip to tip”, and thus dominated by 617
potentially obstructed regions at the boundaries of tracks. The dose range over which the non-618
chain percolating network expands to encompass the majority of recoil damage roughly 619
coincides with the negative dose-age correlation in the Pyrenean samples, in the range 2 to 620
51017 /g, significantly below the dose range where the Guenthner et al. (2013) model 621
postulates a fall in retentivity (above ~2×10¹⁸ /g). Such a lower alpha dose threshold for
622
percolation can also explain why samples in old and stable crustal blocks (Reiners et al., 2005) 623
often displays only negative correlations between ZHe and eU (a proxy used for the alpha dose). 624
In such cases the maximum potential retentivity that connects negative and positive correlations 625
could not be documented because it would correspond to very low and atypical U 626
concentrations for zircon. 627
We infer from the Pyrenean samples that the recoil damage threshold will be at a value 628
ranging around ~2-51017 /g, as already proposed by Anderson et al. (2017), far below the 629
~21018 /g proposed by Guenthner et al. (2013). 630
4.6. Implication for zircon (U-Th)/He and (U-Th)/Ne thermochronometry
631
He and Ne diffusion coefficients in 3D obtained in this study and the investigation of 632
mechanisms that can modify He and Ne diffusivity demonstrate that obstruction and trapping 633
alter diffusivity significantly (Figure 10). Based on atomic investigation of He diffusion 634
energetics, we can predict how He will diffuse in the zircon structure. Figure 10A provides a 635
schematic illustration of a diffusion pathway as postulated by our work. The He atom will 636
diffuse primarily along the c-axis following a random diffusion pathway. He diffusion is 637
facilitated along the c-axis because of the low migration energy; obstruction could slightly 638
change the trajectory but the He atom can diffuse easily along the a-axis to get around any 639
obstructed pathway. Following the example pathway of Figure 10A, the He atom is trapped in 640
a large defect (i.e. recoil damage, voids, fluid inclusion), with a very low insertion energy 641
(potentially approaching 0). The He atom will need a maximum activation energy of 1.7 eV 642
(<164 kJ/mol) to go back to the crystal lattice (Fig. 10A). After that He diffuses again easily in 643
the lattice from site to site along the a-axis and c-axis (passage through the rhombic gap is 644
insignificant due to high migration energy, Fig. 4), until it reaches a second large energy well. 645
In this case the damage is connected to other damage extending to the crystal surface (Fig. 646
10A). In terms of energy, we can infer from our model that in the connected area, because the 647
lattice is distorted, the migration energy may be lowered. He insertion energy is thus very low 648
and the He atom will diffuse in the connected damage zone with lower energy barriers. In Figure 649
10A, we predict that the He migration in the damage ranges from 1.4 to 0.9 eV (135 to 87 650
kJ/mol). Indeed, several geological studies show that for high damage dose, ZHe ages are 651
similar to AFT ages (see Fig. 9 for the Pyrenean case example), and in some cases are even 652
younger or equivalent to AHe ages (Johnson et al., 2017). This implies that at high dose (>1018
653
/g), He retentivity is low in damage zone, with Tc of 110 to 50°C and thus Ea of 135 to 90 654
kJ/mol. We thus anticipate that, as opposed to the harmonic averaging model by Guenthner et 655
al. (2013), diffusivity in zircon after the percolation transition may be controlled by the 656
energetics and topology of the damage network. 657
Figure 10B combines our modeling of trapping and obstruction with natural data in 658
terms of the closure temperature evolution as a function of the alpha dose. First, obstruction of 659
diffusion pathways reduces diffusivity, not as efficiently as trapping but possibly enough to 660
play a role in addition to it. Indeed, at sufficient obstruction levels (> 20% for He and 1% for 661
Ne), diffusion for He and Ne will be only possible when it includes a component of motion 662
along the a- and b-axis (Table 3). The resulting diffusion behavior will still not be retentive 663
enough to reproduce natural data, however. He and Ne global activation energy Ea values are 664
respectively 63 kJ/mol and 147 kJ/mol, while values of 120-140 kJ/mol and >180 kJ/mol are 665
needed (Figure 10B for He). The 20% obstruction level corresponds to 13% of atoms displaced 666
(and so to an equivalent dose of ~1018 /g) as explained in Appendix B, and corresponds to an 667
equivalent closure temperature of approximately -75°C assuming a D0 of 1.510-7 m2/s. This
668
value is not very tightly constrained, but provides a reasonable, illustrative first estimate of He 669
retention. 670
If our modeling is correct, it is possible to make some predictions. First, for He and Ne, 671
a quite high trapping energy is necessary to reproduce closure temperatures inferred from 672
natural samples (Figure 8 and Figure 10B), and we predict maximum possible trapping energies 673
with EaT of 140 kJ/mol (Emig=1.46 eV) and 300 kJ/mol (Emig=3.10 eV) for He and Ne
674
respectively. These trapping energies (EaT) are within the limits provided by our DFT
675
calculations, as discussed in section 4.2. It means that the total energy needed to go back in the 676
crystal structure will be 164 kJ/mol (Einsertion + Emig=1.7 eV) and 320 kJ/mol (Einsertion +
677
Emig=3.32 eV) for He and Ne respectively. Second, based on published very young volcanic
678
zircon of ZHe ages coherent with other methods (e.g. Farley et al., 2002), we can infer that for 679
low alpha dose (~1-2x10¹⁵ /g), He is retentive to surface temperature implying a Tc of ~60-680
100°C (Fig. 10B). Between low damage and the threshold, we could anticipate that Tc may 681
increase following a non-linear (i.e. cubic or exponential) law as is the case for apatite (Flowers 682
et al., 2009), as Ea increases until the EaT threshold (Fig. 10B). As damage fraction
683
increases, clustering increases also and damaged domains with different sizes will form. In this 684
case, the trapping energy can increase as proposed by Recanati et al. (2017) for apatite. It is 685
interesting to note that the highest closure temperatures obtained by Guenthner et al. (2013) can 686
be explained by increasing trapping energy when damage dose increases up to a maximum (Fig. 687
8A). For Ne, the maximum activation energy predicted in this study is similarly very close to 688
the one reported by van Soest et al. (2013), and we can anticipate a complex relationship of Ne 689
diffusion with damage dose similar to He. 690
After some damage threshold, He diffusion increases (Tc decreases), although the 691
Pyrenees samples (Bosch et al., 2016; Vacherat et al., 2016) and work of Johnson et al. (2017) 692
indicate that the threshold dose may be lower than indicated by Guenthner et al. (2013). The 693
source of this discrepancy may be a complex function of damage accumulation and annealing, 694
and more work on this issue is essential. For example, Ginster et al. (2018) document a 695
complicated relationship between damage dose and annealing rate, implying a very complex 696
system. 697
The other implication for a maximum of retentivity located in the vicinity of the no-698
chain alpha damage percolation level (Fig. 9) would be that the dependence of closure 699
temperature on damage fraction increase can be significantly steeper than modeled with Eq. 12 700
(Fig. 10B) if a single EaT value is assumed. This additional level of complexity will also have
701
implications for developing very precise future quantitative models to predict individual TC
702
values for single zircon grains. Such a potential scenario supported by natural data will require 703
new experimental diffusion data to document carefully this key window of alpha-dose in the 704
range of the no-chain percolation level. 705
5. Conclusions
706
In this contribution, we have used a series of computational and theoretical tools to 707
provide a mechanistic view of the manner in which He and Ne diffuse in zircon. In particular, 708
we have characterized the undamaged crystalline state and its energy structure at the atomic 709