HAL Id: hal-01671874
https://hal.archives-ouvertes.fr/hal-01671874
Submitted on 22 Dec 2017
HAL is a multi-disciplinary open access
archive for the deposit and dissemination of
sci-entific research documents, whether they are
pub-lished or not. The documents may come from
teaching and research institutions in France or
abroad, or from public or private research centers.
L’archive ouverte pluridisciplinaire HAL, est
destinée au dépôt et à la diffusion de documents
scientifiques de niveau recherche, publiés ou non,
émanant des établissements d’enseignement et de
recherche français ou étrangers, des laboratoires
publics ou privés.
A coronary artery segmentation method based on
multiscale analysis and region growing
Asma Kerkeni, Asma Benabdallah, Antoine Manzanera, Mohamed Bedoui
To cite this version:
Asma Kerkeni, Asma Benabdallah, Antoine Manzanera, Mohamed Bedoui. A coronary artery
seg-mentation method based on multiscale analysis and region growing. Computerized Medical Imaging
and Graphics, Elsevier, 2016, 48, pp.49 - 61. �10.1016/j.compmedimag.2015.12.004�. �hal-01671874�
A Coronary Artery Segmentation Method Based On MultiScale Analysis And
Region Growing
Asma Kerkenia,∗, Asma Benabdallaha, Antoine Manzanerab, Mohamed Hedi Bedouia
aLaboratoire Technologie et Imagerie M´edicale, Facult´e de M´edecine, Universit´e de Monastir, Tunisie bUnit´e d’Informatique et d’Ing´enierie des Syst`emes, ENSTA-ParisTech, Universit´e de Paris-Saclay, France
Abstract
Accurate coronary artery segmentation is a fundamental step in various medical imaging applications such as stenosis detection, 3D reconstruction and cardiac dynamics assessing. In this paper, a MultiScale Region Growing (MSRG) method for coronary artery segmentation in 2D X-Ray angiograms is proposed. First, a region growing rule which incorporates both vesselness and direction information in a unique way is introduced. Then an iterative multiscale search based on this criterion is performed. Selected points in each step are considered as seeds for the following step. By combining vesselness and direction information in the growing rule, this method is able to avoid blockage caused by low vesselness values in vascular regions, which in turn, yields continuous vessel tree. Performing the process in a multiscale fashion helps extracting thin and peripheral vessels often missed by other segmentation methods. Quantita-tive evaluation performed on real angiography images shows that the proposed segmentation method identifies about 80% of the total coronary artery treein relatively easy images and 70% in challenging caseswith a mean precision of 82% and outperforms others segmentation methodsin terms of sensitivity. The MSRG segmentation method was also implemented with different enhancement filters and it has been shown that the Frangi filter gives better results. The proposed segmentation method has proven to be tailored for coronary artery segmentation.It keeps an acceptable performance when dealing with challenging situations such as noise, stenosis and poor contrast.
Keywords: Coronary Artery, Hessian, Segmentation, Region Growing, Multiscale, Vesselness, Direction
1. Introduction
X-ray Coronary Angiography (XCA) is the gold standard for the assessment of clinically significant coronary artery diseases (CAD)[1]. The angiograms obtained by the XCA enable to reveal the initial CAD symptoms by the morphological features of the coronary arteries such as diameter, length, branching angle, and tortuosity. However, complex vessel structure, image noise, poor contrast and non-uniform illumination make vessel tracking a tedious task.
∗Corresponding author at
Laboratoire Technologie et Imagerie M´edicale, Facult´e de M´edecine de Monastir,Rue Ibn Sina, 5019, Monastir, Tunisie
Accurate coronary vessels detection is a fundamental step in various medical imaging applications such as stenosis detection [2], 3D reconstruction [3] and cardiac dynamics assessing [4]. Vessel detection is generally related to two important tasks which are vascular features enhancement and blood vessel segmentation.
The enhancement step aims to improve the vessels delineation while reducing background artefacts. So far, a variety of vessel enhancement methods have been proposed [5, 6, 7, 8, 9, 10, 11, 12, 13]. Truc et al. [14] distinguish three method classes : linear filtering [15], non-linear anisotropic filtering [16, 17] and Hessian-based multiscale filtering[5, 6, 7, 8, 9, 10].
Linear enhancement methods generally use Gaussian kernels or Gabor filters in order to denoise images. They are inappropriate to complex vascular structures since they blur vessel borders as well as thin vessels.
Unlike the linear smoothing filters, non-linear anisotropic diffusion filtering adjusts the filter for local variations by acting mainly along the preferred structure direction [16]. Hence, important features are better preserved during the smoothing process. Those filters are widely applied in many image processing tasks such as fingerprint image filtering [18], Optical Coherence Tomography image denoising [19] and cell membrane enhancement [20]. The main drawback of diffusion based methods is that they usually act at a fixed scale and are therefore unable to detect vessels within a wide range of size.
Most of the research on vessel enhancement falls into falls into Hessian-based methods. These methods utilize the second order derivatives matrix (Hessian matrix ) of the image intensity in order to detect tubular-like structures. For that,the Hessian matrix at each pixel is computed by convolving the initial image with second-order Gaussian derivatives. Then, the Hessian eigenvalues and/or eigenvectors are often used to propose a vesselness measure which can be interpreted as the probability of belonging to a blood vessel of a pixel. The vesselness generates maximum response at the scale which matches the diameter of the vessel to be detected. The main advantage of methods in this category is that can perform in a multiscale fashion, thus detecting different sized objects.
In [21], the authors compared four different Hessian-based multiscale filters, namely those proposed by Koller [5], Sato [6], Frangi [7] and the Vessel Enhancing Diffusion (VED) filter. VED is a diffusion filter built upon the Frangi filter. It can be seen as a generalization of anisotropic diffusion to iteratively smooth the image, while preserving the vessel structure [17]. This filter was initially proposed by [22] and extended by Manniesing et al. [17] who added a smoothness constraint and an enhanced scheme. Results of this study showed that the two latter outperform the others with a far better background suppression performance and vascular structure enhancement.
The second important step in vascular analysis is vessel segmentation. Existing segmentation methods can be divided into two general categories [23]: skeleton based, and non-skeleton based. The principle of skeleton-based techniques is the segmentation of vessels by first detecting the centerlines, then estimating the vessel width. A typical problem with this class is that it can fail to approximate the vessel segments which present stenosis and bifurcations. Non-skeleton-based segmentation techniques, on the other hand, are those that extract the vessels directly. Methods in this category vary from thresholding [24, 25, 26, 3], region growing [27, 28, 29, 30, 31, 32, 33], fuzzy clustering [34], mathematical morphology [35, 36, 13], deformable models such as active contour and level set [37, 38, 39, 40]
to graph cuts [41, 42, 43]. A more general review on vessel segmentation can be found in [44] and [45]. Hereafter, we especially focus on region-based vessel segmentation which is used in our work. Region-growing has been widely used for image segmentation [46], and in particular medical image applications such as vessel extraction. The rationale for this popularity is that these methods are based on a connectivity assumption, which is naturally suited to the case of the vascular trees [47, 48]. Region-growing incrementally segment an object by recruiting neighboring pixel starting from seed points or regions located inside a vessel based on some inclusion rule. Defining a robust region growing rule for X-ray vessel segmentation may encounter several difficulties such as image artefacts, lesions, noise and very low contrast between the vessels and the background particularly in thin vessels location. Therefore, classical region growing methods based on grey level values and/or spatial proximity are often sensitive to noise, and inhomogeneous contrast, which often leads to false negative (holes), false positive (leakage) and unwanted stop of region-growing [45].
In coronary artery angiograms, several factors such as image artefacts, stenosis and noise may introduce discon-tinuities, hence region growing may result in holes and over-segmentation. To avoid such problems, the growing process was performed in many frames of the same sequence in [27]. Although discontinuities may be avoided by temporal tracking, other difficulties such as centerline matching and user interaction in each step are necessary in this approach.
Instead of using the intensity feature in the growing process, authors in [49] incorporate the Frangi vesselness filter [7] in order to introduce more seed points when the growing process stops.
In [31], the authors proposed a novel vesselness function and performed vessels segmentation in two steps. First, large vessels are extracted from the maximum vesselness response by region growing. However, this final vesselness response given by the maximum response among the scale space may present low values for thin vessels, junctions and stenosis location. Thus discontinuities may occur if the growing process is applied directly on this final vesselness image. That’s why a detail repairing process is launched in order to extract thin vessels using a direction information given by the first directional derivatives i.e. image intensity gradient.
Combining the vesselness function with a directional information for vessel tracking is certainly a good idea but the image gradient isn’t, in our opinion, the appropriate direction information descriptor. A more precise direction de-scriptor would be given by the Hessian matrix eigenvectors.
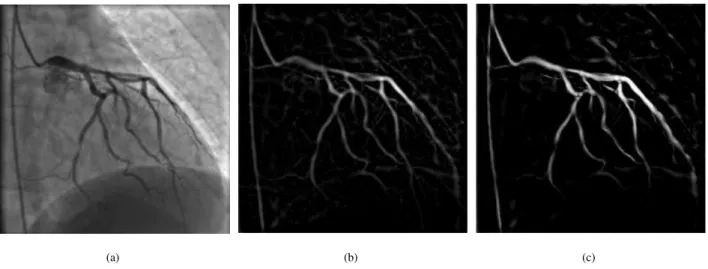
This idea was investigated in [50] where the authors combined the Sato vesselness function [6] with the line direction information given by the first Hessian eigenvector to guide the segmentation of 3D blood vessels. As discussed in [21], the Sato filter is more sensitive to noise than the Frangi filter when applied to 2D X-ray angiograms. Fig.1 shows that background noise is better removed by the Frangi filter than the Sato one.
In this paper, a multiscale vessel segmentation method for X-ray coronary angiography images is presented. This method takes advantages from multiscale Hessian analysis strength and aims to overcome the two major problems encountered in region growing techniques which are the difficulty of detection of poorly enhanced vessel segments and the occurrence of false positives [50].The major contributions of this paper is threefold: (1)From methodological
(a) (b) (c)
Figure 1: Vessel enhancement with two different filters: (a) original image; and images enhanced by the (b) Sato and (c) Frangi filters.
point of view, we combine both Hessain geometrical features which are eigenvalues and eigenvectors to define a robust new region growing criterion tailored to the coronary artery segmentation problem. This criterion is integrated into a mulitscale region growing algorithm ensuring the detection of different sized vessels. (2) We propose an evaluation database containing two datasets with different challenging degrees, which allow the quantitative evaluation of the method in terms of region overlap, sensitivity and precision. To the best of our knowledge, there is no standard database available for this task. The only database available in the literature was proposed by [43] and was designed to evaluate centerline extraction methods rather than segmentation evaluation. (3) We evaluate our method from two aspects which are the enhancement filter and the segmentation methods.The remainder of this paper is organised as follows. In section 2, background concepts related to our approach are reviewed. Section 3 illustrates the proposed method in detail. Experiments are described in section 4. Some illustrative results are given in section5. Section 6 presents discussion and concluding remarks.
2. Background on Multiscale Analysis
The idea of multiscale image analysis is to add a new dimension to the analysis which is the image scale. The image is transformed into a set of blurred images, each representing the original image, but at a different scale [51]. These blurred images are obtained by convolving the initial image I0(p) = I0(x, y) with a Gaussian kernel to represent the information at a certain scale.
Iσ(p) = Iσ(x, y) = I0(x, y) ⊗ Gσ(x, y) (1)
where Iσ is an image of the scale space, p= (x, y) is a pixel location, ⊗ represents the convolution operation and
Gσ(x, y) is the 2D Gaussian kernel with standard deviationσ defined as:
Gσ(p) = Gσ(x, y) =√ 1
2πσ2exp−
(x2+ y2)
whereσ ∈ Σ = {σmin, ..,σmax},σminandσmaxare set according to the approximate width of the smallest and largest
vessel to be detected [51].
In the scale space framework, differentiation is defined as a convolution with derivatives of Gaussian: ( ∂ n1+n2I ∂xn1∂yn2)σ= I ⊗ ∂n1+n2G σ ∂xn1∂yn2 (3)
Thus, the Hessian matrix which is the second order derivative of an intensity image in the scale space can be obtained at each point by Eq.4:
Hσ(p) = ∂2I σ(x,y) ∂ x2 ∂2I σ(x,y) ∂ y∂ x ∂2I σ(x,y) ∂ x∂ y ∂2I σ(x,y) ∂ y2 . (4)
The Hessian matrix is symmetric, therefore has two real eigenvaluesλ1andλ2and two associated eigenvectors e1 and e2. The signs as well as the relative and absolute magnitudes of eigenvalues characterize the local shape of the intensity in the image. If we assume that we seek to characterize black vessels on a white background, which is the case of the angiography images, a pixel belonging to a vessel region will be given by small (ideally 0)λ1and a high positive value ofλ2(withλ1<λ2).
2.1. Frangi Vesselness Filter
Frangi et al. [7] note that the Hessian eigenvalues ordered by magnitude (i.e|λ1| < |λ2|) are geometrically inter-preted as principal vessel curvatures and provide a vesselness measure on the basis of this observation. They introduce two measures to describe structures in images: Rb=λλ12 is the blob-like structure measure and S= kHkF=
q
λ2 1+λ22, the Frobenius norm of the Hessian matrix, is the second-order structureness measure. These measures were combined in a vesselness function as given by Eq.5.
Vσ(p) = 0 ifλ2<0 exp(− R2b 2β2)(1 − exp(− S2 2c2)) otherwise. (5)
Where parametersβ and c are thresholds which control the filter’s sensitivity to Rb and S respectively. The two
vesselness terms exp(−R2b
2β2) and (1 − exp(−S 2
2c2)) are combined using their product to ensure that the response of the
filter is maximal only if both criteria are fulfilled.
According to scale space theory, Vσ(p) will be the maximum only when the width of the vessel in pixel p matches a suitable scale factorσ. Thus, In the multi-scale vessel enhancement algorithm, Vσ is computed for different scales then the largest one is taken as the final filter output.
Vmax(p) = max σ ∈Σσ
γ∗Vσ(p) (6)
The normalization factorσγ [51] is introduced to normalize the intensity values across the scale space. The parameterγcan be adjusted to show preference for particular scales. It is equal to one if no scale is preferred. Taking
2.2. Vessel Direction Information
The eigenvectors e1and e2of the Hessian matrix of Eq.4characterize the local shape of the intensity. e1gives the direction of lower second derivative, i.e. the direction of a potential linear structure, while e2gives the direction of the stronger second derivative, i.e. the normal direction to a potential linear structure. Thus the proposed direction information Dσcan be simply given by the following expression:
Dσ(p) = 0 ifλ2<0 e1 otherwise. (7)
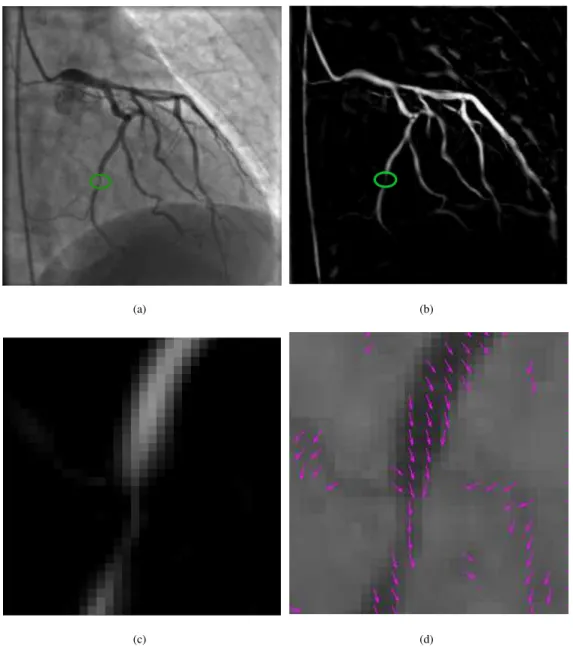
Fig.2 shows a motivating example of incorporating the direction information. The green circle in Fig.2(a) shows a stenosis in a coronary artery. When the maximum Frangi vesselness is computed, the filter response significantly decreases in this location. However the first eigenvector ensure the continuity of concerned pixels and their neighbours (see Fig.2(d)). One can note that neighbouring pixels in this location exhibit close direction.
3. Multiscale Segmentation Method
Leveraging from the above-mentioned multiscale geometrical information, we design a robust multiscale region growing process able to extract both wide and thin vessels while avoiding undesirable structure overemphasis and early segmentation stop.
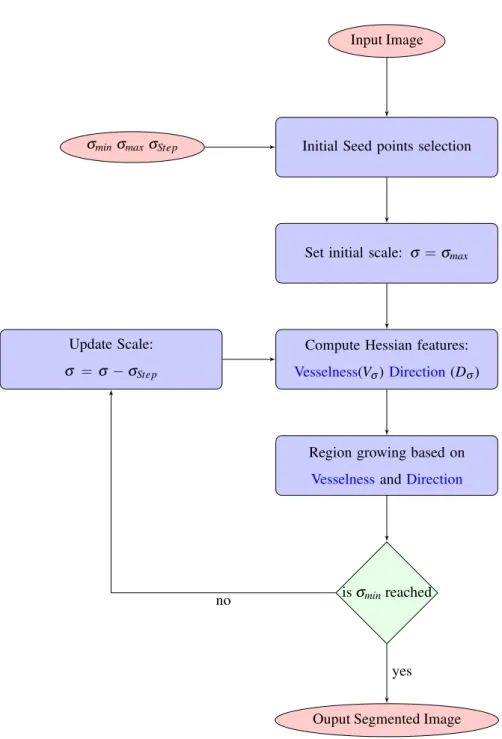
A general overview of the proposed method is depicted in Fig.3. First, seed points are selected by seeking for points with the highest Frangi vesselness response (section 3.1). Subsequently, starting from the highest scaleσmax, the
vesselness (Vσ) and direction (Dσ) features are computed for each scale. Then a region growing process based upon a specific criterion combining those two features is performed. This criterion will be described in section 3.2. If all the scales are explored i.eσminis reached, the segmented image is obtained else the segmentation process restarts with
the next scaleσ−σstep. The details of the process evolution over the different scales are described in section 3.3.
3.1. Initial seed points selection
Candidate seed points are automatically generated by the Frangi vesselness map analysis. Pixelsexhibiting the maximum of vesselness are considered as a good starting point. Since the vesselness is always maximum along the vessels’ centerlines and close to zero outside tube-like regions, the initial seed points are generally located in the center of vascular regions. To avoid points in the peripheral positions which may have high response, the search is done inside a sub-area excluding the image borders.
The red points in Fig.4(a), 4(b) and 4(c) show some automatically generated seeds on three different images. These points are located in the center of wide vessels. One can see that some regions especially thin vessels with very low illumination may be unreachable. Thus,if the user is interested in thin vessel extraction, he may add some more
(a) (b)
(c) (d)
Figure 2: Motivating sample: (a) original image; (b) Frangi vesselness response; (c) vesselness in the green circle; (d) corresponding first eigen-vector field.
additional seeds. The added seeds are depicted in green in Fig.4. Sometimes, the area thought to be had to reach is segmented even without added markers.
3.2. Region Growing Condition
The idea behind our approach is to incorporate the vessel direction information with the vesselness response in order to improve the vessel segmentation result. This information have to be included in a way that favours neighbours exhibiting directions close to the direction of a seed point even if their vesselness responses are lower than a given
Input Image
Initial Seed points selection
Set initial scale: σ =σmax
Compute Hessian features:
Vesselness(Vσ) Direction(Dσ) Update Scale:
σ =σ−σStep
σminσmaxσStep
Region growing based on
VesselnessandDirection
isσminreached
Ouput Segmented Image no
yes
Figure 3: MultiScale Region Growing Overview.
threshold. This will help to ensure the continuity of the segmentation along the artery direction, and reduce the number of broken branches as well. Based on this idea, we propose a region growing algorithm based on the following convergence condition:
(a) (b) (c)
Figure 4: Seed points selection : automatically generated points using the vesselness map are plotted in red color and manually added points are plotted in green color.
Here B is the binary image corresponding to the segmentation, N4(p) is the 4-neighbourhood of pixel p, and Ωσ is a
correlation index between vessel orientations at pixels p and q, defined as follows: Ωσ(p, q) =
Dσ(p).Dσ(q)
kDσ(p)kkDσ(q)k (9)
Ωσ(p, q) becomes one when the two local direction vectors are parallel and becomes zero if they are orthogonal. As
a result, the growing process may aggregate pixels with close directions even if their vesselness values are low. The
ηparameter is a basic threshold of the vesselness value needed to growing the vessel region. If we assume that the vesselness is rescaled in the interval [0,1],ηwill be between 0 and 1. The smaller value of the parameterηcan result in the overgrowth of the vessel region, while the bigger one will limit the extension of the seed point set.
3.3. MultiScale Region Growing Algorithm
A pseudo-code for the MSRG algorithm is given in Algorithm 1. The initial seeds (binary image S) are used to initialise an iterative region growing segmentation process, whose output is the binary image B. Then, at each scale starting from the largest scaleσmax, the vesselness (Vσ) and direction (Dσ) features are computed from the original
image I.
The root of the coronary tree is found in the coarsest scale as a candidate with the highest Frangi vesselness. Most of the automatically generated seed points are located in large vessels, thus the coarse-to-fine scheme makes the growing process more fluid and faster. This scheme is also less sensitive to noise often encountered in thin vessels.
At each scale, the region growing process is implemented using a processing queue Q, which is initialised with the current segmentation image B. Then, the first pixel of the queue (q← Q.first) is picked, its 4-neighbours meeting the growing condition of Eq.8 are added to the queue and to the segmented image, then q is pulled out of the queue, the new first pixel of the queue is picked, and so on until the queue is empty. If all the scales have been explored, i.e
Algorithm 1 MULTISCALEREGIONGROWING(I, S) Require: S6= 0 1: B← S 2: σ←σmax 3: whileσ≥σmindo 4: Q← {q;B(q) = 1} 5: while Q6= /0 do 6: q← Q.first 7: for all p∈ N4(q) do 8: if B(p) = 0 and Vσ(p) >η(1 − Ωσ(p, q)) then 9: B(p) ← 1 10: Q← Q ∪ {p} 11: end if 12: end for 13: Q← Q \ {q} 14: end while 15: σ←σ−σStep 16: end while 17: return B 4. Experiments
This section presents experiments carried out to assess the behaviour of the proposed segmentation method. The materials used in our experiments is described in section 4.1. Section 4.2 introduces the performance measures used to evaluate the algorithm. The different parameters used in the experiments are described in section 4.3.Finally section 4.4 introduces the state of the art methods used in the evaluation.
4.1. Materials
Real clinical X-ray angiograms were acquired during routine cardiac catheter examinations using a single plane Siemens Artis Zee angiography system available at the Cardiology Department of The University Hospital Fattouma Bourguiba, Monastir, Tunisia.
For each intervention, Dicom sequences of different projections were obtained by varying the left or the right anterior oblique (LAO or RAO) angle and the caudal or cranial (CAUD or CRAN) angle in order to visualize both left and right coronary arteries. The acquired series were then extracted and interesting angiograms from both healthy and diseased patients with different stenosis severity degrees.
pixels and 256 gray levels with a resolution of 0.3x0.3 mm. This database was equally split into 2 datasets. The first one (DS1) contains relatively easy cases in terms of vessel illumination and stenosis degrees, whereas the second dataset (DS2) presents difficult situations that may occur in X-ray coronary angiograms, such as low signal to noise ratio, severe stenosis and the overlapping of many vessels.
In order to evaluate the different segmentation methods on these images, manually gold standard were outlined by two trained operators and verified by clinicians resulting in two sets 1 and 2. The manually segmented images in set 1 and set 2 noted GT1 and GT2 respectively are used as ground truth. The disagreement between the two observers occurs especially on vessels borders and endpoints.
Fig.5 depicts two different ground truth of an imagebelonging to the first dataset. The common part is plotted in white color in Fig.5(b) while the red color illustrates pixels detected only by the first human observer.The blue color shows pixels detected only by the second human observer.
(a) (b)
Figure 5:Example of two manual segmentation of the same image: (a) original image (b) Two manual segmentation outputs: The common part is plotted in white and the red color illustrates pixel detected only by the first human observer. The blue color shows pixels detected only by the second human observer.
4.2. Performance measures
Three evaluation metrics, namely Dice coefficient [52], sensitivity and precision were used.The DICE similarity index is a measure of region overlap defined by:
Dicei=
2∗ |GTi∩ Seg|
|GTi| + |Seg|
where GTiis the ground truth region depicted by the observer i and Seg is the automatically segmented region. Dice
is always between 0 and 1, with higher values indicating better match between automatic and manual segmentations.
Precision is the rate of true-positives to the total number of positives. It is expressed by the following formula:
Precisioni=
T P
T P+ FP for i∈ {1,2} (11)
TP is the number of true positive i.e. correctly classified vessel whereas FP is the number of false positive i.e. ground truth non-vessel pixels overlapping detected pixels.
Sensitivity measures the proportion of ground truth positives which are correctly identified as such. It is given by:
Sensitivityi=
T P
T P+ FN for i∈ {1,2} (12) where FN is the number of false negatives i.e. incorrectly rejected pixels.
4.3. Parameter setting
All the results presented in this work useβ = 0.5 and half the value of the maximum Hessian norm for c (c = 1
2maxkH(x)kF) as proposed in [7].
Scales should be set according to the approximate width of the smallest and largest vessel to be detected. Scales should better match the radii of coronary arteries. In our database vessel radii vary from less than 1 pixel to more than 10 pixels wide in some images. The performance of our method, as any other multiscale method, highly relies on how accurate the scales estimation is, especially on theσmaxparameter. In fact, a lowerσmaxwill suffer from noise
disturbance and bar-like profiles. In contrast, an over-largeσmaxmight blur the adjacent structures and over-estimate
the vessel caliber. In our work, for each image, the largest vessel diameter dmax was calculated by averaging the
maxima of the distance transform computed on the two ground truth vessel trees andσmaxwas set to 0.5∗ dmax.σmin
was set to 1 since vessels with smaller radii are not of interest. Four logarithmically spaced scales betweenσminand
σmaxwere then generated for each image.
Theη parameter is calculated as a fixed quantile of the accumulated histogram of the vesselness image Vσ. We experimentally optimize this parameter and find that95percent is an acceptable threshold for our dataset.
4.4. Methods
The evaluation of our method robustness and efficiency is done in two stages. First, we seek to see the effect of the enhancement filter chosen in this work. Then, we compare the proposed segmentation with other state of the art methods.
4.4.1. Enhancement filters
In order to justify the choice of the Frangi filter for vessel detection within our approach, we build our segmentation algorithm upon different enhancement filters which are Sato filter, VED filter and Frangi filter.
The vesselness proposed by Frangi et al. in [7] is often considered as the current gold-standard for vessel enhancement [53]. The Sato filter [6] is also a well-cited method in this field and is integrated in many medical tools such as Mevislab1and Vmtk2. The VED filter was presented as a diffusion based version of the Frangi filter and is gaining
in popularity especially for vessel enhancement in 3D images. The results obtained by the VED filter, similarly to other diffusion-based methods cannot be directly compared to Hessian-based methods since the VED output is a smoothed image and not a vesselness image. Readers may note this difference in Fig.6 where Fig.6(c) is the smoothed image obtained by applying the VED filter to the original image in Fig.6(a), whereas Fig.6(b) is the output of the Frangi filter. Thus, we apply the Frangi filter to the VED result (Fig.6(c)). The final output image is given by Fig.6(d).
All these methods were tested using the same scale range already discussed. The parametersα andβ were set to 1 for the Sato filter whereas the VED filter was applied using the default parameters recommend by the authors in [17] (w= 25, s = 5 andξ = 10−2).
4.4.2. Segmentation methods
The MSRG algorithm was compared against four state-of-art segmentation approaches, which are hysteresis thresholding (HT), fuzzy clustering (FC), multi-seed region growing(RG) and accurate quantitative coronary artery segmentation (AQCA).
Classic segmentation method such as hysteresis thresholding (HT), fuzzy clustering (FC) and multi-seed region grow-ing(RG) are often applied to the final Frangi filter obtained by the maximum Frangi vesselness response. They are used generally in cases in which no dense abnormalities are present or when the vessel segmentation is auxiliary to the main task such as centerline extraction and 3D reconstruction of the coronary tree from different projections [3, 26]. Their output was thought to be sufficient to launch other applications. An interesting relatively recent work (AQCA) tailored to coronary artery extraction was proposed by Hernandez-Vela et al. in [54] and extended in [43].
The hysteresis thresholding is applied on the maximum Frangi vesselness response. This method retains connected components with all points that have a vesselness value greater than a low threshold and having at least one pixel with a vesselness value greater than a given threshold. We used the thresholds suggested in [3] which are around 90 and 96 percent of the accumulated histogram of the vesselness image.
The second method segments the maximum vesselness image into two partitions using standard Fuzzy c-means al-gorithm (FCM).The FCM alal-gorithm classifies the image by grouping similar pixels in the image into clusters. This clustering is achieved by iteratively minimizing an objective function with respect to fuzzy membership.
The third method is based on simple region growing (RG) on the maximum vesselness image with multiple seeds. Seeds and thresholds are manually set. The intial seed points for RG are the same used for the MSRG algorithm. No manual seed were added to any method.
The last method (AQCA) is also based on the maximum Frangi vesselness map but it uses a graph cuts algorithm
1http://www.mevislab.de/ 2www.vmtk.org/
(a) (b)
(c) (d)
Figure 6: Vessel Enhancing Diffusion vs. Hessian-based filter : (a) original image; (b) Frangi vesselness response; (c) output of the VED filter; (d): corresponding vesselness image.
which incorporate an automatic point seeding method and a multiscale edgeness term to detect vessel borders. We used the implementation available in the author website3and the recommended parameters.
5. Results
We divide the results in enhancement (section 5.1) and segmentation (section 5.2) evaluation.
5.1. Enhancement filter
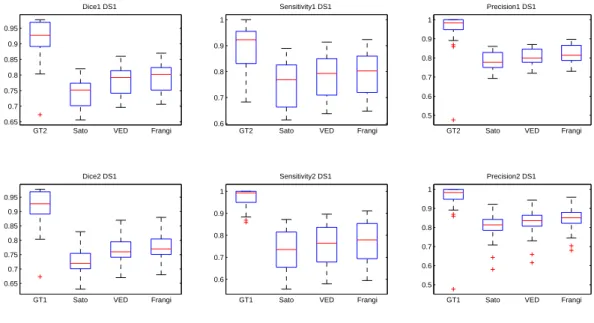
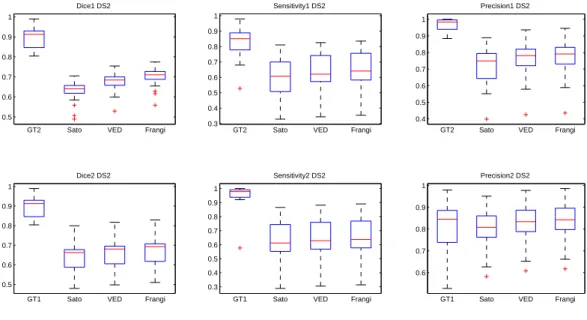
Dice, sensitivity and precision of the three MSRG versions are presented in Fig.7 for the first dataset and Fig.8 for the second dataset. The first row compares the second observer and the three methods to the first observer and the second row presents an evaluation against the second observer. Regarding the two datasets, the Sato filter has the lowest performance in terms of Dice similarity, sensibility and precision. This confirms the sensibility of this filter to noise. The Frangi and VED filters have very similar performance measures with a slight superiority for the Frangi filter. This is due to the impact of the blurring effect of VED filter especially on small vessels. One can see in the red rectangles in Fig.6(c) and Fig.6(d) that some discontinuities occur in thin vessels. Thus, distal parts of those vessels are missed in the segmentation step.
0.65 0.7 0.75 0.8 0.85 0.9 0.95
GT2 Sato VED Frangi Dice1 DS1 0.6 0.7 0.8 0.9 1
GT2 Sato VED Frangi Sensitivity1 DS1 0.5 0.6 0.7 0.8 0.9 1
GT2 Sato VED Frangi Precision1 DS1 0.65 0.7 0.75 0.8 0.85 0.9 0.95
GT1 Sato VED Frangi Dice2 DS1 0.6 0.7 0.8 0.9 1
GT1 Sato VED Frangi Sensitivity2 DS1 0.5 0.6 0.7 0.8 0.9 1
GT1 Sato VED Frangi Precision2 DS1
Figure 7: Enhancement filter evaluation for DS1 relatively to the first human observer (first row) and the second human observer (second row) : Dice (left), sensitivity (middle) and precision (right).
5.2. Segmentation methods
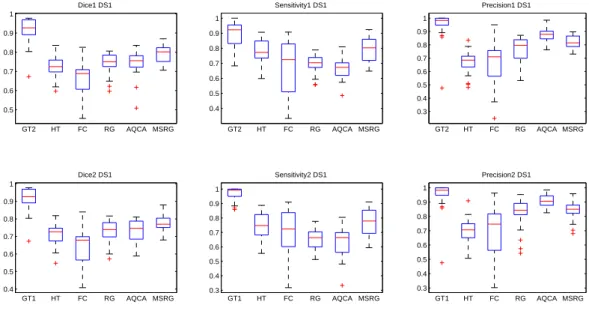
Fig.9 shows dice, sensitivity and precision for the four different methods (HT, FC, RG, AQCA and MSRG) as well as each observer against the other. It is worth to note that the plots in the first and second row have roughly similar appearance. A small inter-observer variability occurs in the specificity plot and shows that the first observer detects more vessels pixels than the second one. Regarding the dice metric, the FC method has the lowest dice, HT achieves better than FC but lower than the three other methods. RG and AQCA have slightly equal dice values and the MSRG achieves the best overlap values. The method HT has a higher sensitivity than FC, RG and AQCA but it has the disadvantages to produce many false positives as confirmed by the low precision values. Our method which
0.5 0.6 0.7 0.8 0.9 1
GT2 Sato VED Frangi Dice1 DS2 0.3 0.4 0.5 0.6 0.7 0.8 0.9 1
GT2 Sato VED Frangi Sensitivity1 DS2 0.4 0.5 0.6 0.7 0.8 0.9 1
GT2 Sato VED Frangi Precision1 DS2 0.5 0.6 0.7 0.8 0.9 1
GT1 Sato VED Frangi Dice2 DS2 0.3 0.4 0.5 0.6 0.7 0.8 0.9 1
GT1 Sato VED Frangi Sensitivity2 DS2 0.6 0.7 0.8 0.9 1
GT1 Sato VED Frangi Precision2 DS2
Figure 8: Enhancement filter evaluation for DS2 relatively to the first human observer (first row) and the second human observer (second row) : Dice (left), sensitivity (middle) and precision (right).
can be seen as an enhanced region growing method achieves better sensitivity while keeping the same precision level as the region growing. It is also worth to note that the AQCA has the highest precision but it remains lower than the inter-observer variability.
Regarding the second dataset (Fig.10), the methods keeps the same order in term of segmentation overlap (dice). The inter-observer variability has increased in term of specificity and precision. The precision of the HT, FC and RG methods have a large standard deviation which means that they may introduce a lot of false positives. Our method still achieve the best sensitivity and an acceptable rate of precision (80% ) and AQCA has the best precision. The outliers (red marks) seen in the different plots are related to bad seed or threshold automatic initialization.
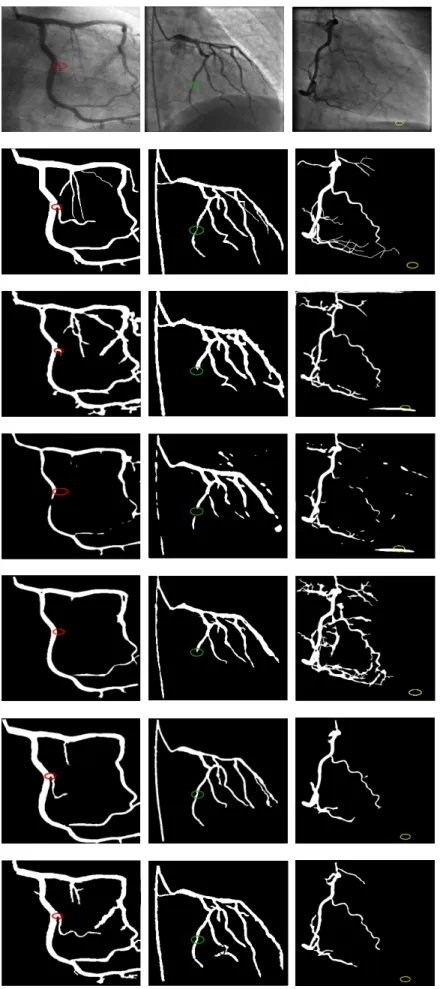
Moreover, Fig.11 shows some resulting outputs of the five different segmentation methods. From top to down, we find three different real angiograms; ground truth; hysteresis thresholding; fuzzy clustering; region growing; AQCA and our method outputs. The first and second images belong to the first dataset whereas the third images is charac-terised by a difficult background and many thin vessels overlap and belongs to second dataset. All the shown results are obtained without any added seeds.
The strength of our method is that detects correctly most of the relevant vessels are segmented, even small ones. From the third line, it’s obvious that the HT method has difficulties to segment the small vessels. The red circle in the first row shows a missed small vessel by the HT segmentation method. The same branch is also omitted by the FC and RG. This branch is also detected by the AQCA but not in totality.
0.5 0.6 0.7 0.8 0.9 1 GT2 HT FC RG AQCA MSRG Dice1 DS1 0.4 0.5 0.6 0.7 0.8 0.9 1 GT2 HT FC RG AQCA MSRG Sensitivity1 DS1 0.3 0.4 0.5 0.6 0.7 0.8 0.9 1 GT2 HT FC RG AQCA MSRG Precision1 DS1 0.4 0.5 0.6 0.7 0.8 0.9 1 GT1 HT FC RG AQCA MSRG Dice2 DS1 0.3 0.4 0.5 0.6 0.7 0.8 0.9 1 GT1 HT FC RG AQCA MSRG Sensitivity2 DS1 0.3 0.4 0.5 0.6 0.7 0.8 0.9 1 GT1 HT FC RG AQCA MSRG Precision2 DS1
Figure 9: Segmentation evaluation for DS1 relatively to the first human observer (first row) and the second human observer (second row) : dice (left), sensitivity (middle) and precision (right).
0.5 0.6 0.7 0.8 0.9 1 GT2 HT FC RG AQCA MSRG Dice1 DS2 0.2 0.4 0.6 0.8 1 GT2 HT FC RG AQCA MSRG Sensitivity1 DS2 0.3 0.4 0.5 0.6 0.7 0.8 0.9 1 GT2 HT FC RG AQCA MSRG Precision1 DS2 0.4 0.5 0.6 0.7 0.8 0.9 1 GT1 HT FC RG AQCA MSRG Dice2 DS2 0.3 0.4 0.5 0.6 0.7 0.8 0.9 1 GT1 HT FC RG AQCA MSRG Sensitivity2 DS2 0.4 0.5 0.6 0.7 0.8 0.9 1 GT1 HT FC RG AQCA MSRG Precision2 DS2
Figure 10: Segmentation evaluation for DS2 relatively to the first human observer (first row) and the second human observer (second row) : dice (left), sensitivity (middle) and precision (right).
with a moderated stenosis. The three other methods fail to reach distal parts located after the stenosis. However, the FC method suffers from some discontinuities and is sensitive to noise which is also a limitation of the HT
segmen-tation method as we can see in the figures of the last column where the yellow circles show non-vascular structures erroneously segmented by both HT and FC. Contrarily, the RG, MSRG and AQCA are able to avoid noise far enough from vessels since they start from correct seeds. However, the RG method produces many false positives around the thin vessels. The AQCA achieves a good segmentation of the principal arteries but gives more false negatives than the MSRG.
6. Discussion and Conclusion
In this paper, we have presented a novel method for coronary artery segmentation based on Hessian features anal-ysis in a multiscale fashion. We have introduced a growing rule combining both vesselness and direction information at different scales. First, the Frangi vesselness filter was adopted for vessel enhancement since it nicely captures tubular structure and significantly reduces background artefacts. Then, instead of extracting vascular structure only on the basis of their vesselness response, we have also incorporated the direction information. This information was included in a way that favours neighbours exhibiting directions close to the direction of a seed point even if their ves-selness responses are lower than a given threshold. Thereby, the growth runs fluidly along the artery direction, and the number of broken branches is reduced as well. The multiscale region growing is robust, especially when dealing with discontinuity factors such as noise, stenosis and low contrast. Quantitative evaluation have been performed on real angiography images at two stages. First, the choice of the Frangi filter for vessel-like structures detection was justified by comparing the segmentation results obtained from three different filters. The proposed segmentation method has been also compared to other segmentation methods andit has beenshown that it generatesa better performance than fuzzy clustering, hysteresis thresholding and region growing in terms of vessel overlap, sensitivity and precision. The AQCA method, however, by using a multiscale edgness term that is able to accurately detect vessel border, reaches a precision greater than our method. But its sensitivity is smaller.
The results obtained by our algorithm (an average of DICE coefficient of 80%± 5% for DS1 and 70% ± 5% for DS2 ) seem to represent a significant misalignment. Fig. 12 gives details of misalignment between the MSRG al-gorithm andthe firstground truth. Almost the false negatives occur in vessels boundaries. For the large vessels a difference of 1 to 2 pixels betweeneachground truth and the segmentation is noted. Contrarily, false positives fre-quently appear on thin vessels which are generally overemphasized.
Our observations throughout thetwodatasets showed that the discordance is due to two main causes which are: 1) detection of non-vascular structures like background structures which are adjacent to vessels; and 2) false positives on vessel borders.
The first type of error is normally related with the vessel enhancement method used. In fact, the Frangi filter enhances not only the coronary tree but also any tubular structure including diaphragm, spinal disks, catheters and other back-ground artefacts. Such non-vascular structures are erroneously segmented by our method only if they intersect or are
very close to a vascular branch, otherwise they are enhanced by the Frangi filter but omitted by our segmentation method since the growth process starts from correctly classified seeds. Such error occurs in just few images of our dataset and it can be resolved if these structures are beforehand detected and eliminated from the images using an a priori knowledge for the shape of the diaphragm border [55] or a learning-based method to detect the catheter [43]. The second error consists in inaccurate border detection especially for thin arteries. In fact, these vessels may be overemphasized when they are processed at a scale larger then their sizes. This issuecouldbe addressed if a break constraint is added to our algorithm in order to stop the growing when the vessel boundaries are reached. Obviously, this needs a robust vessel border detectorsuch as the mulitscale Canny edge detector used in the AQCA method [43].
In the future work, we would like to overcome these limitations by automatic detection of non vascular structures and better vessel border delineation. Future investigation of our segmentation method can be used as a computer-assisted quantitative analysis of blood vessels from angiograms or as an input for other processing tasks such as centerline extraction [43], and 3D coronary tree reconstruction [3].
Figure 11:Segmentation results. Top to down: real angiograms ; ground truth ; hysteresis thresholding; fuzzy clustering; region growing; AQCA
(a) (b) (c)
Figure 12: Comparison between MSRG and thefirstground truth: The white color depicts true positives. False negative points are marked in blue and false positives in red. The shown results are obtained with manual added seeds in images 1 and 3.
References
[1] Z. Li, Y. Zhang, G. Liu, H. Shao, W. Li, X. Tang, A robust coronary artery identification and centerline extraction method in angiographies, Biomedical Signal Processing and Control 16 (2015) 1–8.
[2] Y. Sato, T. Araki, M. Hanayama, H. Naito, S. Tamura, A viewpoint determination system for stenosis diagnosis and quantification in coronary angiographic image acquisition, Medical Imaging, IEEE Transactions on 17 (1) (1998) 121–137.
[3] R. Liao, D. Luc, Y. Sun, K. Kirchberg, 3-d reconstruction of the coronary artery tree from multiple views of a rotational x-ray angiography, The International Journal of Cardiovascular Imaging (formerly Cardiac Imaging) 26 (2010) 733–749.
[4] S. Zheng, Y. Zhou, Assessing cardiac dynamics based on x-ray coronary angiograms, Journal of Multimedia 8 (1) (2013) 48–55.
[5] T. M. Koller, G. Gerig, G. Szekely, D. Dettwiler, Multiscale detection of curvilinear structures in 2D and 3D image data, in: Proc. Conf. Fifth Int Computer Vision, 1995, pp. 864–869.
[6] Y. Sato, S. Nakajima, N. Shiraga, H. Atsumi, S. Yoshida, T. Koller, G. Gerig, R. Kikinis, Three-dimensional multi-scale line filter for segmentation and visualization of curvilinear structures in medical images, Medical Image Analysis 2 (2) (1998) 143–168.
[7] A. Frangi, W. Niessen, K. Vincken, M. Viergever, Multiscale vessel enhancement filtering, Medical Image Computing and Computer-Assisted Interventation—MICCAI 98 (1998) 130–137.
[8] C. Lorenz, I. Carlsen, T. Buzug, C. Fassnacht, J. Weese, Multi-scale line segmentation with automatic estimation of width, contrast and tangential direction in 2d and 3d medical images, in: J. Troccaz, E. Grimson, R. M¨osges (Eds.), CVRMed-MRCAS’97, Vol. 1205 of Lecture Notes in Computer Science, Springer Berlin / Heidelberg, Berlin/Heidelberg, 1997, Ch. 24, pp. 233–242.
[9] K. Krissian, G. Malandain, N. Ayache, R. Vaillant, Y. Trousset, Model-based detection of tubular structures in 3d images, Computer Vision and Image Understanding 80 (2) (2000) 130 – 171.
[10] M. Erdt, M. Raspe, M. Suehling, Automatic hepatic vessel segmentation using graphics hardware, Medical Imaging and Augmented Reality (2008) 403–412.
[11] D. Kroon, C. Slump, Coherence filtering to enhance the mandibular canal in cone-beam ct data, in: Proceedings of the 4th Annual Symposium of the IEEE-EMBS Benelux Chapter, IEEE EMBS Benelux Chapter, Enschede, 2009, pp. 41–44.
[12] C. Xiao, M. Staring, Y. Wang, D. Shamonin, B. Stoel, Multiscale bi-gaussian filter for adjacent curvilinear structures detection with applica-tion to vasculature images, IEEE Transacapplica-tions on Image Processing 22 (1) (2013) 174–188.doi:10.1109/TIP.2012.2216277 . [13] A. Dufour, O. Tankyevych, B. Naegel, H. Talbot, C. Ronse, J. Baruthio, P. Dokl´adal, N. Passat, Filtering and segmentation of 3d angiographic
data: Advances based on mathematical morphology, Medical image analysis 17 (2) (2013) 147–164.
[14] P. T. Truc, M. A. Khan, Y.-K. Lee, S. Lee, T.-S. Kim, Vessel enhancement filter using directional filter bank, Computer Vision and Image Understanding 113 (1) (2009) 101 – 112.
[15] F. Zana, J.-C. Klein, Segmentation of vessel-like patterns using mathematical morphology and curvature evaluation, Image Processing, IEEE Transactions on 10 (7) (2001) 1010–1019.
[16] J. Weickert, Coherence-enhancing diffusion filtering, Journal of Computer Vision (1999) 111–127.
[17] R. Manniesing, M. A. Viergever, W. J. Niessen, Vessel enhancing diffusion: A scale space representation of vessel structures, Medical Image Analysis 10 (6) (2006) 815 – 825.
[18] S. Greenberg, M. Aladjem, D. Kogan, I. Dimitrov, Fingerprint image enhancement using filtering techniques, in: Pattern Recognition, 2000. Proceedings. 15th International Conference on, Vol. 3, 2000, pp. 322–325 vol.3.
[19] D. Cabrera Fern´andez, H. M. Salinas, C. A. Puliafito, Automated detection of retinal layer structures on optical coherence tomography images, Optics Express 13 (25) (2005) 10200–10216.
[20] S. Pop, A. Dufour, J.-C. Olivo-Marin, Image filtering using anisotropic structure tensor for cell membrane enhancement in 3d microscopy, in: Image Processing (ICIP), 2011 18th IEEE International Conference on, IEEE, 2011, pp. 2041–2044.
[21] A. Kerkeni, A. Benabdallah, M. H. Bedoui, Coronary artery multiscale enhancement methods: A comparative study, in: Image Analysis and Recognition, Springer, 2013, pp. 510–520.
[23] J. S. Suri, K. Liu, L. Reden, S. Laxminarayan, A review on mr vascular image processing: skeleton versus nonskeleton approaches: part ii., IEEE transactions on information technology in biomedicine: a publication of the IEEE Engineering in Medicine and Biology Society 6 (4) (2002) 338–350.
[24] A. Condurache, T. Aach, Vessel segmentation in angiograms using hysteresis thresholding., in: MVA, 2005, pp. 269–272.
[25] C. Blondel, G. Malandain, R. Vaillant, A. N., Reconstruction of coronary arteries from a single rotational x-ray projection sequence., IEEE Trans Med Imaging. 25(5):653-63.
[26] A. Andriotis, A. Zifan, M. Gavaises, A new method of three-dimensional coronary artery reconstruction from x-ray angiography: Valida-tion against a virtual phantom and multislice computed tomography, CatheterizaValida-tion and Cardiovascular IntervenValida-tions 71 (1) (2008) 28–43. doi:10.1002/ccd.21414.
[27] J. F. O’Brien, N. F. Ezquerra, Automated segmentation of coronary vessels in angiographic image sequences utilizing temporal, spatial, and structural constraints, in: Visualization in Biomedical Computing 1994, International Society for Optics and Photonics, 1994, pp. 25–37. [28] S. Eiho, H. Sekiguchi, N. Sugimoto, T. Hanakawa, S. Urayama, Branch-based region growing method for blood vessel segmentation, in:
Proceedings of International Society for Photogrammetry and Remote Sensing Congress, 2004, pp. 796–801.
[29] H. Sekiguchi, N. Sugimoto, S. Eiho, T. Hanakawa, S. Urayama, Blood vessel segmentation for head mra using branch-based region growing, Systems and Computers in Japan 36 (5) (2005) 80–88.
[30] M. E. Martinez-Perez, A. D. Hughes, S. A. Thom, A. A. Bharath, K. H. Parker, Segmentation of blood vessels from red-free and fluorescein retinal images, Medical image analysis 11 (1) (2007) 47–61.
[31] Y. Li, S. Zhou, J. Wu, X. Ma, K. Peng, A novel method of vessel segmentation for x-ray coronary angiography images, in: 2012 Fourth International Conference on Computational and Information Sciences (ICCIS), IEEE, 2012, pp. 468–471.
[32] M. Orkisz, M. Hern´andez Hoyos, V. P´erez Romanello, C. P´erez Romanello, J. Prieto, C. Revol-Muller, Segmentation of the pulmonary vascular trees in 3d ct images using variational region-growing, IRBM 35 (1) (2014) 11–19.
[33] Y. Qian Zhao, X. Hong Wang, X. Fang Wang, F. Y. Shih, Retinal vessels segmentation based on level set and region growing, Pattern Recognition 47 (7) (2014) 2437–2446.
[34] Z. Shoujun, Y. Jian, W. Yongtian, C. Wufan, et al., Automatic segmentation of coronary angiograms based on fuzzy inferring and probabilistic tracking, Biomedical Engineering Online 9 (1) (2010) 40.
[35] C.-C. Ko, C.-W. Mao, Y.-N. Sun, S.-H. Chang, A fully automated identification of coronary borders from the tree structure of coronary angiograms, International journal of bio-medical computing 39 (2) (1995) 193–208.
[36] K. Sun, N. Sang, E. Zhao, Extraction of vascular tree on angiogram with fuzzy morphological method, Int. J. Inf. Technol 11 (9) (2005) 119–127.
[37] J. Brieva, E. Gonzalez, F. Gonzalez, A. Bousse, J. Bellanger, A level set method for vessel segmentation in coronary angiography., in: Conference proceedings:... Annual International Conference of the IEEE Engineering in Medicine and Biology Society. IEEE Engineering in Medicine and Biology Society. Conference, Vol. 6, 2004, pp. 6348–6351.
[38] K. Sum, P. Y. Cheung, Vessel extraction under non-uniform illumination: a level set approach, Biomedical Engineering, IEEE Transactions on 55 (1) (2008) 358–360.
[39] M. tagizaheh, Segmentation of coronary vessels by combining the detection of centerlines and active contour model.
[40] L. Chen, S. Li, A semi-automatic method for vascular image segmentation, in: Image and Graphics (ICIG), 2011 Sixth International Confer-ence on, IEEE, 2011, pp. 3–7.
[41] M. Schaap, L. Neefjes, C. Metz, A. van der Giessen, A. Weustink, N. Mollet, J. Wentzel, T. van Walsum, W. Niessen, Coronary lumen segmentation using graph cuts and robust kernel regression, in: Information Processing in Medical Imaging, Springer, 2009, pp. 528–539. [42] S. Esneault, C. Lafon, J.-L. Dillenseger, Liver vessels segmentation using a hybrid geometrical moments/graph cuts method, Biomedical
Engineering, IEEE Transactions on 57 (2) (2010) 276–283.
[43] A. Hernandez-Vela, C. Gatta, S. Escalera, L. Igual, V. Martin-Yuste, M. Sabate, P. Radeva, Accurate coronary centerline extraction, caliber estimation, and catheter detection in angiographies, IEEE Transactions on Information Technology in Biomedicine 16 (6) (2012) 1332–1340.
[44] C. Kirbas, F. K. H. Quek, A review of vessel extraction techniques and algorithms, ACM Computing Surveys 36 (2004) 81–121.
[45] D. Lesage, E. D. Angelini, I. Bloch, G. Funka-Lea, A review of 3d vessel lumen segmentation techniques: Models, features and extraction schemes, Medical Image Analysis 13 (6) (2009) 819 – 845.
[46] S. W. Zucker, Region growing: Childhood and adolescence, Computer graphics and image processing 5 (3) (1976) 382–399.
[47] P. J. Yim, P. L. Choyke, R. M. Summers, Gray-scale skeletonization of small vessels in magnetic resonance angiography, IEEE TRANSAC-TIONS ON MEDICAL IMAGING 19 (6).
[48] J. Hu, A. Razdan, G. Nielson, G. Farin, Segmenting linear parts using layered region growing, in: The 8th internationals Conference for 3D Digitisation and Modeling Professionals: 3D Modeling, 2003.
[49] D. S. Lara, A. W. Faria, A. de A. Araujo, D. Menotti, A semi-automatic method for segmentation of the coronary artery tree from angiography, Computer Graphics and Image Processing, Brazilian Symposium on 0 (2009) 194–201.
[50] Y. Nimura, T. Kitasaka, K. Mori, Blood vessel segmentation using line-direction vector based on hessian analysis, in: SPIE Medical Imaging, International Society for Optics and Photonics, 2010, pp. 76233Q–76233Q.
[51] T. Lindeberg, Principles for automatic scale selection, Handbook on computer vision and applications 2 (1999) 239–274. [52] L. R. Dice, Measures of the amount of ecologic association between species, Ecology 26 (3) (1945) 297–302.
[53] O. Merveille, H. Talbot, L. Najman, N. Passat, Tubular structure filtering by ranking orientation responses of path operators, in: Computer Vision–ECCV 2014, Springer, 2014, pp. 203–218.
[54] A. Hern´andez-Vela, C. Gatta, S. Escalera, L. Igual, V. Martin-Yuste, P. Radeva, Accurate and robust fully-automatic qca: method and numerical validation., in: Medical image computing and computer-assisted intervention: MICCAI... International Conference on Medical Image Computing and Computer-Assisted Intervention, Vol. 14, 2011, p. 496.
[55] S. Petkov, X. Carrillo, P. Radeva, C. Gatta, Diaphragm border detection in coronary x-ray angiographies: New method and applications, Computerized Medical Imaging and Graphics 38 (4) (2014) 296–305.