HAL Id: hal-00296838
https://hal.archives-ouvertes.fr/hal-00296838
Submitted on 16 Dec 2005
HAL is a multi-disciplinary open access
archive for the deposit and dissemination of
sci-entific research documents, whether they are
pub-lished or not. The documents may come from
teaching and research institutions in France or
abroad, or from public or private research centers.
L’archive ouverte pluridisciplinaire HAL, est
destinée au dépôt et à la diffusion de documents
scientifiques de niveau recherche, publiés ou non,
émanant des établissements d’enseignement et de
recherche français ou étrangers, des laboratoires
publics ou privés.
Quantifying the efficiency of river regulation
R. Rödel, T. Hoffmann
To cite this version:
R. Rödel, T. Hoffmann. Quantifying the efficiency of river regulation. Advances in Geosciences,
European Geosciences Union, 2005, 5, pp.75-82. �hal-00296838�
Advances in Geosciences, 5, 75–82, 2005 SRef-ID: 1680-7359/adgeo/2005-5-75 European Geosciences Union
© 2005 Author(s). This work is licensed under a Creative Commons License.
Advances in
Geosciences
Quantifying the efficiency of river regulation
R. R¨odel and T. Hoffmann
Department of Geography and Geology, Jahnstr. 16a, 17489 Greifswald, Germany
Received: 7 January 2005 – Revised: 1 August 2005 – Accepted: 1 September 2005 – Published: 16 December 2005
Abstract. Dam-affected hydrologic time series give rise to
uncertainties when they are used for calibrating large-scale hydrologic models or for analysing runoff records. It is there-fore necessary to identify and to quantify the impact of im-poundments on runoff time series. Two different approaches were employed. The first, classic approach compares the vol-ume of the dams that are located upstream from a station with the annual discharge. The catchment areas of the sta-tions are calculated and then related to geo-referenced dam attributes. The paper introduces a data set of geo-referenced dams linked with 677 gauging stations in Europe.
Second, the intensity of the impoundment impact on runoff times series can be quantified more exactly and di-rectly when long-term runoff records are available. Dams cause a change in the variability of flow regimes. This ef-fect can be measured using the model of linear single stor-age. The dam-caused storage change 1S can be assessed through the volume of the emptying process between two flow regimes. As an example, the storage change 1S is calculated for regulated long-term series of the Lule¨alven in northern Sweden.
1 Introduction
Runoff time series for a large number of stations are available in global data archives like the GRDC (Global Runoff Data Centre) in Koblenz, Germany, or the NCAR (Bodo, 2005). These data have been used to calibrate and test large-scale watershed models (Alcamo et al., 2003) or to assess the ef-fects of global change (Dettinger and Diaz, 2000).
Many runoff time series are, to some extent, affected by impoundments. Runoff is the cumulate expression of several different processes in a catchment area. Land-use changes, climate changes as well as streamflow regulation all leave their mark on the time series. Water engineering works such Correspondence to: R. R¨odel
as impoundments are one of three dimensions of the human impact on the global water cycle (V¨or¨osmarty et al., 1997; Nilsson et al., 2005). Quantifying the intensity of streamflow regulation is a worthwhile preparation for the assessment of climate and land-use changes (McClelland, Holmes and Pe-terson, 2004).
The data on the impact of dams and dam cascades on large river catchment areas are scarce. ICOLD compiles statis-tics on the dams of every country (ICOLD, 1998). From the capacities of 662 geo-referenced reservoirs in a simple dig-ital river network, V¨or¨osmarty et al. (1997) calculated the ratio of the cumulated dam volume to the annual discharge. They included only dams with a gross capacity of more than 0.5 km3. Fiske and Joffe (2001) compiled catchment-related dam statistics. They relied only on dam signatures from dig-ital maps, i.e. the construction years and dam capacities were not included. Nilsson and Reidy et al. (2005) assessed the river channel fragmentation of 292 global catchment areas. In the first step, they delineated the catchment areas. Subse-quently, they related them to the dam volumes and compared the gross dam capacity with the annual catchment area dis-charge.
These studies have clarified the current impact of dams on large river catchment areas. Further research is necessary to be able to quantify the impact of streamflow regulation on any gauging station recorded in global archives like GRDC or NCAR (Bodo, 2005).
2 Data sets and methods
2.1 Dams and impoundments per catchment
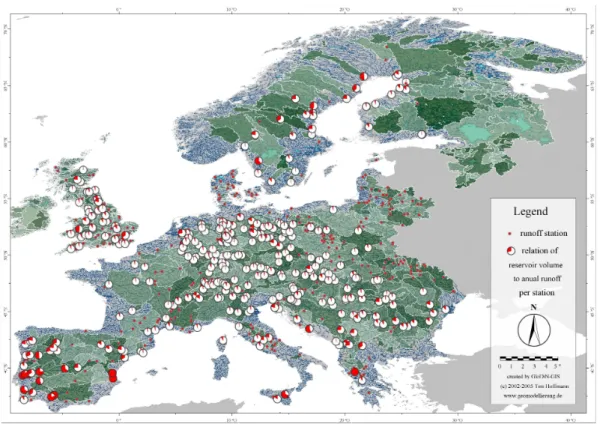
This section describes a method for assessing the inten-sity of the impoundment impact on European gauging sta-tions. 3410 dams from the ICOLD database (ICOLD, 1998) (Fig. 1) were geo-referenced. Each dam is described by its capacity and the year of construction. The objective was to quantify the impoundment impact on each of 677 European
76 R. R¨odel and T. Hoffmann: Quantifying the efficiency of river regulation
13
fig. 1: Dams in Europe (geo-referenced from ICOLD database (ICOLD, 1998))
1 2, 3 4
Life cycle of the cellular automata. Green, yellow and red refer to operating instructions in the text.
1 2, 3 4 1 2, 3 4
Life cycle of the cellular automata. Green, yellow and red refer to operating instructions in the text.
fig. 2: Generating an upstream catchment area using an additional river layer.
Fig. 1. Dams in Europe (geo-referenced from ICOLD database (ICOLD, 1998)).
13
fig. 1: Dams in Europe (geo-referenced from ICOLD database (ICOLD, 1998))
1 2, 3 4
Life cycle of the cellular automata. Green, yellow and red refer to operating instructions in the text.
1 2, 3 4 1 2, 3 4
Life cycle of the cellular automata. Green, yellow and red refer to operating instructions in the text.
fig. 2: Generating an upstream catchment area using an additional river layer.
Fig. 2. Generating an upstream catchment area using an additionalriver layer.
gauging stations from the NCAR and GRDC data archives (Bodo, 2005). In the first step, dams had to be assigned to the catchment area of each station.
The relevant upstream dams and their cumulated capac-ity were determined for 677 gauging stations (Fig. 6). The impoundment coefficient is the ratio of cumulated upstream
dam capacity to annual discharge (V¨or¨osmarty et al., 1997; Nilsson et al., 2005). Since the construction year of each dam is known, impoundment coefficients for different periods can be calculated.
2.1.1 Derivation of station catchments
D¨oll and Lehner (2002) introduced a method for generating a global drainage direction grid with a resolution of 30 min (DDM 30). The derivation of digital catchments requires a relatively large amount of manual work because the underly-ing digital elevation model is strongly generalised. For creat-ing a grid with the higher resolution of 30 s containcreat-ing global watersheds the method of D¨oll and Lehner needs a high level of manual corrections. The procedure suggested in this paper highly reduces the manual effort.
The catchment derivation method employed in this study uses a sink-to-source flow algorithm powered by cellular au-tomates which move on the digital elevation model SRTM 30 (2003) by USGS. The starting points of these automates are the geo-referenced positions of digitised rivers and lakes from the hydrologic layer of the DCW (1992) (Fig. 2). This method avoids an important source of error because it does not require calculating the flow concentration along rivers and lakes.
The cellular automates follow the operating instructions (refer to Fig. 2) given below:
R. R¨odel and T. Hoffmann: Quantifying the efficiency of river regulation 77 1. (Green) Start at the highest point of the river layer that
has not been used as a starting point before! (All points of the river layer will be starting points at one time.) 2. (Yellow) Define the present grid cell as a part of the
catchment!
3. (Yellow) Replicate and let your children move to the neighbouring cell if its altitude is higher than that of the present cell (or equal within a fixed radius)! As long as this condition applies, continue with step 2.
4. (Red) Die if you cannot move on.
5. Select the next starting point from the river layer until you reach the river mouth. Continue with step 1. As a result, some grid cells will fail to receive any ID be-cause there is no strictly monotonic rising path that connects them with any of the starting points. The reason, in most cases, is the generalisation of the DEM. Another reason may be that the automates detect apparent endorheic catchment areas. However, because most inland depressions form a part of the river layer, additional, it is unlikely that independent endorheic catchment areas will be discovered. As a conse-quence, the lowest point of each of these areas should be joined to the adjacent catchment area.
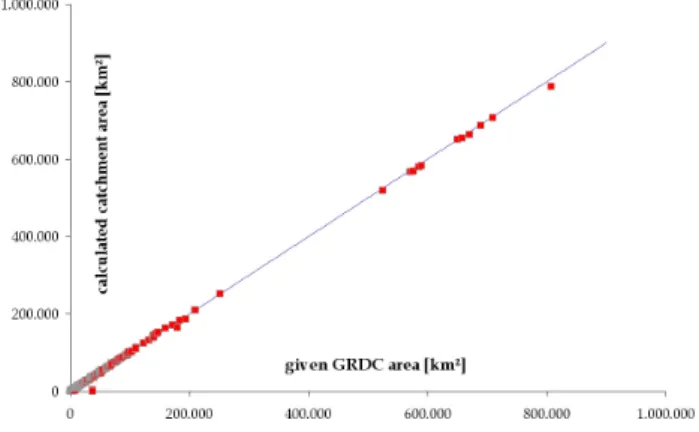
In the next step, the catchment grid areas were vectorised, forming polygons, and the stream network hierarchy was ap-plied. This generation of the order for a stream network con-tains a smaller manual part as usually and is described in de-tail in Hoffmann (2004). To validate the algorithm, the doc-umented catchment area sizes of Central European GRDC stations were compared with the calculated values (Fig. 3). This makes it possible to link geo-referenced dams to gaug-ing stations, usgaug-ing a point-in-polygon algorithm.
2.2 Storage capability of the natural and technical systems In addition to the impoundment coefficient, there is a way to assess the human impact on the runoff time series directly. This paper suggests a method that treats flow regimes, which may be changed by impoundments, as results of a linear sin-gle storage. Note that this requires long-term discharge time series.
Runoff is an expression of the landscape properties in a catchment area. Therefore, the hydrograph represents these natural and anthropogenic properties as the reaction of a co-operative system. A coco-operative system includes the inter-action of technical and natural processes and their reflec-tion in the geographical space (Aurada, 2003). Natural and technical storage processes modify the hydrograph, e.g. by redistributing the monthly flows. Technical redistribution usually leads to a smoothed flow regime because the dis-charge is stored in dams. Therefore, the runoff recorded at a regulation-affected gauging station is a superposition of the variable natural system and the regulated system.
14
fig. 3. Validation of calculated area versus documented area of GRDC-stations in Central
Europe.
0.00 0.05 0.10 0.15 0.20 0.25 1 2 3 4 5 6 7 8 9 10 11 12 0.00 0.05 0.10 0.15 0.20 0.25 1 2 3 4 5 6 7 8 9 10 11 12 time time a bHigh emptying rate, short length of emptying High emptying rate, short length of emptying
small emptying rate, long length of emptying small emptying rate, long length of emptying st an da rdiz ed run o ff st an dard iz ed run of f reference signal Emptying process of a
linear single storage Emptying volume betweenthe two signals which have to be „balanced“ observed signal 0.00 0.05 0.10 0.15 0.20 0.25 1 2 3 4 5 6 7 8 9 10 11 12 0.00 0.05 0.10 0.15 0.20 0.25 1 2 3 4 5 6 7 8 9 10 11 12 0.00 0.05 0.10 0.15 0.20 0.25 1 2 3 4 5 6 7 8 9 10 11 12 0.00 0.05 0.10 0.15 0.20 0.25 1 2 3 4 5 6 7 8 9 10 11 12 time time a b
High emptying rate, short length of emptying High emptying rate, short length of emptying
small emptying rate, long length of emptying small emptying rate, long length of emptying st an da rdiz ed run o ff st an dard iz ed run of f reference signal Emptying process of a
linear single storage Emptying volume betweenthe two signals which have to be „balanced“
observed signal
fig. 4: Transformation between two hydrographs caused by the emptying process of a linear
single storage. a: Transformation of a signal that is shifted forward approximately one time
unit. Emptying of the observed signal occurs rapidly. The constant K of this process is
Fig. 3. Validation of calculated area versus documented area of
GRDC-stations in Central Europe.
In order to identify runoff changes as signals for changes in the storage systems of a catchment, it is necessary to quan-tify the changes in both the natural and the technical storages. The technically redistributed volume of a flow regime can be used as an objective criterion to determine the effect of river regulation in a catchment. This volume should be expressed in relation to the potential storage capacity of the dams in a catchment area, and it should be obtained from runoff time series of a gauging station.
Hence, differences between the storage in different years can be expressed as a transformation from a runoff signal of a reference year (Qr)into the signal of an observed year (Qo).
The reference year is that year in the time series which shows the highest monthly discharge.
Under natural conditions, the year-to-year difference in the volume of the snow cover represents such a change of the storage properties in a catchment. The different shapes of the hydrograph are a result of the different snow volumes or different snow melting in each year. The redistribution of the discharge volume between two corresponding flow regimes Qrand Qocan be understood as storage change 1S.
The storage change 1S can be calculated only after ex-cluding significant trends of the annual discharges. This done, 1S can be described as a transformation between the signals Qoand Qr through the emptying process of a linear
single storage. To eliminate temporal trends of the annual discharges, the monthly discharges are standardised to the mean of the annual discharges in the time series.
The emptying process of a single storage can be expressed as (from Dyck and Peschke, 1995):
Qo(m · 1t ) = (1 − e−1t /K) · m
X
v=1
Qre−[(m−v)1t ]/K (1)
Qo(m·1t ) is the outflow at time tm. The constant K
de-scribes the rate of the emptying process and, as a conse-quence, the transformation of Qr to Qo in the limits of 1
to m. m is the duration of the emptying process. When K is large, the storage empties rapidly. Contrary a smaller K delays the emptying and results in a smaller emptying rate.
78 R. R¨odel and T. Hoffmann: Quantifying the efficiency of river regulation 0.00 0.05 0.10 0.15 0.20 0.25 1 2 3 4 5 6 7 8 9 10 11 12 0.00 0.05 0.10 0.15 0.20 0.25 1 2 3 4 5 6 7 8 9 10 11 12 time time (a) (b) High emptying rate, short length of emptying
High emptying rate, short length of emptying
small emptying rate, long length of emptying
small emptying rate, long length of emptying s tandar diz e d runoff s tandar diz e d runoff reference signal Emptying process of a
linear single storage Emptying volume betweenthe two signals which have to be „balanced“
observed signal
Fig. 4. Transformation between two hydrographs caused by the
emptying process of a linear single storage. (a) Transformation of a signal that is shifted forward approximately one time unit. Emp-tying of the observed signal occurs rapidly. The constant K of this process is estimated as 1.9. (b) Transformation of a smoothed sig-nal. The duration of the emptying process is 5 time units and K is estimated as 1.1.
Figure 4a shows the integral between the two hydrographs to be compensated. Signal Qois shifted forward by one time
unit, relative to Qr. K is high and the storage duration is low,
indicating a fast emptying process.
In contrast, Fig. 4b visualises the properties of the storage under the influence of river regulation. The peak is smoothed down, and the discharge volume is reduced and distributed over the subsequent months. The storage duration is longer because the emptying process is delayed. Therefore, the stor-age change 1S can be characterised by two properties. First, it is described by the integral of the monthly differences be-tween the regimes Qr and Qoin the limits of the most
pro-nounced emptying process. To identify a significant
empty-15
estimated as 1.9. b: Transformation of a smoothed signal. The duration of the emptying
process is 5 time units and K is estimated as 1.1.
Suorvadammen (1972) Vietas-Satisjaure (1966) Porjus (1914) Harsprånget (1952) 5900 1260 600 6 Ligga (1954) 5 Messaure (1963) 54 Vittjärv (1974) 13 68 Letsi (1967) Akkat (1973) 42 98 Randi (1976) 460 Parki (1970) 1675 Seitevare (1967) 27 Porsi (1961) Laxede (1962) 15 Boden (1971) 1 Annual discharge 15 362 Mio m³ 9-500 08 9-500 11 9-500 07 9-500 19 9-591 Suorvadammen (1972) Vietas-Satisjaure (1966) Porjus (1914) Harsprånget (1952) 5900 1260 600 6 Ligga (1954) 5 Messaure (1963) 54 Vittjärv (1974) 13 68 Letsi (1967) Akkat (1973) 42 98 Randi (1976) 460 Parki (1970) 1675 Seitevare (1967) 27 Porsi (1961) Laxede (1962) 15 Boden (1971) 1 Annual discharge 15 362 Mio m³ 9-500 08 9-500 11 9-500 07 9-500 19 9-591
fig. 5: The dam cascade of the Luleälven River, northern Sweden. The gross dam capacity is
given in 10-6 m³, along with the year of construction. The small boxes indicate five
representative gauging stations for which long-term discharge times series are available.
Fig. 5. The dam cascade of the Lule¨alven River, northern Sweden.
The gross dam capacity is given in 10−6m3, along with the year of construction. The small boxes indicate five representative gauging stations for which long-term discharge times series are available.
ing process, it is sufficient to compare successive differences between two hydrographs. These differences must represent the greatest integral of successive differences.
Kbeing the outflow per time unit (i.e. the emptying rate), every positive difference between the discharges is an ex-pression of the current K in Qr and Qo. Equation (1) also
shows that the duration of the emptying process should also be taken into account. For practical purposes, the duration of the emptying process also provides information on K. Tech-nical storage usually leads to a delay of the outflow. The emptying speed is reduced, and K with it, and emptying pro-cess takes longer.
Therefore, the duration of the emptying process can be used as an indicator for the transition of 1S in case of ad-ditional technical storing in the catchment. A storage change 1Sis indicated by an annually varying storage in the catch-ment area. Thus, the natural variability of 1S can be defined. After the installation of an additional technical storage, 1S will usually climb to higher levels. Both the integral of the emptying process for the transformation from Qr to Qoand
the duration of the emptying process increase.
To describe 1S, the integral of the monthly differences be-tween Qrand Qocan be determined in the limits of the
emp-tying process. This integral is labelled I (1S). As in the cal-culation of the impoundment coefficient, the values of I (1S) can be standardised as volumes using the annual discharges. This approach allows to directly compare the impoundment coefficient, which was derived from the upstream reservoir capacity, with I (1S), which was observed in the discharge records.
R. R¨odel and T. Hoffmann: Quantifying the efficiency of river regulation 79
16
fig. 6: Impoundment coefficient - i.e. the ratio of the cumulated dam capacity to the average
annual discharge of regulated gauging stations - for Europe in 1990.
0 0.1 0.2 0.3 0.4 0.5 0.6 0.7 1900 1910 1920 1930 1940 1950 1960 1970 1980 1990 impoundment coefficient (impoundment volume / annual discharge)
µ1= 0.11
µ2= 0.22
µ3 = 0.37
∆∆∆∆S = 0.25
year
I(∆S) - integral of the monthly differences between Qrand Qoin the bounds of
the emptying process in relation to the annual discharge
0,0 0,1 0,2 0,3 1 2 3 4 5 6 7 8 9 10 11 12 regulated unregulated flow coefficient month I (∆∆∆∆S)
fig. 7: Impoundment coefficient and standardised I(∆S) in the natural system (µ1) and under
regulation (µ2 to µ3). Station 9-500 08, Boden, Luleälven, northern Sweden. Small diagram:
natural and regulated flow regimes.
Fig. 6. Impoundment coefficient – i.e. the ratio of the cumulated dam capacity to the average annual discharge of regulated gauging stations
– for Europe in 1990.
Figure 4b illustrates the effect of the duration of the empty-ing process. In addition, in the case of similar integral values, this duration also describes the effect of a technical storage. The duration of the emptying process is labelled D(1S). The product of I (1S) and D(1S) can be used as an indicator to better clarify phase transitions to a technical storage.
These methods were used to describe the regulated dis-charges of the Lule¨alven in northern Sweden. The catchment area includes several large lakes and many dams which com-bine to form a storage cascade. The dam cascade serves pri-marily as a source of hydro-power in the wintertime.
Figure 5 shows the dam cascade as well as the reservoir capacity and construction year of each dam. The storage change 1S was calculated for the five gauging stations in Fig. 3, using the respective time series from SMHI (SMHI, 1995).
3 Results and discussion
3.1 Dam capacity per catchment in Europe
Having determined the catchment areas for 677 gauging sta-tions, it became possible to calculate the cumulated volume of the related upstream dams. Figure 6 presents the dam vol-ume in relation to the annual discharge of the year 1990. This is the impoundment coefficient. At 77 stations (11%), the impoundment coefficient exceeds 0.2. It may assumed that these stations are significantly affected by dams. Another
282 stations (42%), with coefficients between 0 and 0.2, are affected to a lesser extent.
It should be kept in mind that most of the selected gauging stations represent relatively large catchment areas. In many cases, their annual discharge volume exceeds the upstream reservoir capacity. Moreover, the reservoir capacity as given in the ICOLD database often includes the volume of natural lakes fitted with a dam. For this reason, the impoundment coefficients from Scandinavia appear comparatively high. 3.2 Efficiency of river regulation (Northern Sweden) The integral I (1S) of the gauging stations along the Lule¨alven River (see Fig. 5) was calculated for each year of the time series. The highest runoff occurred in 1918, making it the reference year Qr. The standardised I (1S) curves of
the five gauging stations under investigation (Fig. 7) clearly indicate the effect of dams. 1S increases in two steps. The small diagram in Fig. 7 shows the natural and the regulated flow regimes of station 9-500 08.
Although dam construction in this catchment area began early, I (1S) leaps to a higher level only in 1940. Obviously, there was no dam construction at the upstream branches dur-ing the initial phase of lake management. The second signifi-cant increase occurs only in 1970 and is clearly related to the contemporaneous increase of the impoundment coefficient.
The average discharge volume redistributed by the tech-nical storage system is expressed by the difference between
80 R. R¨odel and T. Hoffmann: Quantifying the efficiency of river regulation
Table 1. Mean I (1S) at gauging stations of the Lule¨alven River during each of three regulation periods. The values of stations 9-591 and
9-500 11 during periods 1 and 2 are identical on the 99-percent significance level (t test).
Gauging station/ 9-591 9-500 19 9-500 07 9-500 11 9-500 08
Mean storage capability (unregulated) (regulated since 1922) (regulated since 1922) (regulated since 1967) (regulated since 1922) period 1 (1900–1940) mainly unregulated 0.23 0.17 0.14 0.18 0.11 period 2 (1941–1970) regulated in upper Stora Lule¨alven 0.20 0.46 0.34 0.19 0.22 period 3 (1971–1990) mainly regulated 0.21 0.58 0.49 0.38 0.37 0 0.1 0.2 0.3 0.4 0.5 0.6 0.7 1900 1910 1920 1930 1940 1950 1960 1970 1980 1990
impoundment coefficient (impoundment volume / annual runoff volume)
µ 1= 0.11 µ2= 0.22 µ3 = 0.37 µ3 −µ1= 0.26 I (∆S) year
I(∆S) - integral of the monthly differences between Qrand Qtin the
bounds of the emptying process in relation to the annual discharge
0,0 0,1 0,2 0,3 1 2 3 4 5 6 7 8 9 10 11 12 regulated unregulated flow coefficient month
Fig. 7. Impoundment coefficient and standardised I (1S) in the natural system (µ1) and under regulation (µ2 to µ3). Station 9-500 08,
Boden, Lule¨alven, northern Sweden. Small diagram: natural and regulated flow regimes.
the means of I (1S) during the two periods 1970 to 1990 and 1900 to 1940 (µ3−µ1in Fig. 7). Note that standardised
I(1S) values were used. The difference µ3−µ1 amounts to 0.25, i.e. a quarter of the annual runoff is redistributed because of the dam cascade. The efficiency of the dam cas-cade is the ratio of this storage potential, assessed through the runoff record, to the impoundment coefficient, which was de-rived from the gross capacity of the dam cascade. The dam efficiency at the Lule¨alven in the period from 1970 to 1990 is 0.38, i.e. the impoundments actually utilise 38% of the gross dam capacity for river regulation.
Figure 8 shows the development of I (1S) at the individual gauging stations along the dam cascade. Station 9-500 19 is located at the upper branches of the Lule¨alven. According to ICOLD (1998), it has been affected by regulation only since the construction of the Suorvadammen in 1972. However, the hydrologic yearbooks (SMHI, 1995) indicate a regulation impact since 1922. In Fig. 8, however, this effect can be
recognized by higher values of I (1S) only since about 1940. The outflows of the lake Stora Lulevatten upstream station 9-500 19 are therefore regulated considerably since the year 1940.
The records from station 9-500 07 support this view. Al-though there was an upstream dam since 1914, I (1S) in-creases only in 1940. The impact of the upstream station 9-500 19 is also visible. The pre-1967 record from station 9-500 08 represents the natural variability of I (1S). The increase around 1967 corresponds to the construction of up-stream dams at that time. As a reference, the values of the completely non-regulated station 9-591 are also given.
Three different I (1S) levels are discernible in Fig. 8. They reflect different intensities of the river discharge reg-ulation. Table 1 gives the (standardised) average values of I(1S) for each station during each of the three periods. The dam-induced increase of I (1S) can be estimated from the difference between the means of periods 2 or 3 and period
R. R¨odel and T. Hoffmann: Quantifying the efficiency of river regulation 81 0,00 0,10 0,20 0,30 0,40 0,50 0,60 0,70 0,80 0,90 1900 1910 1920 1930 1940 1950 1960 1970 1980 1990 9-591 (unregulated) 9-500 19 (regulated since 1922) 9-500 07 (regulated since 1922) 9-500 08 (regulated since 1922) 9-500 11 (regulated since 1967) period 1 period 2 period 3 I(∆S) year
Fig. 8. I (1S) along the dam cascade of the Lule¨alven River. There is little or no regulation during period 1, regulation at the upper reaches
during period 2 (stations 9-500 19 and 9-500 07), and general regulation during period 3. See Table 1 for the average I (1S) values during each period.
1. The result can be directly compared to the impoundment coefficient (see Sect. 2.2).
It now becomes clear that station 9-591 is unaffected by regulation. The discharges of station 9-500 11 are affected only during period 3. Stations 9-500 19 and 9-500 07 show the strongest regulation impact, which decreases towards the mouth of the Lule¨alven River. Here, at station 9-500 08, the mean I (1S) during periods 1 and 3 is lower than at stations 9-500 19 and 9-500 07.
4 Summary and conclusions
The objective of this study was to develop methods for quan-tifying the intensity of river regulation using global runoff records. Two different approaches were introduced and dis-cussed. In the first, established approach (V¨or¨osmarty et al., 1997), the upstream dam volume is compared with the up-stream volume of the annual discharge and calculated the im-poundment coefficient. This requires that the catchment area of the station be determined. One way to do this is to relate the upstream storage capacity to individual gauging stations using geo-referenced dam statistics. The authors generated a geo-referenced data set of European dams and used a sink-to-source flow algorithm to link dams to gauging stations. Subsequently, the impoundment coefficients were calculated for 677 stations in Europe.
The second, new approach assesses the effects of river regulation directly from hydrologic records. It measures the actually stored discharge volume 1S, as compared to a reference hydrograph. The impoundment coefficient indicates the potential volume of the technical storage
systems. The storage change 1S, in contrast, measures the actually observable effect of river regulation. The impoundment coefficient should be used if the time series reflecting river regulation is rather short. The 1S approach requires long-term discharge records, or records extended using appropriate methods.
Edited by: P. Krause, K. Bongartz, and W.-A. Fl¨ugel Reviewed by: anonymous referees
References
Alcamo, J., D¨oll, P., Henrichs, T., et al.: Development and test-ing of the WaterGAP 2 global model of water use and availabil-ity, Hydrological Sciences Journal – Journal des Sciences Hy-drologiques, 48 (3), 317–337, 2003.
Aurada, K. D.: Co-evolvierende + co-respondierende Systeme = co-operierendes System, Erdkunde, 57/ 4, 309–330, 2003. Bodo, B.: Monthly Discharge Data for World Rivers, http://dss.
ucar.edu/datasets/ds552.1/, date of access: 7.1.2005.
DCW: Digital Charts of the World, Server: http://www.maproom. psu.edu/dcw, date of access: 7.1.2005.
Dettinger, M. D. and Diaz, H. F.: Global Characteristics of Stream Flow Seasonality and Variability, J. Hydrometeor., 8 (1), 289– 310, 2000.
D¨oll, P. and Lehner, B.: Validation of a new global 30-min drainage direction map, J. Hydrol., 258, 214–231, 2002.
Dyck, S. and Peschke, G.: Grundlagen der Hydrologie, Berlin, Ver-lag f¨ur Bauwesen, 1995.
Fiske, G. and Yoffe, S.: Use of GIS for analysis of indicators of conflict and cooperation over international freshwater resources, http://www.transboundarywaters.orst.edu/publications/, date of access: 7.1.2005, 2001.
82 R. R¨odel and T. Hoffmann: Quantifying the efficiency of river regulation
ICOLD: World Register of Dams = Registre mondial des barrages, International Commission on Large Dams, Paris, 1984 and 1998. GRDC: The Global Runoff Data Centre, D-56002 Koblenz,
Ger-many, http://grdc.bafg.de/, date of access: 7.1.2005.
Hoffmann, T.: Automatenbasierte Korrektur und Bearbeitung dig-italer Gew¨assernetzgraphen, in: Angewandte Geoinformatik 2004, edited by: Strobl, J., Blaschke, T., and Griesebner, G., Wichmann, Heidelberg, 243–248, 2004.
McClelland, J. W., Holmes, R. M., and Peterson, B. J.: Increasing river discharge in the Eurasian Arctic: Consideration of dams, permafrost thaw, and fires as potential agents of change, J. Geo-phys. Res., 109, 1–12, 2004.
Nilsson, C., Reidy, C. A., Dynesius, M., and Revenga, C.: Frag-mentation and flow regulation of the world’s large river systems, Science, 308 (5720), 405–408, 2005.
SMHI: Vattenf¨oring i Sverige Del. 1. Vattendrag till Bottenviken, Norrk¨oping, 1995.
SRTM30: Shuttle Radar Topography Mission, Server: ftp: //edcsgs9.cr.usgs.gov/pub/data/srtm/SRTM30, date of access: 7.1.2005.
V¨or¨osmarty, C. J., Sherma, K. P., and Fekete, B. M., et al.: The Stor-age and Aging of Continental Runoff in Large Reservoir Systems of the World, AMBIO 6/1997, 210–219, 1997.