HAL Id: hal-00317015
https://hal.archives-ouvertes.fr/hal-00317015
Submitted on 1 Jan 2003
HAL is a multi-disciplinary open access
archive for the deposit and dissemination of
sci-entific research documents, whether they are
pub-lished or not. The documents may come from
teaching and research institutions in France or
abroad, or from public or private research centers.
L’archive ouverte pluridisciplinaire HAL, est
destinée au dépôt et à la diffusion de documents
scientifiques de niveau recherche, publiés ou non,
émanant des établissements d’enseignement et de
recherche français ou étrangers, des laboratoires
publics ou privés.
April 2000 geomagnetic storm: ionospheric drivers of
large geomagnetically induced currents
A. Pulkkinen, A. Thomson, E. Clarke, A. Mckay
To cite this version:
A. Pulkkinen, A. Thomson, E. Clarke, A. Mckay. April 2000 geomagnetic storm: ionospheric drivers
of large geomagnetically induced currents. Annales Geophysicae, European Geosciences Union, 2003,
21 (3), pp.709-717. �hal-00317015�
Annales
Geophysicae
April 2000 geomagnetic storm: ionospheric drivers of large
geomagnetically induced currents
A. Pulkkinen1, A. Thomson2, E. Clarke2, and A. McKay3
1Finnish Meteorological Institute, Geophysical Research Division, P.O. Box 503, FIN-00101, Finland 2British Geological Survey, Edinburgh, EH9 3LA, UK
3Department of Geology and Geophysics, University of Edinburgh, EH9 3JW, UK
Received: 15 May 2002 – Revised: 15 August 2002 – Accepted: 30 August 2002
Abstract. Geomagnetically induced currents (GIC) flowing
in technological systems on the ground are a direct manifes-tation of space weather. Due to the proximity of very dy-namic ionospheric current systems, GIC are of special inter-est at high latitudes, where they have been known to cause problems, for example, for normal operation of power trans-mission systems and buried pipelines. The basic physics un-derlying GIC, i.e. the magnetosphere – ionosphere interac-tion and electromagnetic inducinterac-tion in the ground, is already quite well known. However, no detailed study of the drivers of GIC has been carried out and little is known about the relative importance of different types of ionospheric current systems in terms of large GIC. In this study, the geomagnetic storm of 6–7 April 2000 is investigated. During this event, large GIC were measured in technological systems, both in Finland and in Great Britain. Therefore, this provides a ba-sis for a detailed GIC study over a relatively large regional scale. By using GIC data and corresponding geomagnetic data from north European magnetometer networks, the iono-spheric drivers of large GIC during the event were identified and analysed. Although most of the peak GIC during the storm were clearly related to substorm intensifications, there were no common characteristics discernible in substorm be-haviour that could be associated with all the GIC peaks. For example, both very localized ionospheric currents structures, as well as relatively large-scale propagating structures were observed during the peaks in GIC. Only during the storm sudden commencement at the beginning of the event were large-scale GIC evident across northern Europe with coher-ent behaviour. The typical duration of peaks in GIC was also quite short, varying between 2–15 min.
Key words. Geomagnetism and paleo-magnetism
(geomag-netic induction) – Ionosphere (ionospheric disturbances) – Magnetospheric physics (storms and substorms)
Correspondence to: A. Pulkkinen (antti.pulkkinen@fmi.fi)
1 Introduction
Rapid geomagnetic variations were first connected with in-duction phenomena and electric currents flowing in techno-logical systems on the ground in the mid 1800s. In partic-ular, geomagnetically induced currents (GIC) were found to cause disturbances in the operation of telegraph equipment (Barlow, 1849). Since then the number of technological sys-tems having long conductors has increased rapidly, and var-ious networks, such as power transmission systems, buried pipelines, telecommunication cables and railway signalling systems, have been found to be affected by GIC to varying degrees (e.g. Lanzerotti et al., 1999; Boteler et al., 1998).
The basic mechanism producing GIC in conductor sys-tems is quite well understood and several models for a tailed calculation of GIC systems in particular have been de-veloped (e.g. Lehtinen and Pirjola, 1985; Pulkkinen et al., 2001b; Trichtchenko and Boteler, 2001). In general, GIC are driven by rapid variations of ionospheric currents. At high latitudes, where the most intense GIC are experienced, these variations are thought to be related to the intensification of the electrojets during enhanced ionospheric convection con-ditions and to the development of the substorm current wedge during geomagnetic substorms.
Model calculations of GIC information, based on iono-spheric current models, about the Earth’s conductivity struc-ture and on the electrical and geometrical characteristics of individual technical systems have been made and corre-sponding GIC flowing in different parts of conductor sys-tems have been studied (e.g. Viljanen et al., 1999; Favetto and Osella, 1999; Kappenman et al., 2000; Pulkkinen et al., 2001b). Also, studies have been carried out where the geo-electric field is computed directly from the measured ground geomagnetic field (e.g. Viljanen, 1998). With the availabil-ity of large geomagnetic databases, these computations have been able to provide statistical estimations of the likelihood of occurrence of GIC in particular systems or regions (e.g. Langlois et al., 1996; Pulkkinen et al., 2000, 2001a).
ex-710 A. Pulkkinen et al.: April 2000 storm: ionospheric drivers of large GIC
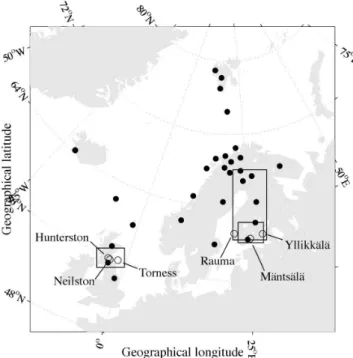
Fig. 1. IMAGE and SAMNET magnetometer array station locations
(black dots) and the GIC measurement sites in the Scottish (Hunter-ston, Neil(Hunter-ston, Torness) and Finnish (Rauma, Yllikk¨al¨a) power sys-tems and in the Finnish natural gas pipeline (M¨ants¨al¨a) (circles). The approximate spatial coverage of the systems is shown with boxes. The westernmost box indicates the Scottish power system, the larger box in the east covers the Finnish power system and the smaller box, the Finnish pipeline.
ists no well-established picture of the detailed structure of the ionospheric currents driving the largest GIC. Some rough estimates of the electrojet intensity and morphology dur-ing GIC events have been carried out (e.g. M¨akinen, 1993; Bolduc et al., 1998, 2000; Boteler, 2001), but no rigorous study of realistic ionospheric source currents is available.
The aim of this study is to investigate a single intense geo-magnetic storm on 6–7 April 2000. During this storm, large GIC were measured in technological systems, both in Fin-land and in Great Britain, thus providing GIC data on a rela-tively large spatial scale. By using these GIC data, together with magnetic measurements from IMAGE and SAMNET magnetometer networks, the ionospheric drivers of the large GIC during the event are identified and described. In parallel with the present investigation is the study by Huttunen et al. (2002), in which the entire Sun-solar wind-magnetosphere-ionosphere-ground chain was analysed for the same geomag-netic storm. Some of the findings of this study are used to link GIC discussed here to the large-scale solar wind and magnetospheric phenomena.
In Sect. 2, we identify data types and sources and the meth-ods used in the study. Section 3 is devoted to a detailed analysis of the GIC and ionospheric drivers during the April 2000 storm. In Sect. 4 we relate findings in Sect. 3 to larger scale solar wind and magnetospheric dynamics. Finally, in Sect. 5 we briefly summarise our findings and discuss their
implications.
2 Data sources and analysis methods
The geomagnetic data used in the study were obtained from the IMAGE and SAMNET magnetometer networks operat-ing in the northern part of Europe (Fig. 1). One-minute data were used and a baseline was determined visually for each station before being subtracted from the data to provide the disturbance field. Due to the intensity of the storm, the accu-racy of these baselines is not critical.
GIC measurements were obtained from the Scottish and Finnish high-voltage power transmission grids and from the Finnish natural gas pipeline network (Fig. 1). Since we are interested only in general features of the GIC related phe-nomena, in Fig. 1 we show only the approximate coverage of the networks. For a more detailed study of the behaviour of GIC in specific systems, the detailed structure of the net-works would need to be considered.
The power system GIC are found by measuring the current flowing through the neutral line connecting the three phases of the power transformer to the ground. Pipeline GIC mea-surements are, in turn, carried out by measuring the magnetic field, caused by the current flowing along the pipeline, right above the pipeline (Pulkkinen et al., 2001a). The GIC record-ings at the Finnish pipeline commenced in November 1998, and thus, data for over 3.5 years exists to date. All GIC data were produced with a ten-second time resolution.
The geomagnetic data were investigated by the spheri-cal elementary current system (SECS) method (Amm, 1997; Amm and Viljanen, 1999). In this approach, the ground magnetic data are converted to ionospheric equivalent cur-rent density patterns.
The separation of the magnetic field into external and in-ternal parts was not carried out prior to computation of equiv-alent currents. This may result in a slight overestimation of current amplitudes (Tanskanen et al., 2001), but will not have a significant effect on the morphology of current patterns. It should be noted that large spatial gaps in the data result in unreliable estimates of equivalent current patterns (for exam-ple, in the region between Svalbard and the Faeroe Islands). However, in areas with relatively high spatial density data, the estimates for equivalent currents can be regarded as reli-able (Pulkkinen et al., 2002).
The error of the fit between the measured magnetic field and the magnetic field given by the model at each time step (a measure indicating the ability of the equivalent current model to reproduce the observed fields) is given as a root-mean-square (rms) error, summed over each magnetometer. The median rms during the disturbed period (6 April, 16:40 UT – 7 April, 04:00 UT) is 8 nT. This is very small, consider-ing that the amplitudes of geomagnetic variations durconsider-ing the event are several hundreds of nanoteslas.
It should be noted that in general, and excluding some spe-cial cases (e.g. Untiedt and Baumjohann, 1993), equivalent currents are not equal to the true 3-D ionospheric current
sys-17:00 18:00 19:00 20:00 21:00 22:00 23:00 -1000 0 1000 2000 3000 4000 5000 6000 7000 X [nT] UT [h] 54.0N 55.3N 57.2N 59.9N 60.1N 60.5N 62.0N 62.1N 62.3N 64.5N 64.6N 64.9N 66.9N 67.4N
Fig. 2. X-component of the ground geomagnetic field on 6 April
2000 at some of the IMAGE and SAMNET stations. Curves for stations are ordered from the south to the north. SAMNET stations are indicated by black dots. Vertical dashed lines indicate the times 16:41, 18:07, 20:55, 21:24 and 23:15 UT, respectively.
tem. In order to solve the true 3-D system, the ionospheric electric field or field-aligned currents over the area need to be supplied (e.g. Amm, 2001). These are not available for the present study. We only have ground magnetic data, which, however, has a relatively good coverage over the region of interest. In addition, equivalent currents are fully sufficient for the purposes of this study.
To examine the characteristics of the electric field at the surface of the Earth, we compute the time derivative of the ground horizontal magnetic field (dH/dt, H = X + Y), to give a reasonable measure of the induction or GIC activity (Viljanen et al., 2001). We then rotate the computed dH/dt vectors 90 degrees anticlockwise, to be roughly parallel to the large-scale surface electric field, Esur. Since GIC is
closely related to the spatially integrated surface electric field in which small-scale (∼ 1 km) variations are smoothed out, and since only the basic structure of the induced field is of interest here, dH/dt is identified with Esurbelow.
3 Drivers of large GIC during the 6–7 April 2000
geo-magnetic storm
Before analyzing the drivers of large GIC, we need to define the term “large”. The impact of quasi-dc GIC, for example, on power system transformers, depends on the magnitude and duration of the GIC and on the design, loading and set-up of the system (e.g. Kappenman and Albertson, 1990; Lahti-nen and Elovaara, 2002). It follows that no general “rule of thumb” on GIC magnitudes can be easily assigned. However, according to statistics by Pulkkinen et al. (2001a), GIC over 5 A at M¨ants¨al¨a station of the Finnish natural gas pipeline can be expected for 100 min per year, when averaged over several solar cycles. During the 6–7 April 2000 storm, GIC exceeded 5 A at M¨ants¨al¨a for a 25-min period. Thus, we
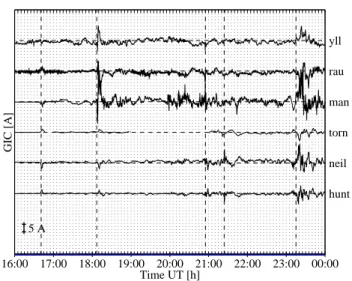
yll GIC [A] rau man torn neil hunt 5 A 16:00 17:00 18:00 19:00 20:00 21:00 22:00 23:00 00:00 Time UT [h]
Fig. 3. GIC at the Scottish and Finnish power transformer neutrals
and in the Finnish pipeline on 6 April 2000. yll = Yllikk¨al¨a, rau = Rauma, man = M¨ants¨al¨a, torn = Torness, neil = Neilston, hunt = Hunterston. Vertical dashed lines indicate the times 16:41, 18:07, 20:55, 21:24 and 23:15 UT, respectively.
might anticipate four geomagnetic storms having the activity level of the April 2000 storm per year at M¨ants¨al¨a. So we may say that GIC of 5 A are relatively rare at M¨ants¨al¨a and that 5 A is, therefore, considered our definition of “large”. Also note that in the Scottish power grid, GIC exceeding 5 A have been observed only a few times since continuous mea-surements began in 2000.
At the onset of the storm, at 16:41 UT, the geomagnetic sudden commencement (SC) produced a global enhancement of the geomagnetic field (Fig. 2) and caused the first large GIC both in the UK and Finland (Fig. 3). The amplitude of GIC is 2–5 A at all the measurement locations and the enhancement of the GIC lasts about 5 mins. The Esur
pat-tern (Fig. 5) shows a coherent west to southwest orientation during the SC (up to 16:40:00–16:41:40 UT). Around 16:42
Esurin Fennoscandia adopts a more north-south orientation,
but remains westerly over the UK. Subsequently, a pair of re-gions is established in which Esuris driven westward, south
of the 60 degrees geomagnetic latitude, and eastwards, north of 60 degrees geomagnetic latitude. This structure persists for only one minute before reversing in sign. Thereafter, there are a number of intervening periods of north-south
Esur. By 16:47 UT, when GIC have already dropped, Esur
becomes largely irregular over the region. Thus, the first impact is quite coherent across the studied region. This is in accordance with the basic SC model of Araki (1994), in which a global magnetic signature is observed for a few min-utes during the passage of the MHD wave produced by the impact of the interplanetary shock. However, the pulse shape usually observed during a SC in the magnetic field in the lo-cal afternoon is not clearly present.
At 18:07 UT large enhancements of GIC are observed at the Finnish stations, with the largest value (20 A) being
mea-712 A. Pulkkinen et al.: April 2000 storm: ionospheric drivers of large GIC yll GIC [A] rau man torn neil hunt 5 A 00:00 01:00 02:00 03:00 04:00 Time UT [h]
Fig. 4. GIC at the Scottish and Finnish power transformer neutrals
and in the Finnish pipeline on 7 April 2000. yll = Yllikk¨al¨a, rau = Rauma, man = M¨ants¨al¨a, torn = Torness, neil = Neilston, hunt = Hunterston. The vertical dashed line indicates the time 02:00 UT.
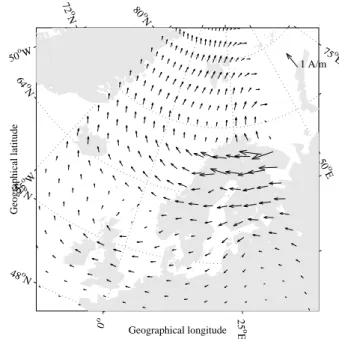
sured at M¨ants¨al¨a. These GIC coincide with a substorm on-set that causes the intensification of the eastward electro-jet and the penetration of the westward electroelectro-jet into the Fennoscandian region (Fig. 6). Only a couple of minutes af-ter the intensifications at the Finnish stations, GIC enhance-ments are also observed in the UK. However, the amplitudes of GIC in the UK are roughly half of those observed in Fin-land. Presumably this follows from the fact that the east-ward electrojet is just north of the British Isles and thus, the largest geomagnetic disturbances caused by this substorm are not seen in the UK. Prior to 18:07 UT, Esur shows
lit-tle coherence across northern Europe. Between 18:07 and 18:09 UT, a localized enhanced Esur is observed to develop
over Finland and Sweden, between 50 and 60 degrees ge-omagnetic latitude. One characteristic is that the orienta-tion of the Esur pattern changes rapidly. In the UK, Esur is
consistently westwards over this time interval, turning east-wards after 18:12 UT. By 18:15 UT, Esurhas returned to
be-ing small and irregularly oriented across the whole region. Large Finnish GIC (> 5 A) are observed for a period of ap-proximately 6–7 min. The period corresponds roughly to the intensification of the substorm time electrojets.
During the period 19:50–22:00 UT, several GIC enhance-ments are seen both in the UK and in Finland. Let us con-centrate on events that took place at 20:55 UT and 21:24 UT. At 20:55 UT a westward electrojet enhancement was accom-panied by a very local current system in the vicinity of the Nurmij¨arvi Geophysical Observatory. Although some mag-netic signatures are seen at other IMAGE stations, Esur is
several times larger at Nurmij¨arvi. Thus, the spatial scale of the most intense current system is around 100 km, at most. (Unfortunately, a more detailed study of the structure in the ionosphere is impossible, due to the lack of high spatial den-sity data.) This localized current system produced GIC of 14 A at M¨ants¨al¨a. Only about half of this current was
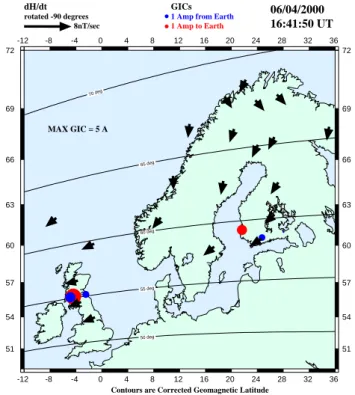
mea--12˚ -12˚ -8˚ -8˚ -4˚ -4˚ 0˚ 0˚ 4˚ 4˚ 8˚ 8˚ 12˚ 12˚ 16˚ 16˚ 20˚ 20˚ 24˚ 24˚ 28˚ 28˚ 32˚ 32˚ 36˚ 36˚ 51˚ 51˚ 54˚ 54˚ 57˚ 57˚ 60˚ 60˚ 63˚ 63˚ 66˚ 66˚ 69˚ 69˚ 72˚ 72˚ 50 deg 55 deg 60 deg 65 deg 70 deg
Contours are Corrected Geomagnetic Latitude
06/04/2000 8nT/sec dH/dt rotated -90 degrees GICs 1 Amp to Earth
1 Amp from Earth
16:41:50 UT
MAX GIC = 5 A
Fig. 5. GIC at the Scottish and Finnish power transformer neutrals
and in the Finnish pipeline and the 90 degrees anticlockwise rotated
dH/dt pattern (Esur) of the geomagnetic field on the ground on
6 April 2000 at 16:41 UT. Red indicates current toward the east at M¨ant¨al¨a. See text in Sect. 3 for details.
sured at other Finnish stations, emphasizing the locality of the driver. Scottish measurements were between 3 A – 4.5 A and thus clearly above any background noise level. This suggests that intense current changes in the vicinity of Nur-mij¨arvi may be embedded in some larger scale changes of ionospheric currents. GIC above 5 A are observed for one minute at M¨ants¨al¨a. At 21:24 UT GIC enhancements are ob-served at the UK stations. This is the only time during the entire storm period when large GIC are observed only in the UK, with no clear enhancement of GIC at the Finnish sta-tions. In terms of equivalent currents, it is the development of the westward current above the UK that drives the GIC (see Fig. 7). The enhancement of currents above the UK is related to the reconfiguration of the westward electrojet above the IMAGE chain. This is seen from Fig. 8, where the difference of equivalent currents at 21:23 and 21:26 UT is shown, and where, apart from a region above the north of the UK, an enhancement of equivalent currents is also ob-served above southern Finland (at about 60◦N). In addition, a change in currents is observed in quite a narrow region in central Fennoscandia (at about 65◦N). This is a configura-tion which itself is quite interesting. A similar small-scale current structure roughly at the same latitude is discussed by Untiedt and Baumjohann (1993, p. 333–334), who noted that such structures are often associated with field-aligned current regions. GIC above 4 A are observed for about 1–2 min at the Scottish stations.
Geographical longitude Geographical latitude 50 oW 25 oW 0 o 25 o E 50 o E 75o E 48o N 56 o N 64 o N 72 o N 80 o N 1 A/m
Fig. 6. Ionospheric equivalent currents on 6 April 2000, at 18:09 UT. Rms error of the time step is 16 nT (see text in Sect. 2 for details).
At 23:05 UT the westward electrojet is located over the southern part of the IMAGE network and is also observed in the UK part of SAMNET. Changes in the amplitude of the electrojet at 23:05–23:13 UT (Fig. 9) causes a smooth westward GIC of 5 A at M¨ants¨al¨a. It is quite remarkable that no similar smooth GIC is observed at any other station. This can be explained by looking at the Esur pattern for the
corresponding period from which we see that Esur remains
broadly westward only at the vicinity of M¨ants¨al¨a, until about 23:12 UT, after which it becomes as variable as in the vicin-ity of the other GIC measurement sites, with a corresponding decline in current magnitudes. GIC above 2 A is observed for 2–3 min at M¨ants¨al¨a.
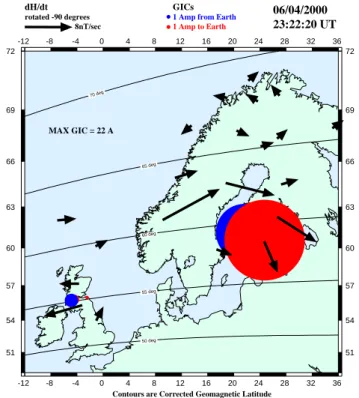
At 23:15 UT a large substorm onset takes place. The ini-tial magnetic disturbance at the Earth’s surface propagates northward, which is a typical feature of substorms (e.g. Ros-toker, 1996). Propagation can be easily seen from Fig. 10, in which the time derivatives of the north component of the magnetic field at some of the SAMNET and IMAGE sta-tions are shown. The time derivative behaves very irregu-larly and indicates that even during clearly identifiable sub-storm events, when the intensity of the westward electro-jet sharply increases, large contributions to GIC come from the small and rapidly changing currents superimposed on the electrojet. Esurpatterns (Fig. 11) switch to a more
predomi-nantly eastward direction during the intervals of strong GIC occurring across northern Europe. However, rapid orienta-tion swings also remain, particularly over the UK during this time. The largest GIC are observed during the expansion phase of the substorm, with peak values varying between 23 A (M¨ants¨al¨a) and 5 A (Torness). After the expansion phase
Geographical longitude Geographical latitude 50 oW 25 oW 0 o 25 o E 50 o E 75o E 48o N 56 o N 64 o N 72 o N 80 o N 1 A/m
Fig. 7. Ionospheric equivalent currents on 6 April 2000, at 21:24 UT. Rms error of the time step is 15 nT (see text in Sect. 2 for details).
of the substorm (roughly at 23:25 UT) GIC, especially at the Finnish stations, decrease notably. However, oscillations of the decreasing westward electrojet and smaller scale current systems cause large GIC at Finnish and UK stations during the rest of the day.
At the beginning of 7 April, the geomagnetic storm has passed its main phase. Southern Finland and northern UK are under an enhanced westward electrojet. Variations of the electrojet cause large GIC in these areas throughout the pe-riod 00:00–01:30 UT (Fig. 4). What is of interest to note is that, according to Huttunen et al. (2002), the only clear sub-storm of the period is seen at 00:30 UT. However, the effect of this substorm does not appear clearly in GIC measure-ments. Equally large, or larger GIC are observed during other times between 00:00 and 01:30 UT. The westward electrojet moves a few degrees northward after 01:00 UT, which causes GIC at UK stations to decrease ahead of GIC at Finnish sta-tions. Esuris largely eastward over Finland and Scotland for
a few minutes following 00:35 UT and again, to a lesser ex-tent, after 00:41 UT. Otherwise, the electric field orientation is strongly variable between east and west in these regions. In the UK a westward Esur is established for a few minutes
around 01:02 UT, driving currents of a few amps, before turn-ing northwards again. The largest GIC of the period are mea-sured at M¨ants¨al¨a, where several peaks exceeding the 10 A are observed. Although oscillations are not as rapid as dur-ing the beginndur-ing of the storm, the durations of large GIC are less than 15 min.
During the period 02:00–04:30 UT, coincident with the re-covery phase of the storm, geomagnetic pulsations drive GIC at all stations. A rough estimate for the period of the
pulsa-714 A. Pulkkinen et al.: April 2000 storm: ionospheric drivers of large GIC Geographical longitude Geographical latitude 50 oW 25 oW 0 o 25 o E 50 o E 75o E 48o N 56o N 64 o N 72 o N 80 o N 0.002 A/ms
Fig. 8. Difference of ionospheric equivalent currents on 6 April
2000. Currents at 21:23 are subtracted from currents at 21:26 UT. Rms error at the time step 21:23 UT is 12 nT; rms error at the time step 21:26 UT is 14 nT (see text in Sect. 2 for details). See also Fig. 7.
tions is 5–8 min, which makes them fall into the Pc5 cat-egory. Pc5 pulsations are thought to be produced by solar wind driven field line resonances that occur at higher lati-tudes (e.g. Chisham and Orr, 1997). The amplilati-tudes of the pulsations decrease towards the south and thus, they create larger GIC at the Finnish stations, with the largest ampli-tudes (2.5 A) located again at M¨ants¨al¨a. Despite the appar-ent coherency of the magnetic signal caused by pulsations, there are no large-scale structures in Esur that behave
co-herently across the whole region at any point between 02:00 and 04:00 UT. Local structures are seen (for example, on the scale of the UK, or of Fennoscandia, north of 60 degrees ge-omagnetic), with a tendency for neighboring Esur vectors to
change from west to east or conversely regularly over the time frame. Reversals in the direction of Esur can take 5–
10 min to accomplish and Esur remains in the new
orienta-tion for a similar time. At the very end of the storm event, an increase in GIC at all stations is observed between 03:25– 03:55 UT, perhaps due to an increase in the amplitude of pul-sations, or due to the appearance of some other current sys-tem superimposed on currents associated with the pulsations. The largest amplitude GIC (6.5 A) is observed at M¨ants¨al¨a.
4 Discussion
We have described in detail characteristics of large GIC and corresponding ionospheric equivalent current systems and ground electric fields during the 6–7 April 2001 mag-netic storm. Below, their relation to larger scale solar wind
Geographical longitude Geographical latitude 50 oW 25 oW 0 o 25 o E 50 o E 75o E 48o N 56o N 64 o N 72 o N 80 o N 0.002 A/ms
Fig. 9. Difference of ionospheric equivalent currents on 6 April
2000. Currents at 23:05 are subtracted from currents at 23:13 UT. Rms error at the time step 23:05 UT is 15 nT; rms error at the time step 23:13 UT is 8 nT (see text in Sect. 2 for details).
and magnetospheric dynamics is discussed. The discussion is based mainly on the results by Huttunen et al. (2002), who investigated this storm from the viewpoint of the Sun-solar wind-magnetosphere-ionosphere-ground chain. Some of their key results, which have relevance for our study, are summarized below.
On 4 April 2000, a coronal mass ejection (CME) was ob-served to leave the Sun. Although the ejecta was not believed to be directly earthward, the sheath region between the shock front and the driver gas hit the Earth’s magnetosphere, caus-ing the largest geomagnetic storm of 2000, as measured by the low-latitude Dst index. The shock impact was observed at 16:40 UT at geostationary orbit on the dayside. Solar wind plasma conditions, namely strongly negative and fluctuating IMF and high dynamic pressure in the sheath region behind the shock produced strongly driven magnetospheric activity. Several ionospheric activations occurred all around the au-roral oval during the storm. Four of these activations, iden-tified from the IMAGE data, showed substorm-like behav-ior (18:05, 20:13, 23:15, 00:30 UT, poleward and westward expansion of the nightside ionospheric current system, ac-companied by particle injections observed at geostationary orbit in the midnight region) and were thus related to the re-lease of the energy stored in the magnetotail. The cause of the increased energy storage during the storm was the strong driving caused by the negative Bz and the high pressure of
the solar wind. Four other activations (17:08, 19:10, 20:55, 22:16 UT) were related to the expansion of the ionospheric current system but clear particle injections were missing. It was suggested by Huttunen et al. (2002) that the first set of
23:05 23:10 23:15 23:20 23:25 23:30 23:35 23:40 23:45 23:50 0 20 40 60 80 100 dX/dt [nT/s] UT [h] 54.0N 55.3N 57.2N 59.9N 60.1N 60.5N 62.0N 62.1N 62.3N 64.5N 64.6N 64.9N 66.9N 67.4N
Fig. 10. The time derivatives of the X-component of the ground
ge-omagnetic field on 6 April 2000 at some of the IMAGE and SAM-NET stations. Curves for stations are ordered from the south to the north. SAMNET stations are indicated by black dots. Vertical dashed line indicates the time 23:15 UT.
activations, especially the last two substorms, was associated with both increased energy input from the solar wind and dy-namic reconfigurations in the magnetotail, whereas the latter activations were possibly direct responses to the solar wind driving.
The largest GIC of the storm period occurred at 18:07 and 23:15 UT (6 April) and were associated with substorms. Both substorms caused large, but incoherent Esur at the area
of northern Europe. Most notably, during the intensification at 23:15 UT, the expansion of substorm related ionospheric currents from lower latitudes towards the north caused a sweep of the ionospheric region. This caused large GIC prac-tically throughout northern Europe.
Localized small-scale features were one of the main char-acters of the storm period. In general, it was seen that al-though the presence of the auroral electrojet favored large GIC, the actual reason for GIC were small-scale features in the ionosphere. In other words, usually |X| |Y | but
|dX/dt| ≈ |dY /dt |, which can be explained only by
small-scale variations in the source currents. The duration of in-dividual GIC spikes was short (a few minutes) and Esur
patterns were changing rapidly and were inhomogeneous as well, which is in accordance with the results by Viljanen et al. (2001), who studied the statistical behavior of the time derivatives of the ground magnetic field. From the sub-storm’s point of view, this type of behavior is quite expected, taking into account the turbulent nature of the phenomenon (e.g. Klimas et al., 2000).
Strong driving of the magnetospheric activity causes the auroral oval to expand towards lower latitudes. At such times, variations in ionospheric currents (electrojets) can cause large GIC at latitudes where GIC is not typically ex-perienced. An example can be seen at 21:24 UT, when the electrojet above the UK embodies variations in currents that cause large GIC at Scottish stations, while Finnish stations
-12˚ -12˚ -8˚ -8˚ -4˚ -4˚ 0˚ 0˚ 4˚ 4˚ 8˚ 8˚ 12˚ 12˚ 16˚ 16˚ 20˚ 20˚ 24˚ 24˚ 28˚ 28˚ 32˚ 32˚ 36˚ 36˚ 51˚ 51˚ 54˚ 54˚ 57˚ 57˚ 60˚ 60˚ 63˚ 63˚ 66˚ 66˚ 69˚ 69˚ 72˚ 72˚ 50 deg 55 deg 60 deg 65 deg 70 deg
Contours are Corrected Geomagnetic Latitude
06/04/2000 8nT/sec dH/dt rotated -90 degrees GICs 1 Amp to Earth
1 Amp from Earth
23:22:20 UT
MAX GIC = 22 A
Fig. 11. GIC at the Scottish and Finnish power transformer neutrals
and in the Finnish pipeline and the 90 degrees anticlockwise rotated
dH/dt pattern (Esur) of the geomagnetic field on ground on 6 April
2000 at 23:22 UT. Red indicates current toward the east at M¨ants¨al¨a. See text in Sect. 3 for details.
do not observe clear GIC enhancements.
Not all large GIC were associated with substorms. For ex-ample, at 20:55 UT substorm onset type intensification was observed at magnetometer stations. However, as was ex-plained above, due to the missing signature of particle injec-tions at geostationary orbit, its morphology is distinct from the classical substorm event. Thus, corresponding large lo-calized GIC at M¨ants¨al¨a cannot be accounted for by sub-storms, but perhaps by some finer structure behavior of the magnetosphere that was directly driven by the solar wind, as suggested by Huttunen et al. (2002). In addition, the geo-magnetic sudden commencement (SC) caused by the intense shock related pressure pulse in the solar wind was seen to cause GIC on a large spatial scale. Shock fronts are often associated with intense geomagnetic storms (e.g. Tsurutani and Gonzalez, 1997) and thus, SCs are one important type of reason for storm related GIC. SC preceding the magnetic storm on 24 March 1991 caused one of the largest ever ob-served GIC (175 A) in the Finnish power system (Viljanen and Pirjola, 1994). On 7 April solar wind directly driven ge-omagnetic pulsations in the local morning region caused a sequence of large GIC. According to Viljanen et al. (2001), local morning is one of the time sectors where large ground magnetic variations (and large Esur) are typically observed.
These variations can possibly be partly explained by pulsa-tions. It should be noted that although the amplitude of the pulsation related GIC were smaller than during substorms,
716 A. Pulkkinen et al.: April 2000 storm: ionospheric drivers of large GIC 12 13 14 15 16 17 18 19 20 21 22 23 24 1 2 3 4 5 6 7 8 9 10 11 0 200 400 600 800 1000 1200 1400 1600 1800 UT [h] #
Fig. 12. Statistical occurrence of GIC above 2.5 A in the Finnish
pipeline. Counts computed for each UT sector correspond to the number of measured 10-s values of GIC above 2.5 A. Statistics are derived using data from November 1998 to May 2002.
the long duration (approx. 02:00–04:30 UT) of the event may give rise, for example, to cumulative corrosion effects expe-rienced by buried pipelines (e.g. Martin, 1993).
To investigate how the GIC driver dynamics discussed above relate to the statistical picture, we computed the statis-tical occurrence of GIC above 2.5 A (GIC above 5 A has oc-curred too rarely for statistical considerations) in the Finnish pipeline. Statistics were computed for each UT sector, re-vealing the times when large GIC are typically observed. Finnish local time is UT + 2 hours. The result is an updated version of the data of Viljanen et al. (2001), where now data from November 1998 to May 2002 are used. In Fig. 12 it can be seen that two clearly distinguishable peaks are present: one in the vicinity of the local midnight, another in the local morning sector. It is known that the most dramatic changes in ionospheric currents during substorms happen in the vicinity of local midnight, and thus, one is tempted to propose that substorms are also in a statistical sense the most important cause for large GIC in the auroral regions. Correspondingly, it is known that many classes of auroral region ULF waves, like Pc5s, are favored at the local morning region (e.g. Ven-nerstrøm, 1999), which was also observed during the April 2000 storm. Thus, it may be that pulsations are the second largest category of cause for large GIC.
Summarizing, clearly identifiable ionospheric drivers of large GIC during the 6–7 April 2000 geomagnetic storm were related to (1) the SSC at the beginning of the storm, (2) pulsations at the end of the storm, (3) substorm onsets during the storm. In addition, various small-scale, although not easily classifiable, features were observed to cause large GIC. Statistical considerations suggested that substorms and pulsations are the most typical cause of large GIC at the au-roral region.
5 Conclusions
Although most of the very largest GIC during the April 2000 storm were clearly related to substorm intensifications, a con-clusion supported also by the statistics, there were no com-mon characteristics in the substorm behavior that could be associated with all the large GIC. For example, both very localized ionospheric current structures and relatively large-scale, propagating structures were observed during individ-ual peak GIC. Only during the sudden commencement at the beginning of the event where there large-scale coherent GIC and surface electric fields across northern Europe. A typical duration of the peak GIC was generally quite short, typically varying between 2–15 min.
In light of the present study, one key issue, related to the possibility of GIC forecasting in the auroral regions, is the predictability of substorms. For this, the time of onset and the location of ionospheric current intensifications need to be known. If these characteristics are given with a sufficient accuracy, regional GIC warnings may be given with a relia-bility that might be acceptable to potential space weather cus-tomers. However, it is clear that for the moment accurate GIC predictions, where the behavior of GIC at individual sites is computed, are not possible with the present knowledge. The dynamics of ionospheric currents have been shown to be too complex for existing predictive methods to cope with.
Although individual case studies, such as those presented here, provide a good basis for understanding basic processes causing large GIC, a more general classification, using a larger database, is required. This will allow a more quan-titative statement of the relative importance of the different ionospheric events producing large ground effects. Such a classification will be one of our goals in future GIC studies. As a start, the more recent 15–16 July 2000 magnetic storm will be of special interest, due to the extremely large GIC observed in Europe.
Acknowledgements. The work of Antti Pulkkinen was supported
by the Academy of Finland. The IMAGE magnetometer array is an international project headed by the Finnish Meteorological Institute (http://www.geo.fmi.fi/image). The authors thank Prof I. R. Mann and Dr D. K. Milling for the SAMNET data. SAMNET is a PPARC National Facility deployed and operated by the University of York. Helpful discussions with Drs. Ari Viljanen, Risto Pirjola and Toby Clark are acknowledged. Fingrid Oyj, Scottish Power and Gasum Oy are thanked for their data and support. This paper is published with the permission of the Executive Director, British Geological Survey (NERC).
Topical Editor M. Lester thanks H. L¨uhr and A. Yahnin for their help in evaluating this paper.
References
Amm, O.: Ionospheric elementary current systems in spherical co-ordinates and their application, J. Geomagn. Geoelectr., 49, 947, 1997.
Amm, O.: The elementary current method for calculating iono-spheric current systems from multisatellite and ground magne-tometer data, J. Geophys. Res., 106, 24 843, 2001.
Amm, O. and Viljanen, A.: Ionospheric disturbance magnetic field continuation from the ground to ionosphere using spherical el-ementary current systems, Earth, Planets and Space, 51, 431, 1999.
Araki, T.: A physical model of the geomagnetic sudden com-mencement, Solar Wind Sources of Magnetospheric Ultra-Low-Frequency Waves, Geophys. Monogr. Ser., 81, (Eds) Engebret-son, M. J., Takahashi, K., and Scholer, M., p. 183, AGU, Wash-ington, D. C., 1994.
Barlow, W. H.: On the spontaneous electrical currents observed in wires of the electric telegraph, Royal Society of London, Philo-sophical Transactions, 139, 61, 1849.
Bolduc, L., Langlois, P., Boteler, D., and Pirjola, R.: A Study of Geoelectromagnetic Disturbances in Qu´ebec, 1. General Results, IEEE Trans. Power Delivery, 13, 1251, 1998.
Bolduc, L., Langlois, P., Boteler, D., and Pirjola, R.: A Study of Geoelectromagnetic Disturbances in Qu´ebec, 2. Detailed Analy-sis of a Large Event, IEEE Trans. Power Delivery, 15, 272, 2000. Boteler, D.: Space Weather Effects on Power Systems, Space
Weather, AGU Geophysical Monograph 125, 347, 2001. Boteler, D. H., Pirjola, R. J., and Nevanlinna, H.: The Effects of
Geomagnetic Disturbances on Electrical Systems at the Earth’s Surface, Adv. Space Res., 22, 17, 1998.
Chisham, G. and Orr, D.: A statistical study of the local time asym-metry of Pc5 ULF wave characteristics observed at midlatitudes by SAMNET, J. Geophys. Res., 102, 24 339, 1997.
Favetto, A. and Osella, A.: Numerical Simulation of Currents In-duced by Geomagnetic Storms on Buried Pipelines: An applica-tion to the Tierra del Fuego, Argentina, Gas Transmission Route, IEEE T. Geosci. Remote, 37, 614, 1999.
Huttunen, K. E. J., Koskinen, H. E. J, Pulkkinen, T. I., Pulkki-nen, A., and Palmroth, M.: April 2000 storm: Solar wind driver and magnetospheric response, J. Geophys. Res., 107, doi: 10.1029/2002JA0099154, 2002.
Kappenman, J. G. and Albertson, V. D.: Bracing for the Geomag-netic Storms, IEEE Spectrum, 27, 1990.
Kappenman, J. G., Radasky, W. A., Gilbert, J. L., and Erinmez, I. A.: Advanced geomagnetic storm forecasting: a risk manage-ment tool for electric power system operations, IEEE T. Plasma Sci., 28, 2114, 2000.
Klimas, A. J., Valvidia, J. A., Vassiliadis, D., Baker, D. N., Hesse, M., and Takalo, J.: Self-organized criticality in the substorm phe-nomenon and its relation to localized reconnection in the magne-tospheric plasma sheet, J. Geophys. Res., 105, 18 765, 2000. Lahtinen, M. and Elovaara, J.: GIC Occurrences and GIC Test for
400 kV System Transformer, IEEE Trans. Power Delivery, 17, 555, 2002.
Langlois, P., Bolduc, L., and Chouteau, M. C.: Probability of Oc-currence of Geomagnetic Storms Based on a Study of the Dis-tribution of the Electric field Amplitudes Measured in Abitibi, Qu´ebec, in 1993–94, J. Geomagn. Geoelectr., 48, 1033, 1996. Lanzerotti, L., Thomson, D., and Maclennan, C.: Engineering
Is-sues in Space Weather, Modern Radio Science 1999, Published
for the International Union of Radio Science by Oxford Univer-sity Press, 1999.
Lehtinen, M. and Pirjola, R.: Currents produced in earthed conduc-tor networks by geomagnetically-induced electric fields, Ann. Geophysicae, 3, 4, 479, 1985.
Martin, B. A.: Telluric Effects on a Buried Pipeline, Corrosion, 49, 343, 1993.
M¨akinen, T.: Geomagnetically Induced Currents in the Finnish Power System, Geophysical Publications, No. 32, Finnish Me-teorological Institute, p. 101, 1993.
Pulkkinen, A., Viljanen, A., Pirjola, R., and BEAR Working Group: Large Geomagnetically Induced Currents in the Finnish High-Voltage Power System, Finnish Meteorological Institute, Re-ports, 2000:2, p. 99, 2000.
Pulkkinen, A., Viljanen, A., Pajunp¨a¨a, K., and Pirjola, R.: Record-ings and occurrence of geomagnetically induced currents in the Finnish natural gas pipeline network, J. Appl. Geophys., 48, 219, 2001a.
Pulkkinen, A., Pirjola, R., Boteler, D., Viljanen, A., and Yegorov, I.: Modelling of space weather effects on pipelines, J. Appl. Geo-phys., 48, 233, 2001b.
Pulkkinen, A., Amm, O., Viljanen, A., and BEAR Working Group: Ionospheric equivalent current distributions determined with the method of elementary current systems, J. Geophys. Res., in press, 2002.
Rostoker, G., Phenomenology and physics of magnetospheric sub-storms, J. Geophys. Res., 101, 12 955, 1996.
Tanskanen, E. I., Viljanen, A., Pulkkinen, T. I., Pirjola, R., H¨akkinen, L., Pulkkinen, A., and Amm, O.: At substorm on-set, 40% of AL comes from underground, J. Geophys. Res., 106, 13 119, 2001.
Trichtchenko, L. and Boteler, D. H.: Specification of geomagneti-cally induced electric fields and currents in pipelines J. Geophys. Res., 106 , 21 039, 2001.
Tsurutani, B. T. and Gonzalez, W. D.: The interplanetary causes of magnetic storms: A review, Magnetic Storms, AGU Geophysical Monograph 98, 77, 1997.
Untiedt, J. and Baumjohann, W.: Studies of polar current systems using the IMS Scandinavian magnetometer array, Space Sci. Rev., 63, 245, 1993.
Vennerstrøm, S.: Dayside magnetic ULF power at high latitudes: A possible long-term proxy for the solar wind velocity?, J. Geo-phys. Res., 104, 10 145, 1999.
Viljanen, A.: Relation of Geomagnetically Induced Currents and Local Geomagnetic Variations, IEEE Trans. Power Delivery., 4, 1285, 1998.
Viljanen, A. and Pirjola, R.: Geomagnetically induced currents in the Finnish high-voltage power system, Surv. Geophys., 15, 383, 1994.
Viljanen, A., Amm, O., and Pirjola, R.: Modeling geomagnetically induced currents during different ionospheric situations, J. Geo-phys. Res., 104, 28 059, 1999.
Viljanen, A., Nevanlinna, H., Pajunp¨a¨a, K., and Pulkkinen, A.: Time derivative of the horizontal geomagnetic field as an activity indicator, Ann. Geophysicae, 19, 1107, 2001.