A Dynamic and Robust Random Multiple-Access Scheme for
Communication over Satellite Channels with Interference
John T. Metzger
B.S. Electrical Engineering United States Air Force Academy (2014)Submitted to the Department of Electrical Engineering and Computer Science in partial fulfillment of the requirements for the degree of
Master of Science in
Electrical Engineering and Computer Science at the
MASSACHUSETTS INSTITUTE OF TECHNOLOGY
June 2016
John T. Metzger 2016. All rights reserved.
The author hereby grants to MIT and Draper Laboratory permission to reproduce and to distribute publicly paper and electronic copies of this thesis document in whole or in part in any medium now known or hereafter created.
Author ... .
S ig n a tu re re d a c te d
Department of Electrical Engineering and Computer Science May 20, 2016 Certified by ... Certified by ...Signature redacted
...
...-
---Vincent W. S. Chan Joan and Irwin Jacobs Professor of Electrical Engineering and Computer Science Thesis Supervisor
Signature redacted
...
...
Christopher C. Yu Division Leader - Signals, Sensors, and Navigation - Charles Stark Draper Laboratory Thesis Supervisor Accepted by ... MASSACHUSETTS INSTITUTE OF TECHNOLOGY
JUL 12
201
LIBRARIES
Signature redacted
)
(
syie A. Kolodziejski Chair, Department Committee on Graduate StudentsMRCHNES
The views expressed in this article are those of the author and do not reflect the official policy or position of the United States Air Force, Department of Defense, or the U.S. Government.
A Dynamic and Robust Random Multiple-Access Scheme for
Communication over Satellite Channels with Interference
by
John T. Metzger
Submitted to the Department of Electrical Engineering and Computer Science on May 20, 2016 in partial fulfillment of the requirements for the degree of Master of Science in
Electrical Engineering and Computer Science
Abstract
SATCOM is a critical capability that is increasingly in demand among civilian and military users. The past several years have seen a dramatic increase in electronic warfare capabilities available to potential adversaries that will pose a significant threat to SATCOM systems. Additionally, the circuit-oriented architecture of current SATCOM systems is ill-suited to support future traffic demands and a random multiple-access mode that can dynamically adapt to user traffic, as well as the number of users, will be required for future systems. Given that military operations often take place in contested environments, future systems must also be able to operate in the presence of complex and powerful interference platforms.
This thesis proposes a combined system using the slotted ALOHA protocol as its random multiple-access scheme along with direct sequence spread spectrum coding to provide channel robustness and low probability of detection. We estimate the transmission power achievable by a transportable interferer using commercially available technologies and develop limits on the maximum channel capacity achievable for different numbers of channels operating in the same frequency band. We show that the combined system can support a large number of channels operating at low data rates when the interferer is present, and higher data rates under benign circumstances.
We also investigate the stability of the slotted ALOHA control algorithm under dynamically varying traffic loads and show that the system remains uncongested as long as the average traffic load is kept below the maximum throughput of the channel. The system is shown to be able to return to an uncongested state after periods of time where the traffic load exceeds the maximum throughput of the channel. Two methods for implementing dual-class service are developed and their effects on throughput and latency are discussed.
Finally, we anticipate attack strategies an interferer may use to target the physical and media access control layers of the system and develop techniques for mitigating these attacks. A technique known as code switching is developed and shown to significantly improve the system's robustness to attacks targeting both the physical and media access control layers.
Thesis Supervisor: Vincent W. S. Chan
Title: Joan and Irwin Jacobs Professor of Electrical Engineering and Computer Science
Thesis Supervisor: Christopher C. Yu
Title: Division Leader - Signals, Sensors, and Navigation - Charles Stark Draper Laboratory
Acknowledgments
I must first offer a word of praise to God, whose guiding hand has been unmistakable during my time here
at MIT. I am extremely grateful for the grace and mercy he has shown me in my work as well as the
wonderful friends and community he has blessed me with here in Cambridge.
Next, I would like to thank my advisors Professor Vincent Chan and Dr. Christopher Yu for their support
and guidance during my time at MIT. I was truly fortunate to have such patient and wise mentors. It was
my sincere pleasure to work for both of you. I am also grateful for the financial support of the U.S. Air
Force and the Charles Stark Draper Laboratory that made this opportunity possible.
I owe my gratitude to Litian Liu for her work on simulating an ALOHA system that serves as the foundation
for much of my work in Chapter 3.
I am very fortunate to have had such wonderful lab mates. Antonia, thank you for being such a great office
mate. I appreciate your willingness to listen to my concerns about classes and research. Anny, thank you
for carrying me through 6.450! I am going to miss our Sunday night homework sessions. Matt and Henna,
thank you for welcoming me to the group. I believe the openness and camaraderie of our group is due in
large part to your leadership. Arman, thank you for being a great TA and a good friend. I am going to miss
teaming up with you to annoy Shane. Manishika, I'm so glad there was someone else in the lab who shares
a mutual love for rock climbing and T-Swift! It was a pleasure to be your designated study break. Esther,
thank you for your willingness to be open and genuine with me. I highly value our conversations on school,
relationships, faith, and life in general. Andrew, I enjoyed being part of the group's 6.262 crew with you.
I wish you the best in your future studies. Finally, to the most delightfully sarcastic man I have ever known,
Shane, thank you for being a great friend, mentor, and office mate. I am extremely impressed by your
work ethic and I hope to imitate it as best I can. Thank you for taking me under your wing and for the
many lessons on how to be a good officer.
I would also like to thank my mentor Paul Carter. Paul, thank you for all the wisdom you've shared with
me over the past two years. You helped me find purpose in my work and showed me how to freely receive
God's gift of grace. I will miss our noontime conversations.
Finally, to the members of Tang Small Group, thank you for being such a loving and supportive community.
You came alongside me during a very difficult first semester and have become some of my closest friends.
May God continue to bless and grow your fellowship.
Contents
Acknow ledgm ents ... 7
Ta ble of Figures ... 13
Acronym s ... 19
Notation ... 21
Chapter 1 Introduction ... 27
1.1 Future SATCOM Requirements and Current Systems ... 28
1.2 A Potential Solution for Future Systems ... 29
1.3 Thesis Scope and Organization... 30
Chapter 2 System Description and Threat Estim ate ... 33
2.1 System Description ... 33
2.1.1 Physical Layer Description...34
2.1.2 M AC Layer Description ... 37
2.1.3 System Capacity under Benign Circumstances ... 39
2.1.4 System LPI Characteristics... 43
2.1.4.1 Com parison of Spreading Techniques... 44
2.1.4.2 Vulnerability of Frequency Hopping to Detection ... 46
2.2 Threat Estim ate ... 48
2.2.1 Estim ate of Interferer Strength ... 49
2.2.2 System Capacity with Broadband Interferer ... 51
2.3 Sum m ary... ...55
Chapter 3 Control Algorithm and Dual-Class Service...57
3.1 The Rivest Control Algorithm ... 57
3.1.1 Perform ance M etrics...59
3.1.2 System Response to Delayed Feedback ... 62
3.1.3 Control Algorithm Stability... 69
3.2 Control Algorithm Perform ance ... 70
3.2.1 Heavy Traffic Sim ulations ... 79
3.2.2 Tim e to Clear Heavy Traffic Bursts ... 92
3.3 Im plem entation of Dual-Class Service... 96
3.3.1 Estim ating Arrival Rates ... 97
3.3.2 Throughput Scaling with Random Drops...105
3.3.3 Sim ulations with Priority Users ... 109
3.3.4 Strict Tim e Deadline Service...125
3.4 Sum m ary...129
Chapter 4 Physical Layer Defenses...131
4.1 Downlink Power Robbing ... 131
4.1.1 Perform ance Com parison of Signal Processing Schem es ... 132
4.1.2 Lim iting Effect of Power Robbing on Interference M itigation ... 137
4.2 Concentrated Interference Attacks...139
4.2.1 Uncoded Channel w ith Pulsed Interference ... 140
4.2.2 Coded Channel with Pulsed Interference...143
4.2.3 Channel-Selective Interference ... 145
4.2.4 Channel-Selective Interference with Code Switching ... 148
4.3 Summary...150
Chapter 5 MAC Layer Defenses...151
5.1 Modified Rivest Algorithm with Channel-Selective Interference...151
5.1.1 M aximum Achievable Throughput with Interference...152
5.1.2 Derivation of Feedback Parameters for Modified Algorithm...153
5.1.3 Estimating Interferer Transmission Rate...157
5.1.4 Simulated Results ... 160
5.1.4.1 Simulated Throughput...161
5.1.4.2 Simulated Estimation of Backlog...163
5.1.4.3 Simulated Recovery Time from Interferer ... 165
5.2 Performance Improvements from Using Code Switching ... 167
5.3 Defense against a Collision-Spoofing Interferer...172
5 .4 S u m m a ry...17 7 Chapter 6 Conclusion ... 179
Appendix A Derivations for Equations in Chapter 2...181
A.1 Physical Parameter Calculations for Section 2.1.3...181
A.2 Supporting Calculations for Section 2.1.4.2...184
Appendix B Derivations for Equations in Chapter 3 ... 187
B.1 Derivation of Expected Delay for Section 3.1.1...187
B.2 Derivation of Expected Delay for Section 3.1.2...188
B.3 Derivation of Expected Delay for Section 3.3.4...189
Appendix C Derivations for Equations in Chapter 4 ... 193
C.1 SNR Derivations for Section 4.1.1 ... 193
C.2 Derivation of Lim it for Section 4.1.2 ... 196
Appendix D Derivations for Equations in Chapter 5...201
D.1 Derivations of Results for Section 5.1.2...201
D.2 Optim ization for Section 5.1.3 ... 204
D.3 Derivation of Chernoff Bound for Section 5.3 ... 205
Bibliography ... 209
1 Diagram of DS Signal Spreading and Recovery ... 35
2 Slotted ALOHA Departure Rate vs. Attempted Transmission Rate ... 38
3 Maximum Channel Capacity (Bps) vs. Processing Gain for Benign Channel...41
4 Total System Capacity (Bps) vs. Processing Gain for Benign Channel ... 43
5 Comparison of Power Spectral Densities for Gp = 10 ... 45
6 Comparison of Power Spectral Densities for GP = 1000...46
7 Interferer EIRP vs. Freq uency ... 51
8 Channel Capacity (Bps) vs. Processing Gain for Channel with Broadband Interference...53
9 Total Capacity (Bps) vs. Processing Gain for Channel with Broadband Interference...53
10 Channel Capacity (Bps) versus Processing Gain with Interference and 20 dB Antenna Nulling ... 54
11 Total Capacity (Bps) versus Processing Gain with Interference and 20 dB Antenna Nulling ... 54
Fig. Fig. Fig. Fig. Fig. Fig. Fig. Fig. Fig. Fig. Fig. Fig. Fig. Fig. Fig. Fig. Fig. Fig. Fig. Actual and Estimated Backlog for the Continuous Transmission Attempt Scheme...65
Actual and Estimated Backlog for the Wait-for-Feed back Scheme...65
Expected Channel Delay for the Continuous Transmission Attempt Scheme...66
Expected Channel Delay for the Wait-for-Feed back Scheme ... 66
Long-Term Averages for Continuous Transmission Attempt Scheme...67
Long-Term Averages for Wait-for-Feedback Scheme...67
Local Averages for Continuous Transmission Attempt Scheme ... 68
Local Averages for W ait-for-Feed back Scheme... 68
Fig. 20 Step Function Poisson Arrival Rate Test Case... 71
Fig. 21 Square Pulse Poisson Arrival Rate Test Case ... 72
13
Table of Figures
12 Simulated 13 Simulated 14 Simulated 15 Simulated 16 Simulated 17 Simulated 18 Simulated 19 SimulatedSinusoid Poisson Arrival Rate Test Case ... 72
Simulated Actual and Estimated Backlog for Step Function Case ... 73
Simulated Expected Delay for Step Function Case ... 73
Simulated Local Averages for Step Function Case ... 74
Fig. Fig. Fig. Fig. Fig. Fig. Fig. Fig. Fig. Fig. Fig. Fig. Fig. Long-Term Averages for Step Function Case... 74
Actual and Estimated Backlog for Square Pulse Case... 75
Expected Delay for Square Pulse Case... 75
Local Averages for Square Pulse Case ... 76
Long-Term Averages for Square Pulse Case ... 76
Actual and Estimated Backlog for Sinusoid Case ... 77
Expected Delay for Sinusoid Case... 77
Local Averages for Sinusoid Case... 78
Long-Term Averages for Sinusoid Case ... 78
Fig. 35 Heavy Traffic Load with a Step Function Poisson Arrival Rate Test Case ... 81
Fig. 36 Heavy Traffic Load with a Square Pulse Poisson Arrival Rate Test Case...81
Fig. 37 Heavy Traffic Load with a Double Pulse Poisson Arrival Rate Test Case ... 82
Fig. 38 Heavy Traffic Load with a Sinusoid Poisson Arrival Rate Test Case...82
Fig. 39 Simulated Actual and Estimated Backlog for Step Function Case ... 83
Fig. 40 Simulated Expected Delay for Step Function Case ... 83
Fig. 41 Sim ulated Local Averages for Step Function Case ... 84
Fig. 42 Simulated Long-Term Averages for Step Function Case...84
Fig. 43 Simulated Actual and Estimated Backlog for Square Pulse Case...85
Fig. 44 Sim ulated Expected Delay for Square Pulse Case... 85
Fig. 45 Sim ulated Local Averages for Square Pulse Case ... 86
14 22 23 24 25 26 Simulated 27 Simulated 28 Simulated 29 Simulated 30 Simulated 31 Simulated 32 Simulated 33 Simulated 34 Simulated
Fig. 46 Simulated Long-Term Averages for Square Pulse Case ... 86 Fig. 47 Simulated Fig. 48 Simulated Fig. 49 Simulated Fig. 50 Simulated Fig. 51 Simulated Fig. 52 Simulated Fig. 53 Simulated Fig. 54 Simulated Actual and Estimated Backlog for Double Pulse Case ... 88
Expected Delay for Double Pulse Case ... 88
Local Averages for Double Pulse Case ... 89
Long-Term Averages for Double Pulse Case ... 89
Actual and Estimated Backlog for Sinusoid Case... 90
Expected Delay for Sinusoid Case... 90
Local Averages for Sinusoid Case... 91
Long-Term Averages for Sinusoid Case ... 91
Fig. 55 Visualization of System Clear Tim e ... 93
Fig. 56 Exam ple Poisson Arrival Rate for Clear Time Analysis... 95
Fig. 57 Simulated and Estimated System Clear Time versus Pulse Width for Square Pulse Arrival Rate ... 95
Fig. 58 Simulated Arrival Rate Estimation for kw = 1 ...---... 99
Fig. 59 Sim ulated Arrival Rate Estim ation for kw = 2 ... 99
Fig. 60 Simulated Actual and Estimated for the Constant Value Update Method ... 101
Fig. 61 Simulated Actual and Estimated Backlog for the Updated Method from (3.10) with kw = 2 ... 101
Fig. 62 Simulated Arrival Rate Estimation for Updated Method from (3.10) with kw = 2 ... 102
Fig. 63 Simulated Arrival Rate Estimation for a Synchronized Change in User Traffic (kw = 2)...103
Fig. 64 Simulated Arrival Rate Estimation for a Change in Normal User Traffic (kw = 2)...104
Fig. 65 Simulated Arrival Rate Estimation for a Change in Priority User Traffic (kw = 2)...104
Fig. 66 Simulated Arrival Rate Estimation for an Unsynchronized Change in User Traffic (kw = 2)...105
Fig. 67 Initial Poisson Arrival Rates for Synchronized Traffic Increase...111
Fig. 68 Simulated Estimated and Scaled Poisson Arrival Rates for Synchronized Traffic Increase...111
Fig. 69 Simulated Actual and Estimated Backlog for Synchronized Traffic Increase...112
Fig. 70 Simulated Expected Delay for Synchronized Traffic Increase ... 112
Fig. 71 Simulated Local Averages for Synchronized Traffic Increase ... 113
Fig. 72 Simulated Long-Term Averages for Synchronized Traffic Increase ... 113
Fig. 73 Initial Poisson Arrival Rates for Normal User Traffic Increase ... 114
Fig. 74 Simulated Estimated and Scaled Poisson Arrival Rates for Normal User Traffic Increase ... 114
Fig. 75 Simulated Actual and Estimated Backlog for Normal User Traffic Increase...115
Fig. 76 Simulated Expected Delay for Normal User Traffic Increase...115
Fig. 77 Simulated Local Averages for Normal User Traffic Increase ... 116
Fig. 78 Simulated Long-Term Averages for Normal User Traffic Increase ... 116
Fig. 79 Initial Poisson Arrival Rates for Priority User Traffic Increase ... 118
Fig. 80 Simulated Estimated and Scaled Poisson Arrival Rates for Priority User Traffic Increase ... 118
Fig. 81 Simulated Actual and Estimated Backlog for Priority User Traffic Increase...119
Fig. 82 Simulated Expected Delay for Priority User Traffic Increase...119
Fig. 83 Simulated Local Averages for Priority User Traffic Increase...120
Fig. 84 Simulated Long-Term Averages for Priority User Traffic Increase ... 120
Fig. 85 Initial Poisson Arrival Rates for Unsynchronized Traffic Increase ... 121
Fig. 86 Simulated Estimated and Scaled Poisson Arrival Rates for Unsynchronized Traffic Increase...121
Fig. 87 Simulated Actual and Estimated Backlog for Unsynchronized Traffic Increase ... 122
Fig. 88 Simulated Expected Delay for Unsynchronized Traffic Increase ... 122
Fig. 89 Simulated Local Averages for Unsynchronized Traffic Increase ... 123
Fig. 90 Simulated Long-Term Averages for Unsynchronized Traffic Increase ... 123
Fig. 91 Expected Delay for a Strict Time Deadline User versus Number of Transmissions...126
Fig. 92 Minimum Expected Delay for other Users versus Number of Transmissions by a Strict Time Deadline
U se r ... 1 2 8
Fig. 93 Bit Error Probability Comparison with Nc = 100 for a System Serving as a Relay and a System Using
O nbo ard Signal Processing ... 135
Fig. 94 Bit Error Probability Comparison with Nc = 1000 for a System Serving as a Relay and a System U sing O nboard Signal Processing ... 136
Fig. 95 Required Interferer-to-Signal Ratio versus Spreading Factor for Generic and Power Robbing Cases ... 1 3 8 Fig. 96 Bit Error Probability for Pulsed Interferer on Uncoded Channel...141
Fig. 97 Bit Error Probability Comparison for Constant Power and Optimally Pulsed Interferers...142
Fig. 98 Bit Error Probability for Pulsed Interferer on a Channel with m = 9 Repeat Coding...144
Fig. 99 Bit Error Probability Comparison for Optimal Channel-Selective and Broadband Interferers...147
Fig. 100 Bit Error Probability for Channel-Selective Interferer with Code Switching...150
Fig. 101 Normalized Expected Interferer Rate Estimation Error versus Number of Slots Observed...159
Fig. 102 Simulated Throughput Comparison for A = 1 - ae-1 ... 161
Fig. 103 Sim ulated Throughput Com parison for A = e -1...162
Fig. 104 Estimation of Packets in System by Original Rivest Algorithm ... 164
Fig. 105 Estimation of Packets in System by Modified Rivest Algorithm...164
Fig. 106 Extended Estimation of Packets in System by Original Rivest Algorithm...166
Fig. 107 Extended Estimation of Packets in System by Modified Rivest Algorithm...167
Fig. 108 Comparison of Effective Interference Rates for System Using a Static DS Code and System Using C o d e Sw itching ... 170
Fig. 109 Maximum Achievable Throughput versus Interferer Rate for Systems Using Code Switching and
Static D S C o d e s ... 17 2
Fig. 110 Probability of Detection versus Probability of False Alarm for Nsy = 100, POD = 0.8, Pf = 0.2
... 1 7 6
Acronyms
ADC analog-to-digital converter
ASAT anti-satellite
Bps bits per second
BPSK binary phase-shift-keying
CDMA code division multiple access
DOD department of defense
DS direct sequence
dB decibels
dBW decibel watts
EHF extremely high frequency
EIRP effective isotropic radiated power
EW electronic warfare
FFT fast Fourier transform
Hz hertz
lID independent identically distributed
LPI low probability of intercept
MAC media access control
PN pseudo-noise
RTT round trip time
SATCOM satellite communications
SHF super high frequency
SNR signal-to-noise ratio
Notation
AE area between arrival rate pulse and residual arrival rate during congested period
ARX area of receiver antenna
C maximum channel capacity
Cq (N) probability of a collision slot given N packets in the system
CSYS total system capacity
d, interferer antenna diameter
dRX receiver antenna diameter
E, EIRP of the interferer
Esat EIRP available for satellite downlink
ETx EIRP of the transmitter
ej interferer antenna efficiency
eRX receiver antenna efficiency
Fp signal path loss
Fsys system loss
f frequency
fc
0 co-channel interference factorfs spreading sequence frequency
G attempted transmission rate
G, gain of interferer antenna
Gn gain over interferer due to antenna nulling
Gp processing gain
GRX gain of receiver antenna
GTX gain of transmitter antenna
Hq (N) probability of a hole slot given N packets in the system
Rc(i) indicator variable for a collision slot
RHG) indicator variable for a hole slot
ffs(i) indicator variable for a success slot
k Boltzmann constant
kw window scaling constant
L signal path distance
Lp packet length in bits
m number of repeated symbols per bit
N number of packets ready for transmission in an ALOHA slot
NA number of ALOHA slots required for a packet to pass its transmission test
NB number of bit periods in a packet using the same DS code for transmission
Nc number of user channels occupying a single frequency band
Ndrop threshold number of backlogged packets to trigger a drop of normal users
NFFT number of FFT points required
Nflop number of flops required
Nh number of hole slots observed in observation window
N, power spectral density of broadband interferer
Noab number of time slots included in observation window
Np number of packets ready for transmission by priority users
NRep number of repeated transmissions of a strict time deadline packet
NRTT number of ALOHA slots in a single channel round trip time
Ns number of transmission attempts required for success given that a success
occurred
Nsw number of success slots observed in a window
Nsym maximum number of independent collision detection tests that can be performed on symbol periods
NT total power spectral density of broadband interferer and ambient channel noise
NTs number of transmitted packets in a time slot
NTx number of transmission attempts required for a successful transmission of a single
packet
No power spectral density of ambient channel noise
ns number of shift registers
nstart first slot included in local average at nth ALOHA slot
Pb bit error probability
Pc1ear probability that an ALOHA slot is clear when a strict time deadline user is present
PD probability that the system correctly detects a genuine collision
Pd probability that an individual collision detection test correctly detects a genuine
collision
PDP probability of bit error on downlink for system with onboard signal processing
PDR probability of bit error on relay downlink
PFA probability that the system incorrectly determines a hole slot to be a collision
Pf probability that an individual collision detection test incorrectly determines a hole
slot to be a collision given that an interferer is not present
PfT total probability that an individual collision detection test incorrectly determines a
hole slot to be a collision
P, interferer transmitter power
PN-1 probability that N - 1 of the packets in an ALOHA channel do not transmit on a
given slot
PN-2 probability that N - 2 of the packets in an ALOHA channel do not transmit on a
given slot
PNIC(n) normalized distribution of the number of packets in the system N given that a collision is observed
PNIH(n) PNIs(n) PNaNhna (na) Pproc PRel PTotal PTX Pup P, (n) PNS
(ns)
q qdrop qin qout r, rn ry ru SD(f) SDS(f) SFH (f) Sq(N)normalized distribution of the number of packets in the system N given that a hole
is observed
normalized distribution of the number of packets in the system N given that a
success is observed
probability of observing Na time slots with a transmission from a channel-selective
interferer out of N total slots observed given that the probability that interferer
affects a time slot is a
probability of bit error for system using onboard signal processing probability of bit error for relay system
total power observed by uplink receiver transmitter power
probability of bit error on uplink for system with onboard signal processing
Poisson distribution with mean v of number of packets in the system N
probability mass function of the random variable Ns
probability of transmission for user operating under ALOHA protocol probability that a normal user is dropped from the ALOHA channel absorbed thermal energy per unit time to receiver
emitted thermal energy per unite time from receiver fraction of downlink power devoted to interferer's signal fraction of normal users retained by the channel during a drop fraction of arrivals in window from priority users
fraction of downlink power devoted to signals from legitimate users power spectral density of data signal
power spectral density of DS spread signal
power spectral density of frequency hopped signal
probability of a success slot given N packets in the system
SNR signal-to-noise ratio
SNRDP downlink signal-to-noise ratio for system with onboard signal processing
SNRDR downlink signal-to-noise ratio for relay system
SNRup uplink signal-to-noise ratio for system with onboard signal processing
T temperature in Kelvin
Tb data bit period
Tclear channel clear time in number of ALOHA slots required
Tclear estimated channel clear time in number of ALOHA slots required Tdrop threshold channel delay in seconds to initiate a drop of normal users
Tw time in seconds a packet spends in the ALOHA channel
estimated number of packets ready for transmission in an ALOHA slot
Wd data signal bandwidth
Wss spread signal bandwidth
a fraction of channels transmitted on by channel-selective interferer
a' effective interference rate of channel-selective interferer
a* optimum fraction of channels transmitted on by channel-selective interferer
a estimated rate at which a channel-selective interferer affects the channel
C' estimated effective interference rate of channel-selective interferer
aerr normalized estimation error of rate at which a channel-selective interferer affects
the channel
asat receiver thermal absorptivity
F throughput in successful packets per time slot
L 0 local throughput
FLT long-term throughput
Fmax maximum achievable throughput
E symbol error probability
Esat receiver thermal emissivity
r7 Threshold number of collision detection tests that declare that a collision occurred
for the system to declare that the current slot is a collision
6(r) cross-correlation function
Poisson arrival rate for packet arrivals to ALOHA channel in packets per slot estimated packet arrival rate to ALOHA channel in packets per slot
Ac Ccenter frequency wavelength
An arrival rate of packets from normal users in packets per slot
A estimated arrival rate of packets from normal users in packets per slot
AP arrival rate of packets from priority users in packets per slot
AP estimated arrival rate of packets from priority users in packets per slot
AR residual packet arrival rate in packets per slot ~
As supportable packet arrival rate in packets per slot
AU unsupportable packet arrival rate in packets per slot
p interferer pulse rate
p* optimum interferer pulse rate
USB Stefan-Boltzmann constant
6> P pulse width in number of ALOHA slots
Chapter 1
Introduction
A defining feature of conflicts involving the U.S. military over the past two decades has been its
unchallenged use of space-based assets for command, control, communications, and reconnaissance.
Space systems have provided a tremendous advantage to U.S. forces by enabling capabilities such as
precision airstrikes, satellite imagery, and communication to infrastructureless areas. Due to the
technological inferiority of the U.S. military's recent opponents, space has been taken for granted as an
uncontested domain. The availability of space-based assets is integral to significant portions of U.S.
military strategy and any disruption in these systems would have significant consequences for future
military operations.
The U.S. military's reliance on space-based assets, particularly communication systems, has not gone
unnoticed by its rivals. Anti-satellite (ASAT) capabilities have proliferated around the world in recent years
and electronic warfare (EW) systems in particular have improved dramatically [1]. Additionally, this
increasing availability of commercially available components with significant EW capabilities will enable
new players to operate in the space domain. Unlike ASAT systems, EW systems interfere with the signals
transmitted and received by satellite communication (SATCOM) systems and can therefore attack
SATCOM systems terrestrially without the added cost of being sent into space, and often without
confirmed attribution. For this reason, EW capabilities will likely proliferate much faster than ASAT
technologies and will pose the most significant threat to U.S. SATCOM systems.
Unfortunately, current SATCOM systems are ill-suited to meet the growing threat posed by the
proliferation of EW technologies. A new generation of SATCOM systems is needed which can operate in
an increasingly contested space environment and meet an evolving set of user requirements.
1.1 Future SATCOM Requirements and Current Systems
In order to survive in a contested space environment, future SATCOM systems must be robust in the sense
that they can operate effectively in the presence of strong and deliberate interference. Future systems
must also have a low probability of intercept (LPI) by an adversary in order for them to service users who
need to operate undetected, such as special forces and stealth aircraft. In addition to mitigating the threat
from new EW capabilities, future SATCOM systems must also be able to service a very large number of
user terminals' with traffic that is often bursty in nature. Given that many of these terminals will be on
highly mobile platforms, future SATCOM systems must be able to dynamically adjust to user traffic while
remaining as efficient as possible in allocating channel resources. In light of these challenging user
requirements, a Defense Science Board Task Force has recommended that future SATCOM systems
employ a random multiple-access scheme to allow a large number of users to share a single channel [2].
A final requirement for future SATCOM systems is that they be able to support different levels of service
[3]. Future systems must be able to provide minimal delay for priority communications while achieving as
high a throughput as possible for remaining traffic.
While current SATCOM systems satisfy the requirement for a robust channel through their use of
frequency hopping, they cannot provide sufficient LPI, nor can they support the desired number of user
terminals. Frequency hopping in high frequency bands has typically been regarded as a good LPI scheme, but advances in signal processing, particularly in analog-to-digital converters and fast processors, are
1 Most likely on the order of 100,000 terminals.
rendering this strategy obsolete. Additionally, the quasi-static nature of the circuit-oriented architecture
employed by current SATCOM systems does not scale well and is unsuitable for servicing a large number
of users with bursty traffic. For these reasons, new SATCOM systems are needed that are dynamic and
robust, provide sufficiently low LPI, have an adaptive anti-interference capability, incorporate a random
multiple-access scheme, and support different levels of service.
1.2 A Potential Solution for Future Systems
While updates at all levels of SATCOM systems are necessary to meet the requirements for future systems,
changes to subsystems in the physical and media access control (MAC) layers will play the largest role in
satisfying these requirements. Using the spread spectrum technique known as direct sequence (DS)
spreading is a promising physical layer solution to provide robustness and an increased degree of LPI to a
satellite channel. Additionally, as a form of code division multiple access (CDMA), DS spreading naturally
lends itself to supporting multiple channels in a single frequency band. A potential solution at the MAC
layer is the use of a multiple random-access ALOHA protocol to provide a dynamic system response to
user traffic. An added benefit of the ALOHA protocol is that it requires very little coordination between
users and the receiver, which is desirable for highly mobile systems that commonly experience brief
channel outages.
The work in this thesis explores the merits of a combined DS/ALOHA scheme as a potential physical and
MAC layer solution to the requirements for future SATCOM systems. The performance of a DS/ALOHA channel as part of a SATCOM system is simulated under various conditions to determine the capacity and
robustness of the system. Additionally, modifications to both the DS spreading technique and the ALOHA
control algorithm are developed in order to mitigate various interference strategies.
1.3 Thesis Scope and Organization
The following is a brief description of the scope and organization of this thesis, by chapter:
Chapter 2 outlines the proposed system description and reviews the direct sequence spread spectrum
technique as well as the ALOHA MAC protocol. System parameters are recommended for the system such
as antenna beam width, transmission power, and processing gain. Next, the maximum power available to
a transportable interferer is developed and used to estimate the system's maximum achievable capacity
under benign and hostile conditions. Finally, the vulnerability of frequency hopping to hostile detection is
analyzed and its LPI characteristics are compared with direct sequence spreading.
Chapter 3 briefly reviews the Rivest Algorithm [4] as a method for controlling an ALOHA channel and
examines the algorithm's stability. Performance metrics including the number of backlogged packets in
the system and the expected system delay are developed and applied to simulations of an ALOHA channel
controlled by the Rivest Algorithm under various traffic loads. These simulations include the delayed
feedback present in a real satellite channel. A method for providing two different classes of service is also
developed and simulated in this chapter.
Chapter 4 examines physical layer strategies for defending against deliberate interference. Onboard signal
processing is analyzed as a means to prevent power robbing by an interferer. Direct sequence spreading
combined with repeat coding is also evaluated as a means to mitigate pulsed and channel-selective
interferers. Additionally, the concept of code switching is also developed in this chapter and its ease of
implementation is briefly discussed.
Chapter 5 explores strategies for defending against attacks on the MAC layer. The impact of a stationary
interferer on the throughput and stability achieved by the Rivest Algorithm is explored, and a modified
Rivest Algorithm with user authentication is developed to mitigate this attack. Code switching is
demonstrated to provide superior protection against the stationary interferer and also prevents the
interferer from spoofing collisions on hole slots.
Chapter 6 summarizes the main results of the thesis and suggests additional work to further improve
future SATCOM systems. Other areas for improvement in SATCOM systems are also identified.
Chapter 2
System Description and Threat Estimate
This chapter outlines the physical and MAC layers of the DS/ALOHA system, briefly reviews DS spectrum
spreading as a technique to provide robustness, and presents the ALOHA protocol as a method for
providing random multiple-access to a large number of users2
. The channel and total system capacities of
the DS/ALOHA system are shown to support a large number of high data rate channels under benign
circumstances. Additionally, the LPI characteristics of DS spectrum spreading and frequency hopping are
compared and frequency hopping is shown to be vulnerable to detection due to advances in
analog-to-digital converter (ADC) technology. Next, the capabilities of a transportable interference platform are
estimated and are shown to pose a significant threat to future SATCOM systems. Finally, the effect of a
transportable interferer on the DS/ALOHA system is analyzed and is shown to justify the need for antenna
nulling at the satellite's receiver.
2.1 System Description
The DS/ALOHA system proposed in this thesis is composed of a channel utilizing DS spreading and an
ALOHA protocol controlled by the Rivest Algorithm that manages user transmissions. Under this scheme,
each channel uses its own DS code and maintains its own control parameter for the ALOHA protocol. In
order to increase robustness3 channels can routinely change which DS code they are using in a manner
2 The outstanding question of the effect of the feedback delay on this system will be addressed in Chapter 3.
3 See Chapter 4's discussion of code switching.
that appears random to an outside observer. Thus, for the purposes of this thesis, a channel in the
DS/ALOHA system is considered to be a specific pattern of DS codes used by a single group of users
governed by its own ALOHA protocol. It is important to make the distinction between the channel
described here and the frequency band it occupies. Multiple DS codes can be used over the same
frequency band simultaneously, and therefore a single frequency band will have multiple channels. This
concept is somewhat counterintuitive since a channel is often synonymous with the frequency band it
occupies. A more thorough description of the physical and MAC layers of the system is given in the
following two sections.
2.1.1 Physical Layer Description
The primary feature of the physical layer is the spread spectrum scheme it uses. The purpose of a spread
spectrum system is to spread a signal over a larger bandwidth than is necessary for that signal's
transmission [5]. The spreading of a signal in DS spreading is accomplished by multiplying the data
sequence4 by a pseudo-noise (PN) sequence whose elements have values of +1 and are changing at a
faster rate than the data sequence [6]. The resulting signal will use the same underlying modulation
scheme, but will appear to have a data rate equal to the rate of the PN sequence and will therefore occupy
a larger bandwidth [6]. The data sequence is recovered at the receiver by correlating the received signal
and multiplying the resulting sequence by the same PN sequence used at the transmitter [6]. Fig. 1
contains a conceptual diagram of the spreading and recovery process for a DS signal.
4 It is assumed here that the data sequence only takes on values +1.
Data Sequence 1
-1
PNSequence Multiplied by:
1L
-1 TXIRX Sequence -1 PNSequence Mlile y Recovered Sequence 1 -1Fig. 1 Diagram of DS Signal Spreading and Recovery
An important parameter when discussing the DS spread spectrum technique is the processing gain Gp,
which is defined as the ratio between the bit period of the data sequence and the symbol period of the
PN sequence. The processing gain is effectively a measure of how much signal spreading occurs beyond
the bandwidth required to transmit the underlying signal. Noting that bit period is the inverse of signal
bandwidth, it is shown in [5] that the processing gain can also be expressed as:
G ,S (2.1)
W
35
where W, is the bandwidth of the spread signal and Wd is the bandwidth to the data signal before spreading. It is also shown in [5] that the processing gain is proportional to the power advantage of a DS signal over a broadband interferer, regardless of how it distributes its power. Thus, as long as an interferer
does not know the particular DS PN code being used, it must transmit Gp times more power to the receiver
than the DS signal to be received with equal power. It is this power advantage that is the primary source
of robustness for the DS/ALOHA system.
In order to preserve the power advantage afforded to the DS signal by the processing gain, it is necessary
to develop PN codes with long periods that are difficult to reconstruct from a short segment of intercepted
code [5]. It is also necessary to routinely change the DS code used by a signal since consecutive
transmissions using the same code will greatly increase the likelihood of an adversary acquiring the DS
code being used. An adversary that obtains the channel's DS code can eliminate the processing gain of
the signal by transmitting an interfering signal spread using the same DS code as the channel. For these
reasons, the DS/ALOHA system will switch the DS code it is using to transmit after every 10 data bit
periods5. This technique will be referred to as code switching. An advantage of using code switching is
that the transmitter can routinely vary its transmission parameters to avoid detection by an adversary
without requiring resynchronization by the receiver since changing channel's the DS code does not affect
the phase or timing of the transmitted signal.
In addition to using the DS code switching scheme outlined previously, several system parameters are
assumed for the physical layer. The DS/ALOHA system is assumed to operate over a bandwidth of 1 GHz
centered at 44.5 GHz in the 43.5 to 45.5 GHz DOD EHF satellite uplink frequency band [7]. Additionally, the receiver is assumed to be mounted on a satellite operating in a geosynchronous orbit at an altitude
s The choice of 10 data bit periods is motivated by the results in Chapter 5.
of 35,786 kilometers with an antenna diameter of 3 meters. In order to withstand strong interference, it
is assumed that all user terminals are designed to have 10 watts available for transmission and use an
aperture antenna with a beam width of 10 degrees.
2.1.2 MAC Layer Description
The MAC layer of the proposed system uses an ALOHA multiple random-access protocol with a back-off
scheme controlled by the Rivest Algorithm'. A slotted ALOHA protocol is used which divides the channel
into time slots for user transmissions7. Each user that has a packet to send during the current time slot
will transmit it with a probability q specified by the control algorithm at the satellite receiver that is
broadcast to the users. Under the slotted ALOHA protocol, each time slot will contain a hole, a success, or
a collision. A hole occurs when no users transmit during a time slot. A success occurs when only one user
transmits during a time slot, resulting in a single packet being successfully received. A collision occurs
when two or more users transmit during a time slot, resulting in interfering packet transmissions, none of
which are received successfully. Therefore, the only time a successful transmission occurs is during a
success slot. Packets that collide become backlogged and will attempt to retransmit with probability q on
subsequent slots.
The slotted ALOHA model assumes that the arrivals of users to the system form a Poisson process with
rate A and that each arrival and each packet originates from a different user [8]. Using the approximation
[8] that the total number of transmissions from both new arrivals and backlogged packets is a Poisson random variable with parameter G > A, the departure rate of the ALOHA system is equal to the
6 See Chapter 3 for an explanation of the Rivest Algorithm.
' The timing is acquired through the same algorithms used for processing satellites.
probability that a success occurs on a time slot, which is Ge-G [8]. Note that the parameter G models the
total attempted transmission rate of the system. A plot of departure rate versus G is shown in Fig. 2.
-G --- - --Ge-G I-Arrival Rate, A E I bria Equilibria G G
Total Attempted Transmission Rate, G
Fig. 2 Slotted ALOHA Departure Rate vs. Attempted Transmission Rate
We see from Fig. 2 we see that the maximum departure rate achievable by the slotted ALOHA system is
e- 1, which occurs at G = 1. Since the departure rate of packets from the system is equivalent to its
throughput, the slotted ALOHA protocol has a maximum throughput of e- 1 ~ 0.3678. While e- 1 is a
relatively low maximum throughput, it must be kept in mind that the primary advantage of an ALOHA
system is the low coordination that is required between users and the receiver. We also see from Fig. 2
that there are two equilibria for arrival rates smaller than e- 1 that occur at GE, and
GE2.At these points, the system's departure rate is equal to its arrival rate, and the backlog is expected to be small. However,
for values of G greater than GE2, the system departure rate is less than its arrival rate and runaway
instability occurs as the system backlog grows to infinity [8]. For this reason, it is important to implement
38
a control scheme to ensure that the system remains stable and is biased as close to the maximum
departure rate of e- 1 as possible. The DS/ALOHA system discussed in this thesis uses the Rivest Algorithm
to stabilize its slotted ALOHA protocol.
2.1.3 System Capacity under Benign Circumstances
An important performance metric of the DS/ALOHA system is its capacity since the system must be able
to support a large number of channels at sufficiently high data rates in order to be viable as a future
SATCOM system. It is assumed here that the uplink to the SATCOM system will be the limiting factor on
system capacity. An upper bound on the channel capacity of the uplink can be easily developed using the
Shannon limit which has the following form [9]:
C = W 1og2(1+ SNR) , (2.2)
where C is the maximum channel capacity in bits per second (Bps), Wd is the data signal bandwidth in
Hertz (Hz), and SNR is the signal-to-noise ratio. Under benign circumstances, the signal-to-noise ratio can
be expressed as [9]:
SNR =ETXGRXFp (2.3)
WdNO + (Nc - 1)fcoETxGRXF, '
where ETx is the effective isotropic radiated power (EIRP) of a user, GRX is the gain of the receiver's
antenna, F is the signal path loss, No is the power spectral density in watts per Hz of the ambient channel
noise, Nc is the number of DS channels occupying the same frequency band, and
fco
is the co-channelinterference factor modelling the fraction of power from other DS channels that is present as interference
in the channel of interest. The co-channel interference factor is determined by the construction of the DS
codes being used. It is assumed in this thesis that maximal linear sequences are used for the system's DS
codes. For a family of maximal linear sequences,
fc,
has the following form [10]:fco = , (2.4)
2ns -
1
where 6(T) is the cross-correlation function between the maximal linear sequence of interest and the
other maximal linear sequences being used, 2ns - 1 is the period of the maximal linear sequences, and
ns is the number of shift registers used to generate the sequences. The cross-correlation function is itself
a function of ns and has the following upper bound [10]:
1 (T) I (2(ns+1)/2 + 1 for ns odd (2.5)
2(ns+2)/2 + 1 for ns even ns * mod 4
Since the cross-correlation of two DS spread signals decreases with increasing sequence length until the
sequence begins to repeat, it is assumed that the entire chipping sequence is used for each data bit period.
Under this assumption, the processing gain Gp is equal to the sequence period since the sequence
maximum chipping rate is 2ns - 1. Thus, the processing gain can only take on values that satisfy 2ns - 1,
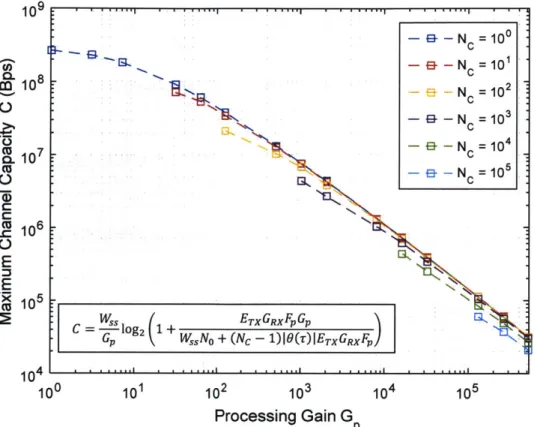
where ns is a positive integer. A plot of maximum channel capacity C under benign circumstances versus
the processing gain of the channel for various numbers of channels Nc is given in Fig. 3. See Appendix A.1
for a derivation of the values of ETx, GRX, F, Wd, and No used in (2.3) to produce the results in Fig. 3.
Note that the number of shift registers ns used to generate the DS codes governs both the maximum
channel capacity and the processing gain in Fig. 3 since GP = 2"s - 1. Also note that there cannot be more
channels than the number of DS codes available, which is 2ns + 1 GP. Therefore, the additional
requirement that Nc !5 GP is included in Fig. 3.
-g-N =100 '&L CnC - N = 101 C- 8 10 EL N = 102 0c --- NC = 10 3 u 7 - N = 104 CL105 CU N 1i05 GoW )|()ErGX _ __Nc- CU 6N 106 E C=lo1 ETX GRX FpGp GP ,N + (NC - 1) 10(T) ETx GRX F)
10o4 10 10 iO -i.O II...
100 101 102 103 104 105
Processing Gain G
p
Fig. 3 Maximum Channel Capacity (Bps) vs. Processing Gain for Benign Channel
We see from Fig. 3 that channel capacity monotonically decreases with increasing processing gain because
the capacity gained from a reduction in co-channel interference is less than the capacity lost due to the
reduction in data bandwidth that results from an increase in processing gain. It should be noted that under
benign circumstances, the DS/ALOHA system can support up to 10,000 channels operating at 436 kBps
with a processing gain of 16,383 or 1,000 channels operating at 4.3 MBps with a processing gain of 1023.
This is a significant improvement in the number of available channels over current circuit-based SATCOM
systems. Note that the equation in Fig. 3 is (2.2) with substitutions from (2.3), (2.4), and GP = 2"s - 1.
From Fig. 3 it is evident that there is a tradeoff between the number of channels and the data rate each
channel can support. However, the appropriate number of channels to maximize the total capacity of the
system Csys is not readily apparent because increasing the number of channels may lower individual
channel capacity, but could also increase the total system capacity due to the added channels. Total
system capacity is defined as:
Csys = Nc -C , (2.6)
where Csys is simply the number of channels multiplied by their individual capacities. A plot of total system
capacity Csys versus Gp for various values of Nc is given in Fig. 4 and reveals that Csys is largest when N, = 10s and GP = 131,071. However, when Nc = 103 channels with are used with a processing gain of 1023, Csys is still close to 70 percent of the capacity achieved when Nc = 105 channels are used, and provides a significantly higher individual channel capacity (4.3 MBps versus 60 kBps). Therefore, depending on user
requirements it may be preferable to use a smaller number of channels with higher individual channel
capacity, but lower total system capacity.
It is important to remember that the capacities plotted in Fig. 3 and Fig. 4 are produced using the Shannon
limit and therefore represent a bound on the maximum capacities achievable under benign conditions.
These capacities also do not take into account efficiency losses from higher network layers (above the
physical layer). For example, using ALOHA as a MAC layer protocol would reduce these capacities by a
factor of e- 1.
1010 70 -10 m - = 0> -a -N =100 9 -a-NN
~i-
05 --&-N =10 -% 10 -N=2 W 1 N N (U 3 10 4 10 0 10 102 103 104 105 Processing Gain GFig. 4 Total System Capacity (Bps) vs. Processing Gain for Benign Channel
2.1.4 System LPI Characteristics
In addition to achieving high capacity, it is important that the DS/ALOHA system maintains a low probability of intercept (LPI) by adversaries. Using DS coding achieves LPI by spreading the signal power over a very large bandwidth so that the signal is difficult to differentiate for the ambient noise floor of the channel. Current SATCOM systems do not use signal power spreading to achieve LPI. Instead they use a form of spread spectrum called frequency hopping. Frequency hopping is accomplished by dividing the spread spectrum bandwidth into smaller channels with identical bandwidths to the data signal bandwidth. A user transmits on one or more of the channels at a time and rapidly hops their transmission from channel to channel in a pseudo-random fashion that makes it difficult for an adversary to track their hopping pattern. Frequency hopping itself has some inherent LPI, but SATCOM transmissions in the EHF band have typically been at frequencies that are too high for an adversary to detect due to limits in
to-digital converter (ADC) and processing technology. Unfortunately for current SATCOM systems, ADC
and processor technology has made significant steps forward since these systems were launched and the
EHF band has become much more vulnerable.
2.1.4.1 Comparison of Spreading Techniques
The LPI advantage of DS spectrum spreading over frequency hopping can be easily seen by comparing the
power spectrums of their respective signals. Assume that a DS signal and frequency hopped signal share
the same data bit period Tb. From [5] the power spectrum for the data signal before spreading SD(f) is
then:
SDW Tb(sinfT) (2.7)
where
f
is frequency in Hz. Since frequency hopping only changes which channel the signal uses, thepower spectral density of the frequency hopped signal SFH(f) is the same as SD(f). Assuming the DS
signal uses a spreading sequence with frequency
fs,
the power spectral density of the DS spread signalSDs(f) is then [5]:
SDS(f) =
1
(sin S) (2.8)fss 7rf/Iss
A plot of SFH(f) and SDs(f) versus f for a processing gain of 10 is shown in Fig. 5. Even with a relatively
low processing gain, the difference in power concentrations between the DS and frequency hopped
signals is significant. The more concentrated peak of the frequency hopped signal is easier for an adversary
to detect than the spread peak of the DS signal. In this way, DS spectrum spreading offers an LPI advantage
over frequency hopping at the same data rate. As processing gain increases, the LPI advantage of DS
spreading over frequency hopping also increases because the DS signal power is spread over a larger
bandwidth. A plot of SFH(f) and SDS(f) versusf for a more realistic processing gain of 1000 is shown in
Fig. 6. It is apparent from Fig. 6 that the difference in power concentrations between the DS and frequency hopped signals is significant and that relative to the frequency hopped signal, the DS signal is virtually indistinguishable from the noise floor.
0.9 I-H~f - S (f) 0.8 07 N0.6 056 0.4 0.3 0.2 0 1 [-* 0 0 f 0 fc Frequency (Hz)
Fig. 5 Comparison of Power Spectral Densities for G= 10
S ( ) 101 10 10'
-fc
0
f
Frequency (Hz)Fig. 6 Comparison of Power Spectral Densities for G = 1000
Since several arbitrary parameter choices (Tb and
f&)
were made to generate Fig. 5 and Fig. 6, noparticular significance should be ascribed to the values of the primary axes of these plots. The purpose of
these figures is to examine the relative difference in power concentrations between frequency hopping
and DS spreading, not the particular values of the concentrations themselves.
2.1.4.2 Vulnerability of Frequency Hopping to Detection
As shown in the previous section, frequency hopped signals have a far more distinctive power distribution
than their DS spread counterparts that makes them easier to detect. Current SATCOM systems
compensate for frequency hopping's poor LPI characteristics by operating in a high enough frequency
band that most ADC's cannot observe the channel. However, recent advances in ADC technology, such as Fujitsu's 56 Giga-sample per second 8-bit ADC, are beginning to render high frequency channels more
vulnerable to observation [11]. As ADC technology progresses, it is reasonable to assume that the EHF