HAL Id: hal-01058765
https://hal.archives-ouvertes.fr/hal-01058765
Submitted on 28 Aug 2014
HAL is a multi-disciplinary open access
archive for the deposit and dissemination of sci-entific research documents, whether they are pub-lished or not. The documents may come from teaching and research institutions in France or abroad, or from public or private research centers.
L’archive ouverte pluridisciplinaire HAL, est destinée au dépôt et à la diffusion de documents scientifiques de niveau recherche, publiés ou non, émanant des établissements d’enseignement et de recherche français ou étrangers, des laboratoires publics ou privés.
L.J. Tiron, J. Le Coz, M. Provansal, N. Panin, G. Raccasi, G. Dramais,
Philippe Dussouillez
To cite this version:
L.J. Tiron, J. Le Coz, M. Provansal, N. Panin, G. Raccasi, et al.. Flow and sediment processes in a cutoff meander of the Danube Delta during episodic flooding. Geomorphology, Elsevier, 2009, 106 (3-4), p. 186 - p. 197. �10.1016/j.geomorph.2008.10.016�. �hal-01058765�
Flow and sediment processes in a cutoff meander of the Danube Delta during episodic flooding
Laura Jugaru Tirona,b,*, Jérôme Le Cozc,1, Mireille Provansalb,2, Nicolae Panina,3, Guillaume Raccasib,4, Guillaume Dramaisc,5, Philippe Dussouillezb,6
aINCD GEOECOMAR, 23-25 Dimitrie Onciul Street, RO-024053, Bucharest, Romania
bUMR 6635, CEREGE-CNRS, Europôle Méditerranéen de l’Arbois, 13545, BP 80, Aix-en-Provence, Cedex
04, France
cCemagref, Hydrology-Hydraulics Research Unit, 3bis quai Chauveau - CP 220, 69336 Lyon, Cedex 9,
France
*Corresponding author. Tel.: +40-21-252-25-94; Fax: +40-21-252-25-94; E-mail: jugarul@geoecomar.ro.
1E-mail: jerome.lecoz@cemagref.fr. 2E-mail: provansal@cerege.fr. 3E-mail: panin@geoecomar.ro. 4E-mail: raccasi@cerege.fr. 5E-mail: guillaume.dramais@cemagref.fr. 6E-mail: dussouillez@cerege.fr.
Abstract
This article analyzes the water and suspended solid fluxes through a straightened meander of the southern branch of the Danube Delta (the St. George branch) during episodic flooding. The Mahmudia study site corresponds to a vast natural meander which was cut off in 1984-1988 by an artificial canal opened to shipping. The meander correction accelerated fluxes through the artificial canal and dramatically enhanced deposition in the former meander. After his formation, the cutoff meander acted as sediment storage locations, essentially removing channel and point bar sediments from the active sediment budget of the main channel. Increases in slope and stream power in reaches upstream and downstream have also occurred, but to a lesser degree. During the one-hundred-year recurrent flood in April 2006, bathymetry, flow velocity and discharge data were acquired across several sections of both natural and artificial channels with an acoustic Doppler current profiler (aDcp Workhorse Sentinel 600 kHz, Teledyne RDI) in order to investigate the distribution of the flow and sediment and his impact on sedimentation in a channelized reach and its adjacent cutoff. The contrasting hydro-sedimentary processes at work in both channels and bifurcation/confluence nodal points are analyzed from the measured flux distribution, morphological profiles and velocity and concentration patterns. In the cutoff, a diminishing of the intensity of the flow velocity (c. 50%) and of the SSC was observed correlated with the aggradation of the river bed. In the bifurcation/confluence nodal points and in the artificial canal were observed the most intensive hydrodynamic activity (high flow velocity, SSC concentration, degradation of the river bad). Both the event-scale and long-term morphological trends of the alluvial system are discussed analyzing the boundary shear stress and SSC variability. Excess boundary shear stress in the sub-reaches directly affected by cutoffs resulted in scour that increased downstream bed material load. These high sediment loads play a key role in driving morphological adjustments towards equilibrium in the cutoff channel.
The approach followed in this paper combines detailed episodic in-situ aDcp measurements and robust numerical 1D modeling in order to provide a practical comprehension of the relevant
morphodynamical processes. The 1D model reproduces robustly the continuity of hydrodynamical variables along the streamwise axes of the two-channel network. The simulated are used in the paper for highlighting reach-scale morphological processes, at both event and long-term scales.
Keywords: river morphodynamics; sediment fluxes; acoustic Doppler current profiler (aDcp); former meander; Danube Delta; St. George branch
1. Introduction
Large river deltas are complex alluvial systems of outstanding social, ecological, and economical importance. Most of them are deeply influenced by human activity: dam construction (Stanley and Warne (1993), Stanley (1996) (Nile River); Panin et al. (1992) and Jugaru et al. (2006) (Danube River)); Batalla et al. (2004) (Ebro River); meander cutoff (Biedenharn et al. (2000), Kesel (2003), Harmar et al. (2005) (Mississippi River), Popa (1997) (Danube River), Kiss et al. (2007) (Tisza River)). Generally speaking, channel mobility is found to be reduced effect of the damming, in association with a decrease in sediment inputs (Hooke, 1986; Stanley and Warne, 1993 and Panin, 2003). Moreover, river training operations (such as construction levees and meander cutoff) initiated for navigational and flood defense purposes often lead to dramatic changes in the streamwise profiles (Lane, 1947; Keller, 1972; Hooke, 1986, Kesel, 2003; Kiss et al., 2007). Meander correction affects both the hydraulic and morphodynamical behavior of the modified branches that sedimentation occurs in time, while newly built canals usually experience degradation (Ichim and Radoane, 1986).
Main climatic parameters like mean annual temperature and annual precipitation play only a relatively minor role in determining the processes of erosion and deposition in rivers but the intensity of precipitation and its seasonal distribution are much more important (Vandenberghe, 2003). Extreme events, at a recurrence interval of years or tens of years leave the largest imprints in sediment production.
This paper reports and analyzes new data on the hydrological and sedimentary processes at work during a morphogenic flood in a large modified meander of the St. George branch, the southern branch of the Danube Delta. The 100-year recurrent flood that occurred in 2006 offered an exceptional opportunity for scanning different cross sections of the Mahmudia River system by means of the emerging Doppler profiler (aDcp) technology in order to analyze the impact on sedimentation and dynamic processes in the study area. Such experimental data, coupled with one-dimensional hydrodynamical modeling, contribute to the understanding of morphological consequences of the rectification.
In a first section, the work context is presented in regard to the river system, the Mahmudia meander and the hydrological conditions during the field observation campaign. The next section is dedicated to experimental and numerical methodology, i.e., hydroacoustic measurements, water sampling procedures, and the one-dimensional hydrodynamical model set up for further analysis of the experimental data. Then a third section gathers the results relative to the water and sediment fluxes through the whole system, the streamwise variability of morphological and hydrodynamical parameters, and local hydrosedimentary processes. In the last section, morphodynamical trends and sediment balances are discussed at the local, meander, and delta scales.
2. Regional setting
2.1. Fluvial background and anthropogenic forcing
The Danube is a major river with a drainage basin of 817 000 km2 (Ielenicz et al., 2006), a total
length of 2860 km, and a total mean annual discharge of 6500 m3.s-1. The present suspended sediment discharge in the Black Sea is about 25-30 × 106 t.y-1 (Panin and Jipa, 2002). The Danube is the main contributor of fresh water and sediment into the Black Sea, through the largest deltaic system in Europe. The Danube Delta (5600 km2) consists of three branches. Unlike the northern branch, which is situated along the Ukrainian border and has mostly
remained natural, the other two branches have been fitted for navigation to a large extent through meander correction (Fig. 1A).
Fig. 1. (A) General map of the Danube Delta. (B) Mahmudia former meander with the aDcp profiles position
While the Danube sediment discharge decreased in the last century mainly due to damming (Iron Gates I and Iron Gates II in 1970’s), the water discharge increased (Panin, 2003). Also the 25-30% sediment discharge reduction was not as extreme as in the case of the Nile (98%, Sestini, 1992) or Ebro (95%, Jimenez and Sanchez-Arcilla, 1993). The increase in water discharge can be attributed to climatic changes, and partly after damming to marsh reduction. Major rivers draining the Carpathian and Balkan mountains are dammed, and discharge is therefore insignificant (Giosan et al., 1999). The relatively small reduction in the sediment discharge after damming, was due to increased erosion of the river bottom and islets in the lower course of the river (Mihailescu, 1983), and to meander cut-offs in 1990’s, along the distributaries in delta area (Panin, 2003).
The most southern branch, the St. George branch, starts out from a bifurcation 108 km upstream of the outlet to the Black Sea. It carries 23% of the Danube water discharge and 21% of the Danube sediment discharge (Bondar and Panin, 2000). The width of the distributary varies from 150 to 550 m, and the water depth varies between 3 and 27 m under the local low water mark (Bondar and Panin, 2000). The St. George channel is highly sinuous and still morphologically dynamic, as attested by migrating meanders (Jugaru et al., 2006) and by the fast evolution of its mouth: the progradation of a deltaic lobe and the displacements of the barrier-like Sakhalin Island during the twentieth century (Panin, 2003).
In the last decades, a number of changes in the St. George branch behavior in response to anthropogenic forcing have been observed. Following the building of the Iron Gates I dam and the hydrotechnical regulation works along the Danube tributaries, the suspended sediment discharge decreased by c. 10% at Isaccea station (KM 54, upstream of the delta head). The construction of the Iron Gates II dam, at Ostrovul Mare (KM 846), induced a catastrophic decrease in the suspended sediment discharge: the sediment load measured at Isaccea dropped by an additional 50% (Panin and Jipa, 2002). During the years 1984-1988, six free meanders were modified in order to improve navigation. The total length of the St. George branch was diminished to 32 km from the previous 108 km. The man-made intersecting channels were initially 7-8 m deep and 75-100 m wide (Popa, 1997). Such river training works caused a change in the distribution of the solid as well as the streamflow in the whole delta, enhancing fluxes through the St. George branch into the sea.
2.2. The Mahmudia experimental site
The former Mahmudia free meander is located in the middle part of the St. George branch, between KM 84 and KM 64 (Fig. 1A). This meander results from the river impingement against the Mahmudia hills that deflected the St. George channel into a large meander loop named the Mahmudia-Uzlina meander bend (Panin, 2003). This is the largest and the most complex
meander in the St. George branch. Its wavelength is 5.1 km, the radius of curvature is 3.93 km and the degree of sinuosity is 4.1.
The cutoff of the natural channel by a navigational canal since 1984-1988 (Fig. 1B) caused dramatic changes in the distribution of river flow velocities, discharge, and sediment fluxes (Ichim and Radoane, 1986; Popa, 1997; Panin, 2003). As a consequence, a number of morphological responses occurred during the period 1990-2000 when the former meander experienced aggradation up to 11 m (i.e. 1.8 m.y-1) (Popa, 1997) and decrease in width (an average of -2.7 m.y-1, with a maximum of -7.5 m.y-1 (about 33%) at KM 81).
Sediment infilling is manifested by the issue of the island located at KM 74. The island developed from the left bank and blocked the entrance of the Gârla Filatului canal; another island appeared at KM 65 in 1990 and increased in area twofold during 1990-2000 (Jugaru et al., 2006).
2.3. Hydraulic conditions during the field observations (100-year recurrent flood of 2006)
Along the Lower Danube section, the flooding events occur when the water discharge are over 10000 m3.s-1. A statistical analysis of the data set for 160 years (1840-2000), concerning the mean annual water discharge of the Danube River, show that, at the delta apex, 89 flooding events were recorded, of which one flooding event with the largest ever recorded mean annual water discharge of 16000 m3.s-1 in 1897 (also the largest daily water discharge of 20940 m3.s-1 (Bondar, 2004).
The period during which the measurements were made (28-30 April, 2006) corresponds to a 100-year recurrent flood that started at the beginning of April 2006 during the high spring waters and lasted for a period of several months. During the measurements, the flow rate of the Danube was 16500 m3.s-1 at its entrance into the delta at Ceatal Izmail (Fig. 1A) and 4600 m3.s-1 at the bifurcation of the St. George branch at Ceatal St. George (Fig. 1A). During the three days when measurements took place, the water flow discharge remained almost constant (Fig. 2).
Fig. 2. Danube daily discharges at the bifurcation of the St. George branch (Ceatal St. George gauging station)
3. Materials and methods
3.1. Hydroacoustic measurements (aDcp)
The application of aDcp (acoustic Doppler current profilers) to river discharge measurements has recently gained considerable popularity because of their efficiency and reliability (for a review see, e.g., Yorke and Oberg, 2002). Based on the signal processing of the echoes of ultrasonic pulses, the deployment of an aDcp mounted on a boat yields the river channel bathymetry and the tree-dimensional velocity field from which the total discharge can be computed. The frequency of ultrasonic pulses operated by aDcp directly affects the measuring range (increasing with lower frequency) and the uncertainty associated with flow velocity measurements (also increasing with lower frequency). In this study case, with flow depth up to 20 m, a 600 kHz aDcp was a good practical compromise in order to avoid range limitation while obtaining acceptable flow and SSC uncertainty with accurate enough spatial resolution. The data analyzed in this study were acquired with an aDcp Workhorse Sentinel 600 kHz (Teledyne RDI) mounted on a powered boat. During the field campaign, transverse aDcp profiles were systematically completed at relevant sections of the Mahmudia River system (Fig. 1B): around the upstream bifurcation (sector A), around the downstream confluence (sector E), along the cutoff meander
(sectors B-C-D), and along the straight outlet reach downstream of the confluence (sector F). In addition to the bottom-track reference used for aDcp velocity and path measurements, the data were continuously georeferenced by a vessel-mounted DGPS (ensemble pivot with mobile Trimble monofrequency ProXR). The bin size was set to 50 cm, and the blank distance (i.e., the unmeasured top layer height) was 80 cm.
3.2. Suspended sediment concentrations
For each bin and each beam, the aDcp records the acoustic backscatter intensity as the acoustic energy (in dB) returned from scattering particles. This intensity is an accepted indicator of suspended-load concentration (see, e.g., Reichel and Nachtnebel, 1994; Gartner, 2004; Dinehart and Burau, 2005; Kostaschuk et al., 2005), although it depends on the properties of the water (temperature, absorption), of the acoustic device itself (frequency, measuring mode, hardware), as well as of the suspended particles (granulometry, concentration, mechanical properties). Consequently, calibration methods for converting backscatter intensity into suspended sediment concentration (SSC) require extensive sediment sampling operations (Rotaru et al., 2006). Here, the state-of-the-art, pragmatic SediView methodology (Land and Jones, 2001) was followed: a manual and iterative calibration of hydroacoustic parameters against SSC samples was achieved using the SediView software dedicated to the processing of Teledyne RDI aDcp data. Once calibrated, hydroacoustic measurements potentially offer the convenient, nonintrusive, synoptical surveying of bathymetry, water velocity, and SSC, i.e., all required information to assess suspended sediment fluxes across a river section.
Consequently, stationary aDcp in situ measurements were coupled with water sampling with a 5 L horizontal Niskin-type bottle. In several selected cross sections, coupled aDcp and sample data were acquired in three separate verticals at depths of 3, 6, 9, and 12 m. The sampled SSC (expressed in mg.l-1) was measured in the laboratory by means of a HACH DR/2000 digital spectrophotometer (using the 630 method). Thus samples were used to calibrate aDcp
concentration profiles. The resulting calibration data cloud (Fig. 3) shows that an acceptable agreement between backscatter data and SSC was reached, even if deviations up to 30% appear for two samples. Because of technical restrictions, the number of samples is not high enough to fully understand the reasons for such residuals. However, as errors do not show any clear trend with the sampling depth nor the SSC value, this calibration operation was assumed to be reliable enough for further assessment of the SSC distribution across sections and SSC flux estimates.
Fig. 3. Results of the hydroacoustic calibration of aDcp backscatter data against SSC sampling
3.3. One-dimensional hydrodynamical model (MAGE)
A one-dimensional hydrodynamical model was set up using the MAGE code (Cemagref). MAGE solves the unsteady one-dimensional shallow water equations in looped channel networks, i.e. including diffluences and confluences. Computational cross-sections every 100 m were built from bathymetry profiles extracted from the aDcp transects. Assuming constant water slope, the aDcp bathymetry profiles were vertically shifted to fit the 1.25 m water fall that occurred between sections A1 and F2. This water fall was computed from observed flood levels and topography data extracted from topographical maps of the Danube Delta (scale 1:25 000).
As no data in the floodplain were available, only the main channel flow was simulated. The downstream and upstream boundary conditions are the observed water level and a constant discharge of 3000 m3.s-1, respectively. A homogeneous Manning coefficient of 0.06 leads to a simulated water fall of 1.20 m between A1 and F2. This quite high flow resistance value likely involves the effect of sinuosity and overbank flow processes on energy losses.
4. Results
4.1. Overview of water and suspended sediment fluxes
By comparing the total suspension fluxes through each section (Fig. 4), we can draw a first balance of the ways of transport and of their relationship to the hydrodynamics and morphology of the channel. Most of the sedimentary flux (≈ 73%) passes through the artificial canal (between A3-E3). In the former meander, the sediment transit is weak and progressively decreases with the distance (Fig. 4). The high SSC values reappear downstream the confluence (E1-F2). This heterogeneity and its spatial variations enable us to design a box model of the transport of sediments for the investigated sector.
At the nodal point of bifurcation, the water as well as suspended sediment flux balances are conservative. The water discharge A2+A3 (510 + 2436 = 2946 m3.s-1) exceeds the discharge through A1 (2905 m3.s-1), while the loss of sediments between cross sections A2+A3 (73 + 246 = 319 kg.s-1) and section A1 (338 kg.s-1) is 19 kg.s-1, i.e., a relative variation lower than 6% (not significant in comparison with measurement uncertainties).
The water discharges and the sediment fluxes progressively decrease along the cutoff meander from 510 m3.s-1 (A2) to 406 m3.s-1 (E2) and from 73 kg.s-1 (A2) to 8 kg.s-1 (E2), respectively, indicating an obvious siltation in the main channel and in the floodplain as well. Sediment flux “losses” are significant between sections B/C1 (70/27 kg.s-1) and D/E2 (22/8 kg.s-1) only. All in all, the flow and sediment flux issuing from the meander lost 104 m3.s-1 and 65 kg.s-1 in comparison to the flow entering the meander. These gross values suggest a complex balance
between local supplies and losses toward the most important canal in the left bank, the Uzlina canal (the mean values of the water (m3.s-1) and sediments (kg.s-1) discharges entering the Uzlina lake through the canal are 16.4 m3.s-1 (or 1.5%) and 3.0 kg.s-1 (or 1%), values for the period 1981-1989).
Fig. 4. A box model for SS fluxes, streamflow, and SSC by section through the Mahmudia river network
In the artificial canal, the water discharge balance is rather conservative (+ 9%), whereas the output sediment flux increases by 90 kg.s-1 (+ 36.5%) between sections A3 and E3. Hence, the canal potentially is an area with significant erosion.
The confluence is a complex sector because profile E1 exhibits a sedimentary flow (422 kg.s-1) larger than the total sum of the potential supplies (E2+E3 = 344 kg.s-1), while the water discharge balance is almost conservative. The flow decrease between sections E1, F1 and F2 (3241 m3.s-1 to 2514 m3.s-1 and 2476 m3.s-1) is due to a export of ≈ 700 m3.s-1 toward the Murighiol canal in the right bank. The decrease in the sedimentary transit (422 kg.s-1 to 236 kg.s
-1) between profiles E1 and F2 can be explained by a progressive decrease in energy but also by
the overflowing that causes a progressive decrease in discharge and concentration, from the sedimentation in the floodplain.
4.2. Morphological profiles
Raw bathymetry data extracted from the aDcp measurements are not georeferenced, and the elevations are relative to the local free-surface level. For further morphological analysis, the cross-sectional profiles were georeferenced by DGPS tracking; the free-surface stage was estimated according to the 1.25 m water fall observed between sections A1 and F2. Hence, the margin of error in bed elevation estimates typically is 2-3%. Because of unmeasured areas on the sides of channels, the total cross-sectional width typically is underestimated by 2-5%.
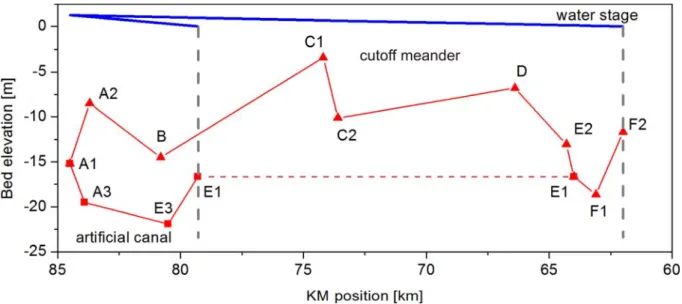
Regarding the natural former meander, the mean talweg slope (A2-E2) is very low (0.089 m.km
-1). The upstream reach (A1-A2, downstream of the bifurcation) corresponds to an important
reduction of the depth (Fig. 5). The talweg line remains located on the right bank (which was concave before the cutoff) and varies from -16 m (A1) to -9 m (A2) in depth (i.e., a counter-slope of -8.75 m.km-1); in the left bank between B and C1 (the convex bank of the sinuosity), another counter-sloping area attests to an accumulation of sediments. Downstream, the talweg depth increases locally in the concave bank of the apex (-15.5 m on B, -10.6 m on C2). Close to the confluence upstream, profile E2 shows a deepening toward the right bank (-13.2 m). It could be attributed either to the original concave pool of the bend or to the water swirls coming out from the canal; between E2 and E1 a steep talweg slope (22.9 m.km-1) is observed.
The entrance in the artificial canal (A1-A3) corresponds to an increase in depth (from -16 to -0.8 m, or a local talweg slope of 7.4 m.km-1). Between A3-E3, the slope of the canal decreases (0.3 m.km-1). However, the confluence (E3-E1) is characterized by a counter-slope of -8.5 m.km-1, which may correspond to a sedimentary deposition caused by the junction of both flows.
In the natural channel downstream of the confluence, the talweg goes from -18.8 m (F1) to -11.3 m (F2) in depth, with a counter-slope of -8 m.km-1, which likely corresponds to deposition between the two sections.
Fig. 5. The talweg and water stage profiles along the natural channel (A1-F2) and the artificial canal (A3-E3)
The observed morphology clearly records the impact of the artificial canal on the whole alluvial system. The natural channel adapts to the flow decrease, but its response varies streamwise because of sediment infilling. On the contrary, the artificial canal is characterized by an increase in depth that creates a well-calibrated shape suitable for maintaining high energy. The intersections of the cutoff channel with the artificial canal at the bifurcation and at the confluence are accumulation sectors with counter-slopes, either in relation to flow/velocity decrease (A2) or to the junction of contrasting flows (E1).
4.3. Flow and sediment processes
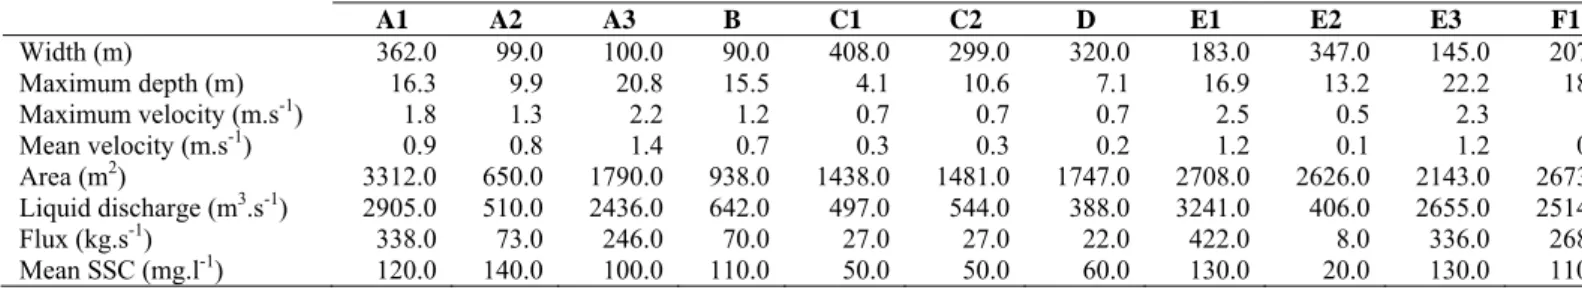
The analysis of the aDcp velocity data provides evidence as to the highly heterogeneous hydrodynamical conditions in the different reaches of the Mahmudia alluvial system (Table 1). Upstream of the bifurcation, the flow (2905 m3.s-1) is homogeneously distributed across the approach section A1 (Fig. 6A). The average velocity is 0.9 m.s.-1. Then the bifurcation splits the flow into two hydrodynamically contrasted branches: the main flow (2436 m3.s-1 or 82%) is captured by the artificial canal (A3) where velocity increases (an average of 1.4 m.s-1).
A1 A2 A3 B C1 C2 D E1 E2 E3 F1 Width (m) 362.0 99.0 100.0 90.0 408.0 299.0 320.0 183.0 347.0 145.0 207 Maximum depth (m) 16.3 9.9 20.8 15.5 4.1 10.6 7.1 16.9 13.2 22.2 18 Maximum velocity (m.s-1) 1.8 1.3 2.2 1.2 0.7 0.7 0.7 2.5 0.5 2.3 Mean velocity (m.s-1) 0.9 0.8 1.4 0.7 0.3 0.3 0.2 1.2 0.1 1.2 0 Area (m2) 3312.0 650.0 1790.0 938.0 1438.0 1481.0 1747.0 2708.0 2626.0 2143.0 2673 Liquid discharge (m3.s-1) 2905.0 510.0 2436.0 642.0 497.0 544.0 388.0 3241.0 406.0 2655.0 2514 Flux (kg.s-1) 338.0 73.0 246.0 70.0 27.0 27.0 22.0 422.0 8.0 336.0 268 Mean SSC (mg.l-1) 120.0 140.0 100.0 110.0 50.0 50.0 60.0 130.0 20.0 130.0 110
Table 1 - Hydrodynamical and sedimentary parameters in investigated cross-sections
The former meander (A2) receives only 18% of the upstream flow (510 m3.s-1), with slightly reduced velocities (an average of 0.8 m.s-1). Farther downstream, the former meander is characterized by a progressive decrease in average velocity (0.7 to 0.1 m.s-1 from B to E2).
Fig. 6. aDcp depth-averaged velocitys and river-bank contours within sectors of (A) bifurcation and (B) confluence. Channel contours were digitized from a satellite image dating from June 2000 for different hydrological conditions than during the measurement period
The flow rate also decreases (from 642 to 406 m3.s-1 from B to E2) because of a waste of water toward small channels starting from the left bank. Around the first apex (B), the channel dissymmetry produces highest velocities near the concave bank of the meander. In C1 and C2 sections, the velocities are homogeneously distributed again, as the channel is much less sinuous.
At the confluence (Fig. 6B), the E2 profile is still characterized by low and homogeneous velocities (average 0.1 m.s-1) and by a low discharge (406 m3.s-1). It sharply differs from the upstream profile of the artificial canal (E3) where a high discharge arrives (2655 m3.s-1) with high velocity (average 1.2 m.s-1); E3 is an asymmetrical profile (vertical fast curls close to the right bank between 1.8 and 2.4 m.s-1, lower velocities toward the left bank and close to the bottom, ranging from 0.8 to 1.5 m.s-1). Downstream of the confluence (E1), the flow is concentrated in the central part of the channel. This velocity asymmetry stems from the sharp contrast between input flows from both upstream channels. The resulting total discharge is 3241 m3.s-1.
Downstream of the confluence, the influence of the fast waters coming out from the artificial canal is rapidly diminished. The velocities progressively increase from 0.9 m.s-1 in F1 to 1.1 m.s
-1 in F2. However, a nucleus of higher velocity (between 1.1 and 1.4 m.s-1) persists on the F1
right bank, determined by the water supply of the artificial canal, while the velocity distribution remains uniform for F2 (Fig. 8).
Fig. 8. Distribution of local velocity magnitude within cross-sections of the Mahmudia river network (A1/A3/B/E1/E3/F1)
The aDcp discharge and velocity measurements allow the evaluation of the one-dimensional numerical simulation performance (MAGE). The simulated distribution of the total discharge (3000 m3.s-1) between the artificial cutoff canal (2520 m3.s-1) and the former meander (480 m3.s
-1) is in acceptable agreement with the discharges measured by aDcp (Table 1). Simulated mean
velocities also closely follow the measured trends (Fig. 7).
However, results in the upstream part of the former meander suggest that some extra investigation of sections would have been necessary there in order to describe the channel more accurately: measurements are lacking to decide whether the simulated velocity profile is correct or some hydraulic controls are missing. In the last two sections (F1 and F2), downstream
simulated velocities are biased high because of significant overbank flow: flow rate in the main channel is 3000 m3.s-1 in the model, whereas about 500 m3.s-1 are missing in the aDcp discharges. In spite of these limitations, the simulation results are reliable enough for further interpretation of the hydrodynamical behavior of the system.
4.4. Local hydrosedimentary processes
The distribution of local velocities and SS concentrations varies with every investigated section, depending on the local morphology. In particular, the sections situated near the bifurcation (A1/A3) in the apex of the former meander (B) and those close to the confluence (E1, E3, and F1) are characterized by high local velocities (from 1.2 to 2.5 m.s-1) and by the presence of gravitationally related sedimentary flows associated with SSC plumes (Figs. 8 and 9). The concentrations range between minimal values of 10-20 mg.l-1 and maximal values exceeding 180 mg.l-1.
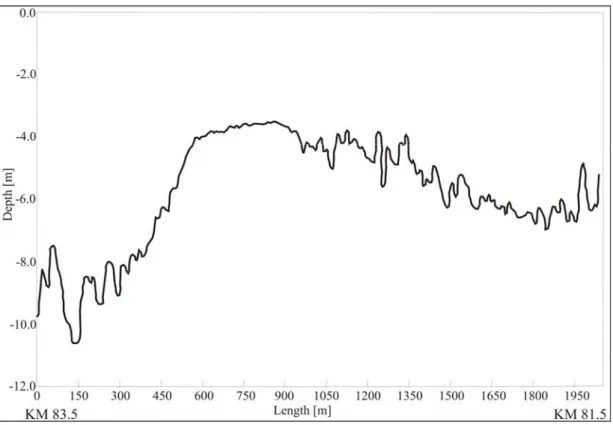
For the symmetrical sections A3, E3, E1, and F1, the concentrations are classically higher near the bed and the banks and lower near the free-surface and the central part of the channel. Section E1 situated upstream of the confluence records flows with very contrasting concentrations. Going into the details of three-dimensional velocity and concentration data, some vertical plumes with high SSC suggest that gravitationally related sedimentary flows are eroding sediments from the bottom layer. Such hydrosedimentary patterns particularly appear near the less steep slopes of convex banks (sections A1, B, and F1) and also in deep and calibrated sections (E3 and E1). They may be related to the development of the bedforms. Popa et al. (unpublished report) and Panin et al. (1992) reported the existence of dunes with heights ranging from 0.5 to 2 m and a wavelength of 20-40 m; they can be entirely mobilized during extreme floods like the 2006 great flood. A longitudinal aDcp profile of 2.4 km was acquired during the 2006 campaign along the former meander between KM 83.5 and KM 81.5 (fig. 10). These bathymetry data show the structure of high dunes ranging from 0.5 to 2 m and from 4 to 13 m in waveheight, respectively.
It also illustrates the fact that between two aDcp cross sections some hydraulic control sections can be missing for the one-dimensional numerical model.
Fig. 9. Distribution of local SSC within cross sections of the Mahmudia River network (A1/A3/B/E1/E3/F1)
The following discussion will focus on potential coherence between our results and the other available data concerning the geomorphological evolution of the studied area. The deposition/erosion reaches suggested by boundary shear stress and SSC variability as well as the morphological evolution will be analyzed. A balance of the total SSC flux through the St. George branch is drawn.
Fig. 10. Longitudinal talweg profile in the former meander between KM 83.5 and KM 81.5
5. Discussion
5.1. Event-scale morphodynamical analysis
Local morphodynamical processes during the 2006 flood are analyzed through two geomorphological parameters: the specific stream power indicating the stream ability to adjust its channel morphology (Biedenharn et al., 2000); and the boundary shear stress indicating the flow capacity to mobilize sediment from the bed as suspended-load or bedload.
Morphodynamical activity is generally assessed by the specific stream power (ω) as an indicator for the river transport capacity (Bagnold, 1966):
ω = Ω / B [W.m-2] (1)
where B is the bankful channel width and Ω is the stream power that writes:
Ω = ρg Q S [W.m-1] (2)
where the representative discharge Q [m3.s-1] is usually taken as the bankful discharge Qbf. In the present analysis, the discharge gauged by aDcp for each channel is taken as the representative discharge. As for bed shear stress estimates (see below), the energy slope S is
approximated by the observed mean water slope. The specific stream power is actually a complex index, especially when applied to meander systems, where the water slope is influenced by the sinuosity and variations of the width of the channel (Schmitt et al., 2001).
Table 2 - Values of ω and τ0 in the Mahmudia meander cross-sections
Sectors with high specific stream power (above 29 W.m-2) are to be found in the artificial canal (A3, E3, Table 2) because of low width and steep slope. In the former meander, stream power values are logically much lower because of the lower slope and longer length (A2/E2: below 4 W.m-2). In the upstream (A1) and downstream (E1/F2) single channels, ω values are quite high (from 14.1 W.m-2 in A1 to 27.2 W.m- 2 in E1 and around 20 W.m-2 in F1/F2).
The mean bed shear stress (τ0) corresponds to the unit tractive force exerted on the bed:
τ0 = ρ g R S [N.m-2] (3)
where ρ is the fluid density (1000 kg.m-3 for sediment-free water), g is the gravitational acceleration (9.81 m.s-2), R is the the hydraulic radius [m], S is the water energy slope [m.m-1] (i.e., S = 0.056 m.km-1 in the former meander (A2-E2) and S = 0.174 m.km-1 in the main channel
(A1/F2)).
Experimental estimates of τ0 are generally in good agreement with the MAGE simulation results
(Fig. 11). The numerical results offer a more continuous view of the variability in the erosion capacity along both channels. However, the dramatic increase of simulated bed shear stress values in the very downstream part of the reach (F2) seems unrealistic because of the ignored overbank flow effects.
Compared with the value in the approach section A1, the shear stress is significantly higher in the artificial canal (A3/E3) and in the downstream channel (E1/F1). In the former meander, shear stress values are dramatically lower (A2/E2). The apex at section B corresponds to the most
Sections A B C D E F A1 A2 A3 B C1 C2 D E1 E2 E3 F1 F2 ω [W.m-2 ] 14.1 2.2 34.4 3.3 0.6 0.8 0.6 27.2 0.4 29.8 19.7 18.6 τ0 [N.m-2] 15.5 2.7 24.1 4.9 1.9 2.6 2.8 22.0 4.1 23.4 21.1 16.4
active reach in the former meander. Thus, simulated bed shear stress values indicate high erosion capacity in the artificial canal and lower and decreasing erosion capacity in the former meander (deposition reaches).
Fig. 11 - Mean bed shear stress from 1D simulation and estimates with Eq. 3
This analysis of potential erosion/deposition reaches is coherent with the values of mean cross sections averaged SSC (Fig. 12) as well as the SS flux analysis supported by the box model (Fig. 4).
The decrease in mean SSC up to section C1 (50 mg.l-1) confirms that sediment deposition mainly occurs in the first half of the former meander. In the artificial canal, the increase in SSC between A3 and E3 (from 100 to 130 mg.l-1) confirms the existence of erosion processes already evidenced as upwelling sediment-laden plumes originating from the bed. These vertical sediment plumes are associated with high values of τ0 for sections A1, B, E1, E3, and F1, which allows for
the resuspension of the bed material.
5.2. Long-term morphodynamical analysis
The measurements performed in April 2006 represent an opportunity for relating the multiannual morphological balances to the sedimentary flows occurring during a morphogenic flood event. Slope adjustments are often the dominant morphological response when alluvial channels are cut off that facilitated the accretion of the former meanders (Biedenharn et al. 2000). Shields et al. (1984) explained that the accretion of the alluvial plug (i.e. the terrestrial unit formed at the mouth of the former channel) are controlled by the geometry of the former channel, particularly by the ratio between the former channel length and the new channel length, and the upstream angle between them. Most authors suggest that the older the cut-off channel, and the closer it is to the main channel, the thicker the overbank deposits will be (Piegay et al (2000)).
Lane (1947) distinguished two phases: 1. immediate response occurring a short time after the cutoff is implemented; 2. subsequent response taking place gradually and over a very long period.
For the Mahmudia cutoff meander, the first phase was monitored by Popa (1997) who carried out a sequence of bathymetric measurements during a period of six years immediately after the building of the artificial canal. The measurements were made with a portable computerized
system (Biotron S.A Company, Bucharest) that performed simultaneous measurements of the flow velocity and depth. The velocity was measured with an electromagnetic currentmeter, while depth was measured by a differential pressure sensor. The measurements were carried out every year in September or October, when the Danube discharge usually reaches the lowest values. The bathymetry profiles were situated at the bifurcation of the Mahmudia meander, close to our three aDcp profiles (A1/A2/A3).
Fig. 13. River-bed evolution (1990-1996) in the Mahmudia modified system (Popa, 1997) and maximal monthly discharges between 1990 and 2004 at Ceatal St. George gauging station
The monitoring of the bifurcation cross sections (Fig.13) shows that the channel morphology adjusted suddenly during the studied period with the intense plugging of the former meander inlet (aggradation rates up to 11 m, i.e., 1.8 m.y-1) and the intense scouring of the artificial canal (degradation rates up to 13 m, i.e., 2.1 m.y-1). Dramatic deposition in the former meander even caused the development of islands rapidly fixed by the riparian forest. In addition, Jugaru et al. (2006) showed that the meander mobility in the horizontal plane has been fixed since the 1990. The comparison of bathymetry profiles measured by Popa (1990-1996) and our measurements of 2006 makes sense as the hydrologic regime was similar between 1990 and 2000 (homogeneity of
the maximal monthly discharges, cf. Fig.13). The comparison shows that during the last few years the morphodynamical processes have dropped in intensity: the sedimentation rate in the former meander was only 0.1 m.y-1 during 1996-2006, whereas the erosion rate in the artificial canal was 0.2 m.y-1. Such a contrast in evolution rates is much more significant than potential errors stemming from the different measuring procedures followed by Popa (1997) and us. This clearly indicates that after a fast relaxing evolution, the morphology of the alluvial system has reached its new dynamic equilibrium.
5.3. Sediment balance in St. George branch
The SSC concentrations found in the investigated sections during the flood (10-180 mg.l-1) are quite low in comparison with data recorded in the world major rivers. Meybeck et al. (2003) reported the following values for daily SSC: 849 mg.l-1 for the Mississippi River (USA), 962 mg.l-1 for the Mekong River (Thailand), 8240 mg.l-1 for the Rio Grande River (USA), and even 15 760 mg.l-1 for the Colorado River (USA). A study on the Rhône River during a flood period indicates high SSC values of 3689 ± 0.05 mg.l-1 (Antonelli et al., in press).
The volume of the deposited sediments within the former meander between the A2-E2 sections can be estimated to be 0.0035 x 10⁶ m3.d-1, for a discharge water of 4600 m3.s-1 (at Ceatal St. George).
An estimation of the suspended solid discharge at the mouth of the St. George branch and to compare it with the previous estimates is calculated. Panin and Jipa (2002) and Panin (2003) calculated the amount of solid fluxes for the period following the building of the dam (1983-2000). They estimated the suspended sediment output at the mouth of the St. George branch to be 24.2% of the total Danube output and to lie between 3.8 x 10⁶ and 6 x 10⁶ m3.y-1. For the same period and the same station, Bondar (unpublished data) mentioned a value of 2.99 x 10⁶ m3.y-1.
For the three days during our aDcp measurements, we estimated the solid volume going out of the Mahmudia system to be between 0.043 x 10⁶ and 0.068 x 10⁶ m3. These values are higher than the data reported by Panin and Jipa (2002) and Panin (2003) (between 0.012-0.016 x 10⁶ m3.d-1). Deviations between estimates are significant, but unfortunately the same order of magnitude as the expected errors associated with the estimating method each author used.
Further research could deal with sediment storage in the former meanders located downstream. The St. George branch loses alluvial material load along its course by progressive sedimentation and laterally through channels, canals, crevasses, and overflow. The storage amounts to ≈ 0.005 x 10⁶ m3.d-1 (≈ 43%, mean value for the years 1981-1989), according to Bondar and Panin (2000). This high value can be explained by the discontinuity in sediment transport capacity from training works achieved in that specific period of time, as studied at the Mahmudia site in this paper.
6. Conclusion
This paper reports the flow and sedimentary analysis of a cutoff meander in the Danube Delta, the Mahmudia cutoff meander system. The aDcp and water sampling survey performed during the 2006 100-year recurrent flood offered data on the distribution of water and suspended-load fluxes through both natural and man-made channels. Since the meander correction, morphological trends were assessed through the bed shear stress estimates and through the available morphological monitoring. The impact of the 2006 100-year recurrent flood is observed in the velocity and SSC distributions on the investigated cross-sections. The water flow acceleration in the artificial canal (from 1.8 m3.s-1 upstream the bifurcation to 2.3 m3.s-1) enhances incision processes in the artificial canal (gravitationally related sedimentary flow), while the liquid and solid fluxes through the former meander are greatly reduced (from 338 kg.s
-1 upstream the bifurcation to 73 kg.s-1 even 8 kg.s-1, with sediment deposition processes),
visible infilling processes (observed through the development of islands fixed by the riparian forest) correlated with the decrease in hydraulic energy. Since 1996, the morphology of the alluvial system seems to have nearly reached a new state of dynamical equilibrium (diminishing of the sedimentation rate in the former meander (0.1 m.y-1) and of the erosion rate in the artificial canal (0.2 m.y-1)).
Similar measurements for other hydrological events and even for other deltaic meanders would be valuable to assess the generality of our conclusions. In particular, knowing how the observed processes scale with the multiannual flow rate in the St. George branch would be useful. Our process-oriented observations can contribute to further comprehensive studies with extended time and space scales in order to establish a sediment balance for the whole St. George branch or the whole Danube Delta.
7. Acknowledgements
This paper was accomplished within a bilateral Brancusi ”Fonctionnement des systèmes hydro-sédimentaires de deux zones deltaïques: le Rhône et le Danube”, project holding between GeoEcoMar (Bucharest, Romania) and CEREGE (Aix-en-Provence, France) and within a National Project, “The Black Sea: Biotical, paleoecological and paleoclimatic evolution since the last 7000 years” (PNCDI II IDEI, no. 364/2007).
The authors thank the team of Geomorphology from CEREGE for their technical and logistic support and for their participation in the campaign for data acquisition. Many thanks as well to the Cemagref (Lyon, France) for logistic support and data processing.
8. References
Antonelli, C., Eyrolle, F., Rolland, B., Provansal, M., Sabatier, F., in press. Suspended sediment and 137Cs fluxes during exceptional floods. Case study: The Rhone River (SE France) in
Bagnold, R.A., 1966. An Approach to the Sediment Transport Problem from General Physics. U.S. Geological Survey Professional Paper 422-I, pp. 1-37.
Batalla, R.J., Gómez, C.M., Kondolf, G.M., 2004. Reservoir-induced hydrological changes in the Ebro River basin (NE Spain). Journal of Hydrology, 290, Issues 1-2, 117-136
Biedenharn, D.S., Thorne, C.R., Watson, C.C., 2000. Recent morphological evolution of the lower Mississippi River. Geomorphology 34, 227-249.
Bondar, C., 2004. Studiul privind consecintele asupra mediului, precum si cele economice si sociale in Rezervatia Biosferei “Delta Dunarii” Romania, determinate de constructia canalului Bastroe din Rezervatia Biosferei Dunarea-Ucraina. Report GeoEcoMar, Bucharest, Romania.
Bondar, C., Panin, N., 2000. The Danube Delta hydrologic database and modeling. GeoEcoMarina 5-6, 5-53.
Dinehart, R.L., Burau, J.R., 2005. Repeated surveys by acoustic Doppler current profiler for flow and sediment dynamics in a tidal river. Journal of Hydrology 314, 1-21.
Fergus, T., 1997. Geomorphological response of a river regulated for hydropower: River Fortun, Norway. Regul. Rivers: Res. Mgmt 13, 449-461.
Gartner, J.W., 2004. Estimating suspended solids concentrations from backscatter intensity measured by acoustic Doppler current profiler in San Francisco Bay, California. Marine Geology 211, 169–187.
Giosan, L., Bokuniewicz, H., Panin, N., Postolache, I., 1999. Longshore Sediment Transport Pattern Along Romanian Danube Delta Coast. Journal of Coastal Research 15 (4), 859-871. Gonzalez-Castro, J.A., Muste, M., 2007. Framework for estimating uncertainty of ADCP
measurements from a moving boat by standardized uncertainty analysis. J. Hydraulic Eng. 133 (12), 1390-1410.
Harmar, O.P., Clifford, N.J., Thorne, C.R., Biedenharn, D.S., 2005. Morphological chamges of the Lower Mississippi River: geomorphological response to engineering intervention. River Res. Applic 21, 1107–1131.
Hooke, J.M., 1986. Changes in Meander Morphology. International Geomorphology, Part I, Wiley, Chichester, pp. 591- 600.
Ichim, I., Radoane, M., 1986. Efectele barajelor in dinamica reliefului. Abordare geomorfologica. Editura Academiei. Bucuresti.
Ielenicz, M., Negut, S., Ene, M., Savulescu, I., Vlad, L.B., Neacsu, M.C., 2006. Atlas Geografic General. ISBN: 978-973-749-076. Editura Universitara.
Jimenez, J.A., Sanchez-Arcilla, A., 1993. Medium-Term Coastal Response at the Ebro Delta, Spain, Marine Geology 114, 105-118.
Jugaru, L., Provansal, M., Panin, N., Dussouillez, P., 2006. Apports des Systèmes d’Information Géographiques à la perception des changements morphodynamiques (1970-2000) dans le delta du Danube. Le cas du bras de Saint-George. Geo-Eco-Marina 12, 29-42.
Keller, E.A., 1972. Development of alluvial stream channels. Bulletin of the Geological Society of America 83, 1531-1536.
Kesel, R.H., 2003. Human modifications to the sediment regime of the Lower Mississippi River flood plain. Geomorphology 56, 325-334.
Kiss, T., Fiala, K., Sipos, G., 2007. Alterations of channel parameters in response to river regulation works since 1840 on the Lower Tisza River (Hungary). Geomorphology 98 (1-2), 96-110.
Kostaschuk, R., Best, J., Villard, P., Peakall, J., Franklin, M., 2005. Measuring flow velocity and sediment transport with an acoustic Doppler current profiler. Geomorphology 68, 25-37. Land, J. M., Jones, P. D., 2001. Acoustic measurement of sediment fluxes in rivers and
Lane, E.W., 1947. The Effect of Cutting Off Bends in Rivers. Studies in Engineering University of Iowa City, Iowa City, pp. 239-240.
Le Coz, J., Chastan, B., Védie, F., Dramais, G., 2007. Emplois de l’aDcp en rivière : une revue de synthèse. (Uses of aDcp in rivers: a review, in French) La Houille Blanche 4, 10.1051/lhb:2007042.
Meybeck, M., Laroche, L., Dürr, H.H., Syvitski, J.M.P., 2003. Global variability of daily total suspended solids and their fluxes in rivers. Global and Planetary Change 39, 65-93.
Mihailescu, N., 1983. Lower Danube Recent Alluvia Sediments and Sedimentary Factors, An. Inst. Geol. Geof., Bucuresti, 287-296.
Panin, N., 2003. The Danube Delta. Geomorphology and Holocene evolution: a synthesis. Géomorphologie : Relief, Processus, Environnement 4, 247-262.
Panin, N., Jipa, D., 2002. Danube river sediment input and its interaction with the North – western Black Sea. Estuarine, Costal and Shelf Science 54, 551-562.
Panin, N., Popa, A., Gaita, C., Farnoaga, D., 1992. Dinamica sedimentelor pe bratele Dunarii in delta. Modificarile determinate de amenajarile hidrotehnice. Simpozionul “Provenienta si efluenta aluviunilor” 4/1992, Piatra Neamt, Romania.
Piégay, H., Bornette, G., Citterio, A., Hérouin, E., Moulin, B., Statiotis, C., 2000. Channel instability as a control on silting dynamics and vegetation patterns within perifuvial aquatic zones. Hydrological processes 14, 3011-3029.
Popa, A., 1997. Environment changes in the Danube Delta caused by the hydrotechnical works on the St. George branch. Geo-Eco-Marina 2, 135-147.
Popa, A., Panin, N., Farnoaga, D., Mihaila, E., unpublished report. Observatii asupra modificarilor determinate de amenajarile hidrotehnice de pe bratul Sf. Gheorghe, in transportul de apa si de sedimente.
Reichel, G., Nachtnebel, H.P., 1994. Suspended sediment monitoring in a fluvial environment: advantages and limitations applying an acoustic Doppler current profiler. Water Research 28 (4), 751-761.
Rotaru, E., Le Coz, J., Drobot, R., Adler, M.J., Dramais, G., 2006. ADcp measurements of suspended sediment fluxes in Banat rivers, Romania. Balwois, Ohrid, Macedonia, 23-26 May 2006, p. 13.
Schmitt, L., Maire, G., Humbert, J., 2001. La puissance fluviale: définition, intérêt et limites pour une typologie hydro-géomorphologique de rivière. Z. Geomorph. N. F. 45, 2, 201 - 224. Sestini, G., 1992. Implications of Climatic Changes for the Nile Delta, in Jeftic, L., Milliman,
J.D., and Sestini, G.(editors),Climatic Change and the Mediterranean, Edward Arnold, New York, 535-601.
Shields, F.D., Nunnally, N.R., Asce, A.M., 1984. Environmental aspects of clearing and snagging. Journal of Environmental Engineering 110 (1), 152-165.
Stanley, D.J., 1996. Nile delta: extreme case of sediment entrapment on a delta plain and consequent coastal land loss. Marine Geology 129 Letter Section, 189-195.
Stanley, D.J., Warne, A.G., 1993. Nile delta: recent geological evolution and human impact. Science 260, 228-231.
Topographical Military Direction, 1980. Topographical maps, 1:25000, sheets L–35–107–C–a, L–35–107–C–b, L–35–107–C–c, L–35–107–C–d, Bucharest, Romania.
Vandenberghe, J., 2003. Climate forcing of fluvial system development: an evolution of ideas. Quaternary Science Reviews 22, 2053-2060.
Yorke, T.H., Oberg, K.A., 2002. Measuring river velocity and discharge with acoustic Doppler profilers. Flow Measurement and Instrumentation 13, 191-195.