Sahel droughts and Enso dynamics
Texte intégral
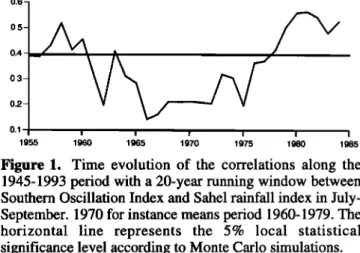
Figure
Documents relatifs
Nonlinear principal component analysis (NLPCA) is applied on detrended monthly Sea Surface Temperature Anomaly (SSTA) data from the tropical Atlantic Ocean (30°W-20°E, 26°S-22°..
Title: Spatial analysis of the La paca, SE spain, 2005 seismic series through the relative location of multiplets and principal component analysis..
The problems as well as the objective of this realized work are divided in three parts: Extractions of the parameters of wavelets from the ultrasonic echo of the detected defect -
The problems as well as the objective of this realized work are divided in three parts: Extractions of the parameters of wavelets from the ultrasonic echo of the detected defect -
It is recalled that the global stochastic model is representative of the track irregularities for the whole high-speed line and has the capacity to generate the track irregularities
According to the point of view of the French mathematicians who participated to the conference, a number of topics on which Iraqi mathematicians are doing research is not connected
In particu- lar, if the multiple integrals are of the same order and this order is at most 4, we prove that two random variables in the same Wiener chaos either admit a joint
All material properties are estimated on the basis of local temperature and relative humidity measurements, by solving the inverse heat and moisture transfer problem.. The
