HAL Id: hal-00497732
https://hal.archives-ouvertes.fr/hal-00497732
Submitted on 8 Feb 2021
HAL is a multi-disciplinary open access
archive for the deposit and dissemination of
sci-entific research documents, whether they are
pub-lished or not. The documents may come from
teaching and research institutions in France or
abroad, or from public or private research centers.
L’archive ouverte pluridisciplinaire HAL, est
destinée au dépôt et à la diffusion de documents
scientifiques de niveau recherche, publiés ou non,
émanant des établissements d’enseignement et de
recherche français ou étrangers, des laboratoires
publics ou privés.
Far-field seismogram perturbations induced by
topographical heterogeneity
Stéphane Gaffet, B. Massinon
To cite this version:
Stéphane Gaffet, B. Massinon. Far-field seismogram perturbations induced by topographical
hetero-geneity. Geophysical Research Letters, American Geophysical Union, 1997, 24 (24), pp.3313-3316.
�10.1029/97GL02977�. �hal-00497732�
GEOPHYSICAL
RESEARCH
LETTERS,
VOL. 24, NO. 24, PAGES
3313-3316,
DECEMBER
15, 1997
Far-field seismogram perturbations induced by
topographic heterogeneity
Stdphane
Gaffet
I and Bernard Massinon
2
Abstract. The far-field contribution of the wavefield
diffracted by topographical heterogeneities located in the
vicinity of sources is analyzed in the case of nuclear explo-
sions detonated inside the Taourirt Tan Afella massif, Alge- ria. The far-field scattered field is strongly shaped by the geometry of the topography and by the source location in-
side the mountain. Focusing and defocusing of the pP wave
are shown. Back-scattering inside of the massif appears in the coda of the pP phase. For specific take-off angles, ie for
given teleseismic distances, broadening of the pS diffracted
field may appear. This broadening is explained by the si- multaneous arrival of the pS and the P surface wave to S converted wave, with similar polarizations.
Introduction
The 'relation between crustal structures and far-field ra-
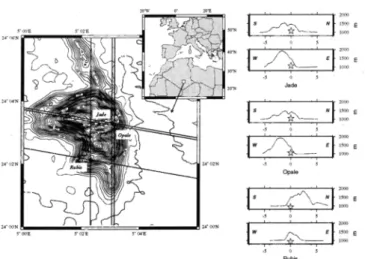
diation is studied in the context of the Taourirt Tan Afella 1960s French nuclear test site on the Ahaggar plateau in Al- geria. The location and topography of the granitic massif is
depicte•d Fig. 1. The geological context has been described
by Faure, small 1972, Boullier and Bertrand,. small 1981, Duclaux and Michaud, small 1970, and Munier, small 1982. The present study analyses both radial and transverse dis- placement components emitted by the ground irregular to-
p•>graphy
in the source
region
with the aim of understand-
ing waveform variations at different take-off angles for Jade,Opale, and Rubis nuclear tests (Table 1). Large amplitude
variations 'occuring at local distances in relationship with the efficiency of Rayleigh wave generation by each side of
the topographical heterogeneity was published in a previous
paper ( Gaffet et al., small 1994). Our main objective here
is to describe the topographic contribution of the far-field wavefield.
Study
Numerical simulations of synthetic seismograms are done
using the discrete wavenumber- indirect boundary integral
method ( Gaffet and Bouchon, small •989) for two topo-
graphic profiles along N0 ø and N100 ø azimuths. These 2D profiles cross the Tan Afella massif as depicted in Fig. 1.
The closeness of the Jade and Opale explosions makes it pos-
-s o s 2oo0 2oo0
s
•
N 1•oo
E
W
O•••(l
.•
• œ
•oo
E
s lSOO. E ß . w E 1•oo E ,. , -, -.• o • RubisFigure 1. Geographic. location of the 1960s French Nu-
clear Test site, location of the 3 explosions studied, and 2D topographical SN and WE profiles for Jade/Opale and Ru-
bis explosions. The elevation and horizontal offset are given
in meters and in kilometers respectively
sible to consider both sources as a single detonation point.
In the aim of understanding the topography influence, we study the radial and transverse displacement fields diffracted
by the surface (•ai#). Thus, the 2D topographic P-$ V seis-
mograms displayed hereafter do not include the source free
field (aS,•).
fftotal -- firtee q- •diff
(1)
The right side of Fig. i displays the 2D cross section con- figurations and the explosion locations used for the calcula-
tions. The P and S wave velocities are c• = 5.3 km/s and
/3 = c•/•f• ( Munier,
small
1982). The maximum
steep-
nesses of the topography are 29 ø , 32 ø , 35 ø , and 32 ø for Jade
N0 ø, Jade N100 ø, Rubis N0 ø, and Rubis N100 ø respectively.
The far-field influence analysis of source site effects deduced
from
numerical
simulations
performed
with
'the
reciprocity
representation ( Bouchon, small 1976, McLaughlin and Jih,
Table 1. Parameters of the studied explosions
1UMR G•osciences Azur 6526- 250, rue Albert Einstein
- F-06560 Valbonne
2LDG- BP 12- F-91680 Bruyares-le-ChAtel
Copyright 1997 by the American Geophysical Union.
Paper number 97GL02977. 0094-8534/97/97GL-02977505.00
Event Date (UT time) Lat N Lon E
Rubis USGS mb=5.6 Opale Jade 1963 10/20 13:00:00.011 24ø2.130 • 5ø2.317 • ! 1964 02/14 11:00:00.347 24ø3.218 5ø3.143 1965 05/30 11:00:00.037 24ø3.300 5ø3.052 3313
3314 GAFFET ET AL.' FAR-FIELD SEISMOGRAMS
Ground Surface East/North
Transversal component
/!
, \ \ \ Radial
component
IOkm
Illit • •\
Depth
Figure 2. Geometry
used
for calculations.
0 is the take-off
angle positive toward the east and the northsmall 1988, and Gaffer, small 1995), is not convenient to fully describe the contribution of the topographical hetero- geneities to the far-wavefield because one calculation must be done for each take-off angle and for each component in-
vestigated.
Thus, instead of implementing such a huge computa-
tion approach, we here compute the radial and transverse seismograms at a radial distance of 35 km from the source area and for take-off angles ranging from 0 ø to 85 ø toward both sides of the topographical heterogeneity as displayed in Fig. 2. For each topographic cross-section the diffracted field is presented with a 5 ø take-off angle step for the two
Jade/Opale
and Rubis
explosion
configurations
(Figs 3 and
4). This representation
which
does
not include
the t* at-
tenuation or the spalling effect is not, strickly speaking, the teleseismic field, but it appears to be a very useful way of understanding the origin of the different phases that may
appear in the far-field wavefield.
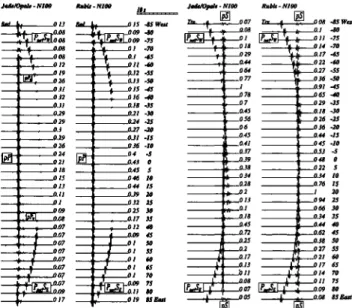
JadtlOpale . NO Rubit . NO Jade/Otmlt . NO Rubit . NO 0.2 •01 -0.1 :0.1 'ol 0.12 0.17 0.22 0.27 0.31 0.35 0.39 0.43 0.47 0.51 0.54 0.53 0.51 0.47 0.41 0.33 0.26 0.19 . 0.14 0.1 "o. 1 -0.1 ?••0.09 Rad 1•. 0 16 .•:a IJa•'$1,0.09 '2: r., . o. 1 ß g:.•;• .o. 1 l[ •-'rd -o.t •l[ t- ra o. 1 i; '•. :o. 11 •.0.11 :::: 0.11 0.12 0.13 •.0. i5 0.18 [• • - 0.22 0.26 •.0.3 . 0.33 0.37 0.41 _. 0.43 •042 . 0.4 , . 0.38 - . 0.33 I. .]_ 0.27 [ : ' 0 19 I.- i . [ 2' 11ol L' ,,r .11o. o9 ;:_,'•0.o8 -80 e7-_32 ';., •:•i 0:14 i -80 -70 a_ -:. 0.16 -70 -65 : •4..._o.22 -60 -6O -55 .... 0.29 •o.•s .so •o.9• •5 • •0.35 •0.69 '•0.27
.•o •o.• •o.•
.•s •o.59 •o.. .•o
.•o •o.5• •o.•s
'"
•o.• •o..
.•
.10
-5
•0. 7
O.5
-
o
5 •0.5
•o
•o.•
• .o.•
' ' .o.•,s
•:s'92
.o.•,
2o
20 •0.71 i... 0.33 252s
•o.•4 •' o.•
30 •0.25 , I 35 Js •o.•t o.s• • •0.92 •0.36 ••0.345
50• 0.•
0.51 5045
0.27 55 55 •;L 0.21 • - 0.2 60 •o•o
IP•••
IP•I f T.• o.o•
•o
•5 No• ..L' .. - 0.08 0.07
Figure 3. Radial and transverse field comparison for Jade-
/ Opale and Rubis explosions at N0 ø cross-section. The seis-
mograms are normalized for each component and their rela- tive amplitude are written on the right side of each displace- ment stack. The take-off angle of the radial component is
written in bold face characters from 0 (vertical incidence) to 85 (grazing incidence). The time duration is 13 seconds
and the source time function is a Ricker pulse with a 3 Hz characteristic frequency
Jade/Opale
- NIO0 Rubit
- NIO0 10•!_• Jade/Opale
Tra _a • 0.07- NIO0 Rubit
Tra ._a ß- NI•
- 0.08 -85 West gad Jr-, 0 13 gad .I,, 0 15 -85 West ' !'- -;"-• 0.08 ' I'a "-_,_o.,
7, .,o
-75;:.,
....•',,;,roO:oO
•
•,.t,.-•,,
J, a0.0•
0.1 -70.,5 ._•1•_0.18
0.,4
.,0
I-r. 0.1 -65 !. 0.22 -6oJ.
[", 0.08
•0.29
0.17
-65
•-
[•
. 0.12
1'
I•l
0.11
.60
.•: :, 0.19 I r• 0.12
i • •.' 0.26 I • 0.13.55
.500.64
.77[ 0.27
•; 0.36.55
-50J
,. ; 031 • •. 0.15-,5 •0.78
t o.91
• 0.65
-•5
-,0
_... ' 031 i • ; 0.,8 .•5 0.7 [. • 0:29 . • _ 0.21 .•0 ---•-I•--0.56 0.45 ', 0.18 • 026 -•0t
oø.7 :
, '
0.27
.20 •0
6
• 0.36
.20
'.
., _ o.,,
-15 0.45l' o.,
. 0.44 -151o
I. ' 0 26 , 0.36 I. - 0:24 o4 . •0.37 1_0.53 - 1-•1; i 0.2, I•- - 0'43 . 0 •0.39 •0.48 0•. . 0.18
o., •.
__d'
2 _ 0.45
_ o.• [o
•0.38
___q•o.•,
•o.•, [o
•. 0.22
li - 0.13 •. _ 0.44 •5
--'--
0'3920
. 0.11 0.2 .1 20 •. 0 1 • . _ 0.32 25 0.13 0.94 25_
.... 0.07 ' • 0.12 •,•
•' J• O.
0.0, t ] 0.,,0
OZ ' • a09
45
.11• 0.27 55... oo• I •- o.• •o
•0..
.t • •.11 J-' ..•. 0.14 70...
, o.o, • •, o, ,o
;L2'•o.o• •o.•
rs
•
•. ,. 0o•
l•M•l.•,
•I. o• •o
•;;" 0.17
•0.19
•5
E=
--[" 0.05 . .- 0.08
•5
E•t
Figure 4. Same as Fig. 3 for the N100 ø cross-sectionsNO ø cross section
The seismograms displayed in Fig. 3 allow a comparison
of the radial (2 left side columns) and transverse (2 right side columns) displacements for both the Jade/Opale and
Rubis cases. The source P-wavelength is approximately one
third the width of the mountain and twice its elevation.
For the Jade/Opale explosions, the southward amplitude
diffracted in the 25 ø to 40 ø take-off range, is 25 to 35 % higher than the amplitude emitted symmetrically toward the north. This amplitude difference mainly applies to the pP
wave which is then overestimated for the southern azimuths
relative to the northern ones. This relative amplification may be explained by good geometrical reflexion conditions of the direct free field p up-going wave inside the northern
flank of the mountain ( Rocard, small 1964). In contrast,
the northward radial diffracted field amplitude of the Rubis explosion, reaches up to 4 times the southward one over a
broad range of take-off angles (ie between 5 ø to 55ø).
The southern azimuthal amplitude attenuation is corre- lated to a lengthening of the p P wave shape compared to
the northern one. Two non symmetrical branches (called
P,,•,.iSx and P,,•,.iSN) appear on the radial and on the transverse components for both explosions. These branches
correspond to the P surface wave to S wave conversion ( Lapwood, small 1949 and Bouchon, small 1978). The ra-
dial amplitude of these branches vanishes as the take-off angle decreases. They join the pS branch for take-off angles around 50 ø . The asymmetrical shapes of these branches are due to the asymmetrical propagation length of the P surface wave along the topography which results in different arrival times on opposite sides of the mountain.
The shape and amplitude variations of the diffracted
transverse field are opposite for the Jade/Opale and Rubis
experiments. This general behaviour is due to the opposite location of the explosion inside the mountain. Thus, take-off angles of 30 ø to 40 ø the southward transverse amplitude is
GAFFET ET AL.- FAR-FIELD SEISMOGRAMS 3315
northward amphtude is 2.5 to 2.8 times the southward one
for Rubis. The pS phase duration is longer and its content
is enriched in higher frequencies for the southern azimuth compared to the northern one in the case of Jade/Opale.
The opposite feature occurs for the Rubis explosion.
N100 ø cross section
The same type of calculations is presented in Fig. 4 for the N100 ø configuration. The characteristic source wave- length stays similar to the previous case for the Jade/Opale calculations. For the Rubis explosion, it is now about one half of the topographic width and 3 times its elevation.
The amphtude radiated for the Jade/Opale explosions is globally larger toward the west than toward the east for both the radial and transverse components. This behaviour is clearly related to a clear strong P reflexion of the free inci- dent p wave field on the eastern flank of the Tan Afella mas- sif. The relative amplification of the radial and transverse
western seismograms reaches up to 4.5 times the amphtude
of the eastern ones and concerns mainly the p P phase. In comparison to the N0 ø cross section, a larger number of
branches appear for the Jade/Opale explosion on both the
radial and transverse components. The Rubis field displays a simpler shape. The N0 ø previously observed branches are noted pP for the first arrivals and P•r ! Sw and P•r ! Sz for
the later arrivals.
Two new phases are also generated and appear in the coda of the pP phase on the radial component: a clearly defined one noted p Pz and a subdued one noted p Pw for
the Jade/Opale explosion. These pPw, z correspond to a
double P reflexion of the incident free p wavefield inside the mountain. The low amplitude and the small time delay
between the p Pw, z and the p P phases are compatible with
this hypothesis and correspond to the results deduced from
local ground displacement simulations at the surface ( Gaffer et al., small 1994). For the Jade/Opale N100 ø explosion, a
strong phase crosses the pSbranch and can followed from the
10 ø westward azimuth to the 35 ø eastward azimuth. This
branch extends the P,•iSw phase that can be seen on the
radial component.
The simple field shape obtained for Rubis may be related
to the smaller size of the massif compared to the Jade/Opale
configuration. Nevertheless some discrepancies are found between the shape of the pP field diffracted from Jade/Opale and from Rubis for ranges of take-off angles from W70 ø to W75 ø and from E55 ø to E70 ø. For these take-off angles, the
pP phase induced by the Jade/Opale explosion has a lower
amplitude and a lower characteristic frequency than the pP phase generated by Rubis.
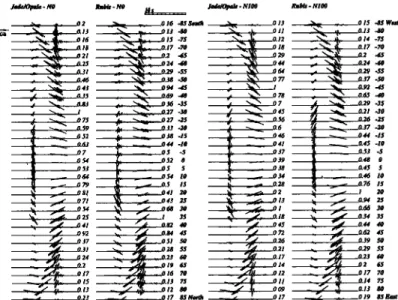
Phase polarization and characterization
Fig. 5 displays the polarization diagram for the studied configurations. This presentation allows a clear understand- ing of the origin of the P,•! $ wave type. For all explosions,
cross-sections, and take-off angles for which it appears, the
P,•! S phase shows a constant polarization angle for west- ern and eastern take-off angles ranging from 50 ø to 85 ø . The
Jade/Opale . NO Rubis - NO 10 s_•_._•_•_• Jade/Opal• - NIO0 Rubis - N IO0
. •o. 13 4o ._...•_•o.u -• i.- o.•3 4o
ß •o.• .7s _...-•,•1t,•o. 1z - _'.• •[ • - o. 0.17 14 .7s -70
•o.•s •o.• .•o •o.•s • • l'
.• •0.•9 .ss 0.• • • 0.•9 - •_ 0.•6 •o.•s .so .• ' • 0.• .so
,fi• ,•-<_•_ 0.27-25 '•- • 0.56 • • a26 .25
• •_ o.• .•o '[. • 0.6 • • o.•7 .•o
,•:•
• o.•s
.•s •.
•.' --• 038
• o.•
] • o.•
a45
.•s
[o
i•0.75 0.59 !t •"' 0.63 4• -• 0.44 .10 o '1 o.• 1[• - o.• {[ • 0.79 0.25 • • ! 35 :: •. o.• 0.37 • • - O.M 50 o.• • ,-. 0.23 85 No• 0.66 30
in.
1 •o34
'0.18
o.• o:• •o0.•
0.62
o. z6 __a•9 so 0.21 0.29 0.17 0.2• 60o.•
o.• 6s
0.12 0.17 70 o.• • o.•9Figure 5. Polarization diagram corresponding to a time
domain extension of the particle motion for Jade/Opale and Rubis explosion and for the N0 ø and N100 ø cross-sections. The relative amplitudes of the displacement modulus are written to the fight side of each column
sine of this angle is equal to the wave velocity ratio fit / c• of
the propagation model. Thus, this angle confirms that the
origin of the corresponding phase is a P surface wave to S
conversion as previously assumed. The polarization diagram
also shows that this phase vanishes with near-vertical take- of[ angles. This is well illustrated for the western azimuth
of the Jade/Opale N100 ø column (Fig. 5).
A defocusing area appears for the Jade/Opale N0 ø con-
figuration between 35 ø and 40 ø and mainly concerns the pS
phase. In comparison to the eastern azimuths, both the P
and S diffracted fields are enhanced in the western azimuth
for the Jade/Opale N100 ø cross-section. A focusing of the
pS wave appears eastward for a 45 ø take-off angle.
The global relative amplification of the northward dif-
fracted p P phase and the global increase in time duration of
the southward diffracted pP phase for the Rubis N0 ø cross- section is not related to any special feature of the pS wave. On one hand, no special behaviour can be observed con-
cerning the pP phase for the Rubis N100 ø configuration. On the other hand, an amplification of the pS wave appears for a 45 ø westward take-off angle. This may be related to the combination of the P,•! Ss and pS phases. This phase com-
bination enhancement appears to be the main mechanism to
explain
the amplification
of the S field for all configurations
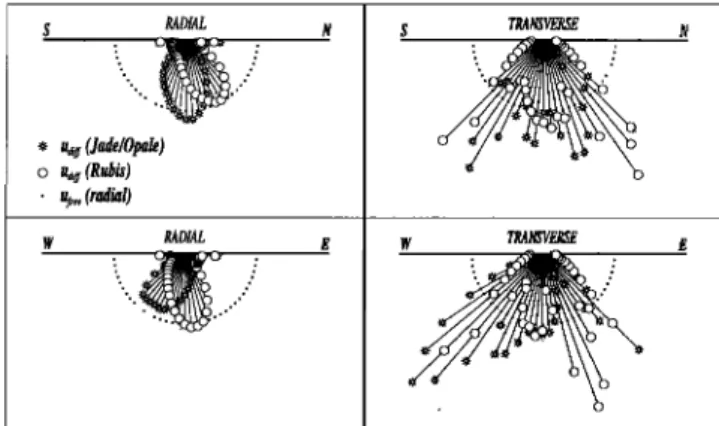
at take-off angles around 45 ø . Finally we may note that the surface Rayleigh wave appears behind the pS phase at grazing take-off angles (close to 90ø).Fig. 6 summarizes the amplification or deamplification behaviours described previously and compares the maxi- mum amplitude of the radial and transverse components
(left and right sides
respectively)
for the Jade/Opale
and
Rubis explosions at N0 ø and N100 ø cross-sections as a func-
tion of the take-off angle. The length of each ray is re-
3316 GAFFET ET AL' FAR-FIELD SEISMOGRAMS RADIAL (Jade/Opale) (Rubis) •r• (rarlial) W RADIAL E S TRANSVERSE N W TRANSVERSE
Figure 6. Maximum amplitude for the radial and trans-
verse components for Jade/Opale and Rubis explosions at
N0 ø and N100 ø cross-sections as a function of the take-off
angle. Black dots correspond to the radial displacement of
the source in a infinite homogeneous space (•7fr**, eq. 1).
White stars and circles correspond to the field diffracted by
the topography for Jade/Opale and Rubis explosions respec-
tively (ffai#, eq. 1)
and transverse seismograms. The main observation concerns
the regular variation of the maximum amplitude of the ra-
dial component in comparison to the great variability of the
transverse maximum amplitudes with take-off angle. The
regularity of the former is directly related to the pP phase
that mainly shapes the radial seismograms without inter-
ferences with the Ps•,rfS phases, while strong interferences
occurs between Ps•,•! $ and pS branches for the transversal
component at specific take-off angles that depend on the explosion configurations.
Conclusion
Using numerical discrete wavenumber- indirect bound- ary integral simulations, we describe the elastic field diffrac-
ted by a mountain heterogeneity towards far-field distances.
The influence of the heterogeneous topography on the clas-
sical pP and pS wave shapes may be summarized as defo-
cusing
and amplification
effects.
These
effects
are clearly
re-
lated to the reflection
coefficient
of the incident
free
p wave-
field on the massif
surface.
Specific
phases
that correspond
to P surface wave to $ conversion are shown. The corre-
sponding branches vanish for near-vertical incidences. Back-
scattering
inside
the mountain
may generate
secondary
pP
branches
that enhance
the coda
of the main
pP wave.
A spe-
cific amplification process is shown which results from the
combination of the P surface to $ wave conversion and of the
pS waves. The related amplification occurs when simultane- cusly the P,•,•IS and pS polarizations become similar and
when the corresponding
P,•,•IS and pS branches
intersect.
Finally,
the teleseismic
pP-waves
with take-off
angles
of less
than 20 ø show amplitude variability of about a factor of 2
due to different locations within the mountain and take-off
angles. Likewise, the variations in pS are about a factor of 2 to 3. The predicted teleseismic pP variations are thus con-
sistent with those predicted by McLaughlin and Jih, small
1988 using another numerical simulation method.
Acknowledgments. This work was supported by the Labo-
ratoire de D6tection et de G6ophysique of the French Com-
missariat
• l'}•nergie
Atomique.
Numerical
calculation
were
performed with the CRAY computers of the French Institutdu Ddveloppement et des Ressources en Informatique Sci-
entifiques (IDRIS/CNRS). We are grateful to the reviewers
for their fruitful comments on the manuscript. Publication
of the UMR CNRS 6526- Gdosciences Azurn ø 145.
References
Bouchon, M., teleseismic body wave radiation from a seismic
source in a layered medium, Geophys. J. R. astr., 47, 515-
530, 1976.
Bouchon,
M., the importance
of the surface
or interface
p
wave in near-earthquake studies, Bull. Seisin. Soc. Am.,68, 1293-1311, 1978.
Boullier,
A.-M., and Bertrand,
J.-M., tectonique
tangentielle
profonde et couloirs mylonitiques dans le hoggar centralpolycyclique
(alg•rie), Bull. Soc. g4ol. France,
33, 17-22,
1981.
Duclaux, F., and Michaud, L., conditions
experimentales
des firs nuc16aires souterrains fran•ais, 1961-1966, C. R. Acad. Sc. Paris, 270, 189-192, 1970.Faure, J., recherche
sur les effets
g6ologiques
d'explosions
nucl•aires
souteraines
dans
un massif
de granite
saharien,
CEA Report, CEA-R-4257, 1-273, 1972.
Gaffer, S., and Bouchon, M., effects of two-dimensional to- pographies using the discrete wavenumber- boundary in- tegral equation method in p-sv cases, J. Acoust. Soc. Am.,
85, 2277-2283, 1989.
Gaffer,
S., Massinon,
B., Planter,
J.-L., and Cansi,
Y., mod-
elling local seismograms of french nuclear tests in taourirt
tan afella massif, hoggar, algeria, Geophys. J. Int., 119,
964-974, 1994.
Gaffer,
S., teleseismic
waveform
modeling
including
geomet-
rical effects of superficial geological structures near to seis- mic sources, Bull. Seisin. Soc. Am., 85, 1068-1079, 1995.Lapwood, E., the disturbance due to a line source in a semi-
infinite elastic medium, Phil. Trans. Roy. Soc. London
Set., A242, 63-100, 1949.
McLaughlin,
K., and Jih, R.-S., scaterring
from near-source
topography: teleseismic observations and numerical sim-
ulations, Bull Seisin. Soc. Am., 78, 1399-1414, 1988.
Munier,
G., construction
d'un modale
de crofite
sous
le hog-
gar central, CEA Report, CEA/LDG 53-82, 1-125, 1982.
Rocard,
Y., formation
du signal
sdismique
lors d'une
explo-
sion souterraine,
C. R. Acad.
Sc. Paris, 258, 2373-2375,
1964.
S. Gaffer,
UMR G•osciences
Azur 6526, 250 rue Albert
Einstein,
F-06560
Valbonne
([email protected])
B. Massinon,
CEA/LDG, BP 12, F-91680
Bruy;•res-le-
Chatel
(Received January 6, 1997; revised September 18, 1997;