Apparent sound insulation in cold-formed steel-framed buildings
Texte intégral
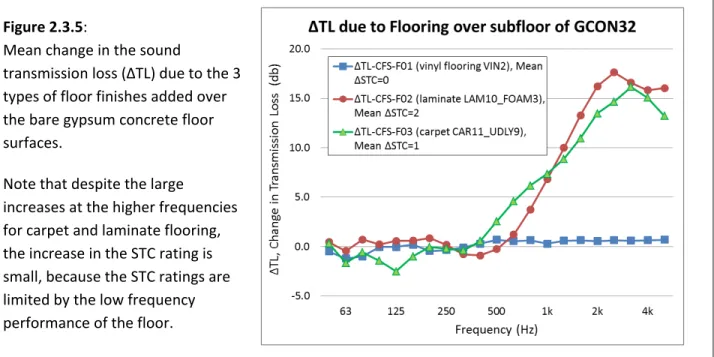
Figure
Documents relatifs
The Colônia Deep Drilling Project held its first International Continental Scientific Drilling Program (ICDP) workshop in September 2014 at the University of São Paulo
Figure 11 : IFT hors biocontrôle et biocontrôle des prototypes IPM-50% et InnoBio par rapport à la référence viticulteur (Moyenne et écart-type standard des IFT hors biocontrôle
The accounting practice of today is simply one method by which double entry..
The inset shows the diffusion coef ficient of the probe molecule (i.e., a molecule 3 beads long), representing silver neodecanoate as a function of the crosslinker spacer length in
In this thesis, we derive full theoretical expressions for the moments of the matched filtered scattered field due to volume inhomogeneities in an ocean waveguide
A.Hartani, le pouvoir présidentiel dans la constitution du 28 novembre 1996,thèse de doctorat d’état en droit public, université d’Alger, faculté de
On June 21, 1793, as Mackenzie was approaching, for the first time, the place that would later be named Alexandria in his honor, he was told by native people about their
The prescription dose could then divided by this dose rate to determine the neutron fluence, or effective irradiation time, delivered from beam one, although it is actually
