HAL Id: halshs-01100836
https://halshs.archives-ouvertes.fr/halshs-01100836
Preprint submitted on 7 Jan 2015HAL is a multi-disciplinary open access
archive for the deposit and dissemination of sci-entific research documents, whether they are pub-lished or not. The documents may come from teaching and research institutions in France or abroad, or from public or private research centers.
L’archive ouverte pluridisciplinaire HAL, est destinée au dépôt et à la diffusion de documents scientifiques de niveau recherche, publiés ou non, émanant des établissements d’enseignement et de recherche français ou étrangers, des laboratoires publics ou privés.
Primary Education
Douzounet Mallaye, Urbain Thierry Yogo
To cite this version:
Douzounet Mallaye, Urbain Thierry Yogo. How Aid Helps Achieving MDGs in Africa: the Case of Primary Education. 2015. �halshs-01100836�
C E N T R E D'E T U D E S E T D E R E C H E R C H E S S U R L E D E V E L O P P E M E N T I N T E R N A T I O N A L
SERIE ETUDES ET DOCUMENTS
How Aid Helps Achieving MDGs in Africa:
the Case of Primary Education
Thierry Urbain Yogo
Douzounet Mallaye
Etudes et Documents n° 01
January 2015To cite this document:
Yogo T.U., Mallaye D. (2015) “How Aid Helps Achieving MDGs in Africa: the Case of Primary Education”, Etudes et Documents, n°01, CERDI.
http://cerdi.org/production/show/id/1643/type_production_id/1
CERDI
65 BD. F. MITTERRAND
63000 CLERMONT FERRAND – FRANCE TEL.+33473177400
FAX +33473177428
2
The authors
Thierry Urbain Yogo
Post-doctoral research fellow and Associate researcher
Clermont Université, Université d'Auvergne, CNRS, UMR 6587, CERDI, F-63009 Clermont Fd Centre d’Etudes et de Recherches en Economie et Gestion - University of Yaoundé 2
Email: urbain_thierry.yogo@udamail.fr ; yogout@gmail.com Douzounet Mallaye
Senior lecturer
University of N’Djamena, Chad Email: douzounetmallaye@yahoo.fr
Corresponding author: Thierry Urbain Yogo
Etudes et Documents are available online at: http://www.cerdi.org/ed
Director of Publication: Vianney Dequiedt Editor: Catherine Araujo Bonjean
Publisher: Chantal Brige-Ukpong ISSN: 2114 - 7957
Disclaimer:
Etudes et Documents is a working papers series. Working Papers are not refereed, they
constitute research in progress. Responsibility for the contents and opinions expressed in the working papers rests solely with the authors. Comments and suggestions are welcome and should be addressed to the authors.
3
Abstract
Since 2000, Official Development Assistance has played a crucial role in efforts related to the achievement of MDGs. This is especially the case in Sub-Saharan Africa (SSA) which is the world’s largest recipient of foreign aid. This paper assesses the effectiveness of aid and its efficient use in achieving universal primary education in Sub-Saharan Africa. The impact of aid is assessed for a sample of 35 SSA countries over the decade 2000-2010. The results suggest that higher aid to education significantly increases primary completion rate. This result is robust to the use of various methods of estimation, the inclusion of instrument to account for the endogeneity of aid and the set of control variables included in regressions. In addition, this paper shows that there is strong heterogeneity in the efficient use of aid across countries in SSA.
Key words: Official Development Assistance, Primary Education, Sub-Saharan Africa JEL codes: F35, O11, H55, I22
Acknowledgment
The authors thank Rainer Thiele and Anke Hoeffler for their useful comments and suggestions in the early version of this paper, and Christian Ebeke to have kindly provided data on instruments.
4
1. Introduction
At the millennium summit in September 2000, World leaders adopted the United Nations Millennium Declaration, committing their nations to reduce extreme poverty through a set of quantified targets, with a deadline of 2015. Out of the eight Millennium Development Goals (MDGs), the second is to achieve universal primary education by 2015. This is to ensure that children around the world will be able to complete a full course of primary schooling. Since 2000, Official Development Assistance has played a crucial role in efforts related to the achievement of MDGs. This is especially the case in Sub-Saharan Africa (SSA) which is the world’s largest recipient of foreign aid. This paper assesses the effectiveness of aid and its efficient use in achieving universal primary education in Sub-Saharan Africa over the decade 2000-2010.
Official Development Assistance (ODA) has dramatically increased from $ 73.1 billion in the mid-1990s to $ 118 billion in 2012 (OECD, 2014)1. In the specific case of SSA, ODA increased from $ 27.4 billion in 2004 to $ 42.7 billion in 2013. In the same line, the adjusted net enrolment rate in primary education increased by 18 percentage points between 2000 and 2012 (UN, 2014). Despite this major improvement, only three out of five pupils were able to complete primary school (UN, 2014). Since high dropout rates are a major impediment to universal primary education, this latter fact raises the question of the effectiveness of aid in general and aid to education in particular. We address this question by analysing panel data from 35 SSA countries over the period 2000-20102.
The objective of this paper is twofold. First, we assess the effectiveness of aid in the achievement of universal primary education in SSA. Unlike the existing literature3, our measure of education is the primary completion rate instead of the school enrolment rate. Considering the high level of dropout in SSA, the former measure seems to be more appropriate. Second, we consider the efficient use of aid to education by resorting to Data Envelopment Analysis.
For the empirical test, we first check the robustness of the expected correlation between aid and education to various panel data estimators including fixed effect, random effect, two-way fixed effect, feasible GLS. Afterward, this paper deals with the issue of the endogeneity of aid by
1 The comparison is made in 2011 US $.
2 Note that the choice of the period is dictated by (1) data availability: data are not available after 2011 for almost all
the countries in the sample. (2) Aid to education has steadily risen since 2000 with a peak in 2010, and then declined by 7% between 2010 and 2011. We do not want our estimates to be affected by this sudden decline.
5
resorting to an instrumental variable approach. We take advantage of the migration literature by using the GDP per capita of the host country as a source of exogenous variation for foreign aid (Combes & Ebeke, 2011; Combes et al, 2014; Bermeo & Leblang, 2014)4. Specifically, Aid is instrumented by the log of GDP per capita in migrant destination countries weighted by the bilateral migration share. As shown by Bermeo & Leblang (2014), the size of the immigrant population from a recipient country residing in a donor country is an important determinant of dyadic aid commitments. In fact, the donors can use aid to develop the sending countries and reduce the flows of immigrants. Besides, migrants already residing in the donor countries can mobilize to lobby for additional aid in their home countries. In addition this paper contributes to the existing literature by providing an evaluation of the efficiency in the use of foreign aid to education. For this end, we compute specific efficiency score by country using data envelopment analysis and we define their potential predictors by using a Tobit model.
The rest of the paper is as follows: Section 2 gives a summary of the previous studies. The econometric model and data are described in Section 3. Section 4 discusses the results on aid effectiveness. Section 5 is about the efficiency of aid to education. Then section 6 concludes.
2. Summary of the previous studies
The literature on the effect of aid to education remains very scarce especially when education is used as outcome of interest. In this section, we review the most recent papers that have addressed the effect of aid either on school enrolment or on primary completion rate.
The pioneer paper of Michaelowa and Weber (2007) analyzes the effect of aid to education on rate of achievement in school enrolments at the primary, secondary and tertiary education. Using various estimators (OLS, GMM & 2SLS) over the period 1975-2004, they found small positive correlations between education aid and school enrolments. Dreher et al (2008) use total aid commitment to education to explain the net primary enrolment rate in developing countries over the period 1970-2004. Using the General Method of Moment (GMM) on a dynamic specification, they find that higher per capita aid significantly increase primary school enrolment rate. In contrast to other studies, they find no evidence that aid work by increasing government spending on education. Likewise, D’Aiglepierre and Wagner (2010) use data on aid commitment over the
4
Note that the first two studies use this instrument as a source of exogenous variation of remittances. The third one shows that migration is a robust predictor of foreign aid. To the best of our knowledge, this is the first attempt of using this variable as an instrument for Aid.
6
period 1999-2007 and find a strong positive effect of aid to primary education on school enrolment rate and gender parity. They also find a negative effect on repetition rate. This positive effect is confirmed by the recent papers of Christensen et al (2011) and Riddell (2012).
Overall the above papers indicate a positive relationship between aid and human capital. However, they do not address the specificity of sub-Saharan African countries. Moreover, most of the studies use school enrolment rate as the dependent variable which may not be appropriate in case of high rate of dropout in primary education. Our study tries to address this gap in the literature.
3. Econometric model and data
Following Aiglepierre and Wagner (2010), Michaelowa and Weber (2007), our baseline specification is as follows:
𝑝𝑐𝑟𝑖𝑡 = 𝛾0+ 𝛾1𝐴𝑖𝑑𝑒𝑑𝑢𝑖𝑡+ 𝑋𝑖𝑡′𝛽 + 𝜇
𝑖+ 𝜀𝑖𝑡 (1)
In the specification (1) 𝑝𝑐𝑟𝑖𝑡 is the logarithm of the primary completion rate for country 𝑖 at time
𝑡. It measures the percentage of pupils completing the last year of primary education. This indicator has been chosen for two main reasons. First, choosing primary education instead of the other levels of education is consistent with the second target of Millenium Development Goals (MDGs) which is achieving universal primary education by 2015. Second, unlike the school enrolment rate which is commonly used in the literature, this measure takes into account those who dropped out of school before the end of the primary level. In fact school enrolment rate could be misleading, especially in cases where we face a high dropout of school rate. In addition, as suggested by Clement (2004) rising enrollment rate came at the cost of deteriorating quality of education. As pointed out by (Dreher et al, 2008), aid can have a little effect on primary completion rate in recipient countries with a completion rate close to 100%. Following Fielding et al (2005), we deal with this problem by using a Logit transformation of our dependent variable5. Our interest variable is 𝐴𝑖𝑑𝑒𝑑𝑢 and represents the total aid disbursement for education in percentage of GDP. It captures the aid disbursement for primary education, basic life skills for youths and adults and early childhood education. We use this measure in our baseline model
5
However since it may bias the estimates downward and does not qualitatively affect the results, we report this result only as robustness check (see Table A2 in appendix).
7
because we assume that aid is not fungible and it is more likely that the amount of aid which is devoted to primary education might be used for other education purposes. In this baseline regression, we always compare multisector aid and sector specific aid. In fact donors may have supported educational projects through aid that is not picked up in sector specific data. For robustness check, we also make use of aid to primary education. In the aid literature, aid is often defined relative to the GDP of the recipient country. However, aid per capita help accounting for the number of people among whom the resources devoted to education must be shared (Dreher et al, 2008). In this vein, we further use aid per capita in specifications as robustness check.
Data are drawn from the African Development Indicators (2012). Explanatory variables include saving in percentage of GDP, foreign direct investment, teacher-pupil ratio, GDP per capita, governance measured by the control of corruption and governance effectiveness, and democracy captured by the polity IV index6. One could also include public spending in education. However, it is likely that a huge part of spending in education is funded by aid allocated to education. Moreover, using spending on education would lead to insufficient number of observation for estimation7. Nevertheless, we control for the spending effect using the GDP per capita. While including governance and democracy, we control for potential mismanagement of foreign aid and institutional quality. In the same vein, we add the teacher-pupil ratio to control for the potential effect of the class size on the primary completion rate. In fact, a low number of teachers per pupils may discourage people to attend school, therefore lower the primary completion rate. Saving enters the model to control for the fact that aid could be more effective in context where saving is very low. Data on governance are taken from the World Governance Indicators of the World Bank. The polity IV variable comes from the polity project of Center for systematic Peace. The rest of the control variables are from the World Development Indicator of the World Bank. Data are collected for 35 Sub-Saharan African countries over the period 2000-20108. Table A.1 (in Appendix) provides the descriptive statistics of the variables used in regression.
6 It is worth mentioning that teacher-pupil ratio and governance measures are not included in the baseline model, but
as additional controls in robustness checks.
7 Note that previous studies including Dreher et al (2008) did not find any effect of public spending on education. 8 The list of countries is presented in Appendix.
8
4. Assessing the effectiveness of foreign aid
4.1. Preliminar evidences on aid effectiveness
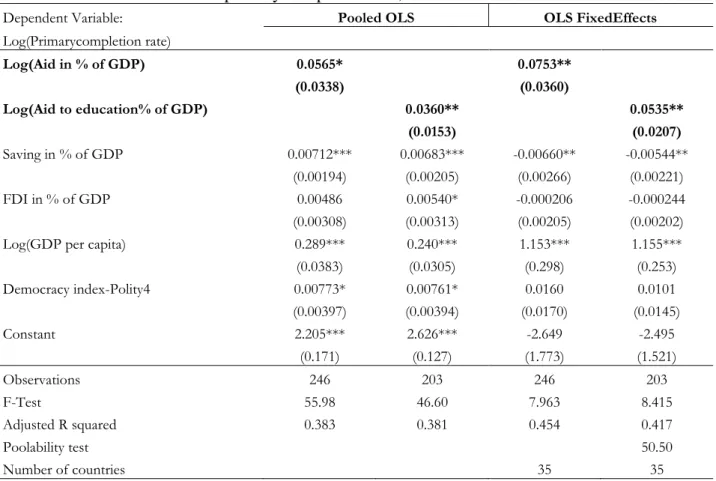
We start this empirical investigation by contrasting the results from various panel data estimators. Table 1 provides the results from two estimation methods, namely pooled OLS (Columns 2 & 3) and FE estimator (columns 4 & 5).
Table 1: Aid to education and primary completion rate, OLS estimates
Dependent Variable: Pooled OLS OLS FixedEffects
Log(Primarycompletion rate) Log(Aid in % of GDP) 0.0565* 0.0753** (0.0338) (0.0360) Log(Aid to education% of GDP) 0.0360** 0.0535** (0.0153) (0.0207) Saving in % of GDP 0.00712*** 0.00683*** -0.00660** -0.00544** (0.00194) (0.00205) (0.00266) (0.00221) FDI in % of GDP 0.00486 0.00540* -0.000206 -0.000244 (0.00308) (0.00313) (0.00205) (0.00202) Log(GDP per capita) 0.289*** 0.240*** 1.153*** 1.155*** (0.0383) (0.0305) (0.298) (0.253) Democracy index-Polity4 0.00773* 0.00761* 0.0160 0.0101 (0.00397) (0.00394) (0.0170) (0.0145) Constant 2.205*** 2.626*** -2.649 -2.495 (0.171) (0.127) (1.773) (1.521) Observations 246 203 246 203 F-Test 55.98 46.60 7.963 8.415 Adjusted R squared 0.383 0.381 0.454 0.417 Poolability test 50.50 Number of countries 35 35
Note: Robust standard errors are in parentheses*** p<0.01, ** p<0.05, * p<0.1
The next to last row reports the results of poolability test based on the Fisher distribution. The null hypothesis that data can be pooled is rejected at the 1% level. For each of these estimators, we always compare the respective effects of the total amount of aid and aid to education. In the two models, aid positively affects the primary completion rate. However, in both cases, the magnitude of the multi-sector aid effect is higher than that of aid to education. We interpret this finding as a proof of the fungibility of global aid and the existence of spillover effects from other sectors such as health sector. Similar results are obtained when we use random effect estimates, feasible GLS and two-way fixed effects. However, it is worth mentioning that in the latter case, the global aid is no longer significant.
9
Table 2: Aid to education and primary completion rate, TFE, RE and FGLS
Dependent Variable: Twowayfixedeffect Randomeffectestimator Feasible GLS
Log(Primarycompletion rate) Log(Aid in % of GDP) 0.0148 0.119*** 0.0313* (0.0178) (0.0359) (0.0168) Log(Aid to education% of GDP) 0.0397*** 0.0680*** 0.0219*** (0.0148) (0.0183) (0.00787) Saving in % of GDP -0.00629*** -0.00483** -0.00495* -0.00330 0.000137 0.00108 (0.00175) (0.00199) (0.00293) (0.00234) (0.00116) (0.00130) FDI in % of GDP -0.00278 -0.00378 -0.000443 -0.00159 0.000285 -0.00226 (0.00217) (0.00251) (0.00229) (0.00160) (0.00177) (0.00198) Log(GDP per capita) 0.393** 0.191 0.609*** 0.493*** 0.290*** 0.244*** (0.166) (0.186) (0.126) (0.0975) (0.0289) (0.0233) Democracy index-Polity4 -0.00366 -0.00377 0.0214** 0.0192** 0.0124*** 0.0134*** (0.00914) (0.00959) (0.00954) (0.00758) (0.00363) (0.00308) Constant 0.354 -0.377*** (0.616) (0.112) Constant 1.185 3.624*** 0.646 1.490*** 2.277*** 2.657*** (1.380) (0.972) (0.710) (0.544) (0.155) (0.120) Observations 246 203 246 203 245 202 Adjusted R squared 0.902 0.913 0.345 0.346 Test of the OID restriction fixed versus random 41.97
Wald Chi2(5) 163.27 224.20
Number of countries 35 35 35 35 34 34
Note: Robust standard errors in parentheses*** p<0.01, ** p<0.05, * p<0.1
4.2. Instrumental variable estimates
Estimating equation (1) with OLS leads to inconsistent estimates if foreign aid is correlated with an unobserved component that may potentially explain the primary completion rate. For instance, it could happen that countries with poor education performance receive more aid. In this case, the effect of aid will be underestimated. To address this issue, we use an instrumental variable approach which relies on the choice of exogenous instrument for aid. The novelty of our approach is to test an instrumental variable which has not yet been used in the aid literature, but which is currently used to infer the causal effect of remittances. Specifically, the instrument tested is the GDP per capita of migrant’s host countries weighted by the share of bilateral migrations (Ebeke & Combes, 2011; Combes et al, 2014). The instrument is computed as follows:
𝑔𝑑𝑝𝑖𝑡∗ = ∑ 𝑔𝑑𝑝
𝑗𝑡× 𝜔𝑖𝑗𝜏
10
In equation (2), 𝑔𝑑𝑝𝑖𝑡∗ represents the real GDP per capita of the destination country 𝑗, and 𝜔𝑖𝑗𝜏 the bilateral migration share measured as the number of migrants of country 𝑖 living in country 𝑗 divided by the number of migrants from country 𝑖 living abroad during each decade 𝜏. Data on this instrument are drawn from Combes et al (2014)9.
While this instrument has never been used as an exogenous source of variation for aid, several arguments may justify this choice. First, our instrument assumes that the conjuncture in donor’s countries is very much correlated with the amount of aid. As shown by Fuchs et al (2013), aid decreases when macroeconomic conditions deteriorate in donor countries. Second, the literature often uses geographical and cultural distance between donors and recipients as instrumental variable to assess the causal effect of aid (Tavarez, 2003; Rajan & Subramanian, 2008). Since migrants are more likely to move to the country with which they share historical and cultural links, our instrumentation strategy is consistent with the existing literature. Moreover, as shown by Bermeo and Leblang (2014), it is likely that the size of immigrant population from a recipient country, residing in a donor country is a powerful determinant of aid commitment. They argue that donors use foreign aid to increase development in targeted sending area and decrease the demand for entry into donor countries. In the same line, migrants already residing in donor countries mobilize to lobby for additional aid to their homeland.
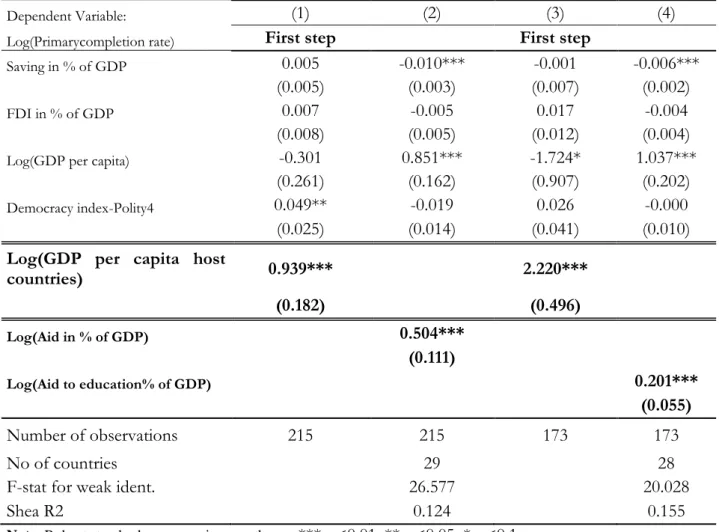
The results of the IV regressions are presented in Table 3. The first and third columns report the first stage estimates and show that our instrument is strongly and positively associated with both measures of foreign aid. The instruments are significant at the 1% level in the first stage regression. Furthermore, the F-test statistic is always above the rule of Thumb of 10 proposed by Staiger and Stock (1997). Turning to the results, Table 3 points to a positive and significant effect of aid on education at 1% level. Specifically a 1% increase of aid to education leads to 0.20% increase of the primary completion rate. However, as seen in the simple OLS estimation, the magnitude of global aid’s effect is much higher. Our findings are consistent with the previous studies which use school enrolment as dependent variable (see Dreher et al, 2008; Christensen et al, 2011).
11
Table 3: Aid to education and primary completion rate, 2SLS estimates
Dependent Variable: (1) (2) (3) (4) Log(Primarycompletion rate) First step First step
Saving in % of GDP 0.005 -0.010*** -0.001 -0.006***
(0.005) (0.003) (0.007) (0.002)
FDI in % of GDP 0.007 -0.005 0.017 -0.004
(0.008) (0.005) (0.012) (0.004)
Log(GDP per capita) -0.301 0.851*** -1.724* 1.037***
(0.261) (0.162) (0.907) (0.202)
Democracy index-Polity4 0.049** -0.019 0.026 -0.000
(0.025) (0.014) (0.041) (0.010)
Log(GDP per capita host
countries) 0.939*** 2.220*** (0.182) (0.496) Log(Aid in % of GDP) 0.504*** (0.111) Log(Aid to education% of GDP) 0.201*** (0.055) Number of observations 215 215 173 173 No of countries 29 28
F-stat for weak ident. 26.577 20.028
Shea R2 0.124 0.155
Note: Robust standard errors are in parentheses. *** p<0.01, ** p<0.05, * p<0.1
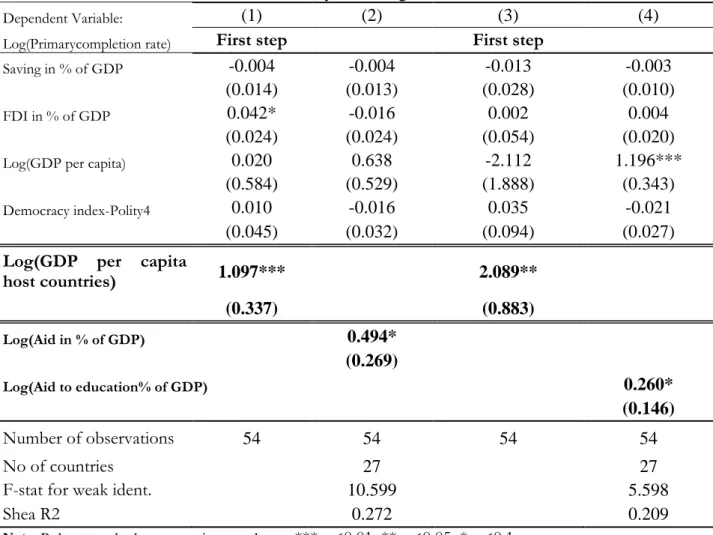
In order to check for the robustness of the results, we carried out various tests. First, although the time dimension is small compared to the individual dimension in our model, we run a new regression using data averaged over 5 years. This is to ensure that the previous results are not driven by business cycle effects and measurement errors.
The estimates are reported in Table 4. The effect of aid remains significant at 10% level. The magnitude of the effect of education aid slightly increases while the one of global aid decreases in the same way.
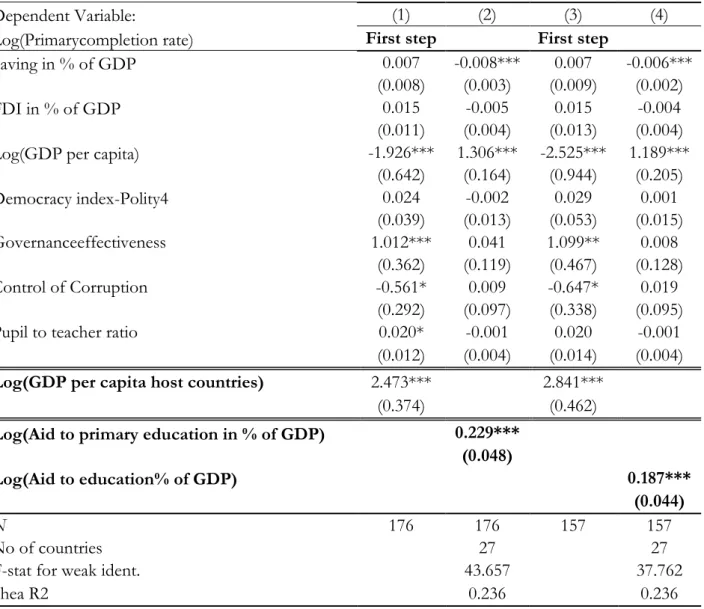
Second, we add more controls into the model including governance and the pupil to teacher ratio. In addition, we include as independent variable aid to primary education. The effect of aid is still significant at the 1% level, but the magnitude substantially decreases. One notable fact is that the effect of aid to primary education is higher than the one of total education aid. Table 5 shows that a one percent increase of aid to primary education induces 0.22% rise of primary completion rate. Finally, we run a regression using aid in per capita. The results are reported in Table 6 and suggest a strong positive effect of aid on primary education.
12
Table 4: Robustness Check, 2SLS with five year average data
Dependent Variable: (1) (2) (3) (4)
Log(Primarycompletion rate) First step First step
Saving in % of GDP -0.004 -0.004 -0.013 -0.003
(0.014) (0.013) (0.028) (0.010)
FDI in % of GDP 0.042* -0.016 0.002 0.004
(0.024) (0.024) (0.054) (0.020)
Log(GDP per capita) 0.020 0.638 -2.112 1.196***
(0.584) (0.529) (1.888) (0.343)
Democracy index-Polity4 0.010 -0.016 0.035 -0.021
(0.045) (0.032) (0.094) (0.027)
Log(GDP per capita
host countries) 1.097*** 2.089** (0.337) (0.883) Log(Aid in % of GDP) 0.494* (0.269) Log(Aid to education% of GDP) 0.260* (0.146) Number of observations 54 54 54 54 No of countries 27 27
F-stat for weak ident. 10.599 5.598
Shea R2 0.272 0.209
Note: Robust standard errors are in parentheses. *** p<0.01, ** p<0.05, * p<0.1.
Overall, both OLS and IV estimates suggest a positive and significant effect of aid to education on the primary completion rate. This effect is robust to various specifications and measures of aid. Furthermore, the strength of the correlation between the instrument and the interest variable remains robust across specifications.
13
Table 5: Robustness check, 2SLS with additional controls
Dependent Variable: (1) (2) (3) (4)
Log(Primarycompletion rate) First step First step
Saving in % of GDP 0.007 -0.008*** 0.007 -0.006***
(0.008) (0.003) (0.009) (0.002)
FDI in % of GDP 0.015 -0.005 0.015 -0.004
(0.011) (0.004) (0.013) (0.004) Log(GDP per capita) -1.926*** 1.306*** -2.525*** 1.189***
(0.642) (0.164) (0.944) (0.205) Democracy index-Polity4 0.024 -0.002 0.029 0.001 (0.039) (0.013) (0.053) (0.015) Governanceeffectiveness 1.012*** 0.041 1.099** 0.008 (0.362) (0.119) (0.467) (0.128) Control of Corruption -0.561* 0.009 -0.647* 0.019 (0.292) (0.097) (0.338) (0.095)
Pupil to teacher ratio 0.020* -0.001 0.020 -0.001
(0.012) (0.004) (0.014) (0.004)
Log(GDP per capita host countries) 2.473*** 2.841***
(0.374) (0.462)
Log(Aid to primary education in % of GDP) 0.229*** (0.048)
Log(Aid to education% of GDP) 0.187***
(0.044)
N 176 176 157 157
No of countries 27 27
F-stat for weak ident. 43.657 37.762
Shea R2 0.236 0.236
14
Table 6: Robustness check, 2SLS with aid per capita
Dependent Variable: (1) (2) (3) (4)
Log(Primarycompletion rate) First step First step
Saving in % of GDP -0.000 -0.006*** 0.000 -0.007***
(0.007) (0.002) (0.006) (0.002)
FDI in % of GDP 0.017 -0.004 0.013 -0.005
(0.012) (0.004) (0.010) (0.004)
Log(GDP per capita) -0.742 0.841*** -0.275 0.854***
(0.906) (0.223) (0.598) (0.219)
Democracy index-Polity4 0.026 -0.000 0.042 -0.008
(0.041) (0.010) (0.032) (0.012)
Log(GDP per capita host countries) 2.211*** 1.441***
(0.495) (0.339)
Log(Aid to education per capita) 0.202*** (0.055)
Log(Aid to primary education per capita) 0.321***
(0.088)
N 173 173 218 218
No of countries 28 29
F-stat for weak ident. 19.977 18.030
Shea R2 0.154 0.099
Note: Robust standard errors are in parentheses. *** p<0.01, ** p<0.05, * p<0.1.
5. Assessing the efficiency of foreign aid
The main objective of this section is to assess how efficient is the use of foreign aid in Sub-Saharan Africa countries. To this end, we resort to the Data Envelop Analysis (DEA) which is a non-parametric technique aiming at measuring the efficiency of Decision-Making-Units. Three main reasons justify this choice. First, using DEA avoid making strong assumptions on the functional form or on the distribution of the inefficiency terms. Second, with the DEA method, we explicitly account for the nature of the return to scale. Finally, the DEA technique has been extensively used in the literature and therefore provides a good starting point of comparison with the existing literature10. We use an input oriented efficiency with variable return scale. That is we are looking for the countries that was able to reach a fixed level of primary completion rate with a
15
minimum amount of aid. Aid to education per capita is used as input while the primary completion rate is the output.11 Data are averaged over the decade 2000-2010.
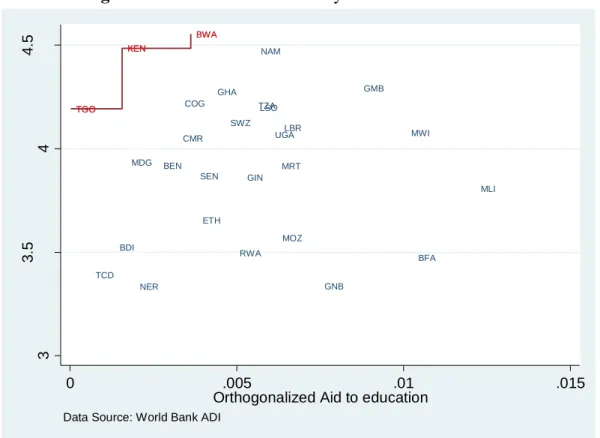
Figure 1 displays the distribution of efficiency scores across Sub-Saharan countries12.
Figure 1: Distribution of efficiency scores across countries
Note: Countries in red are the most efficient countries
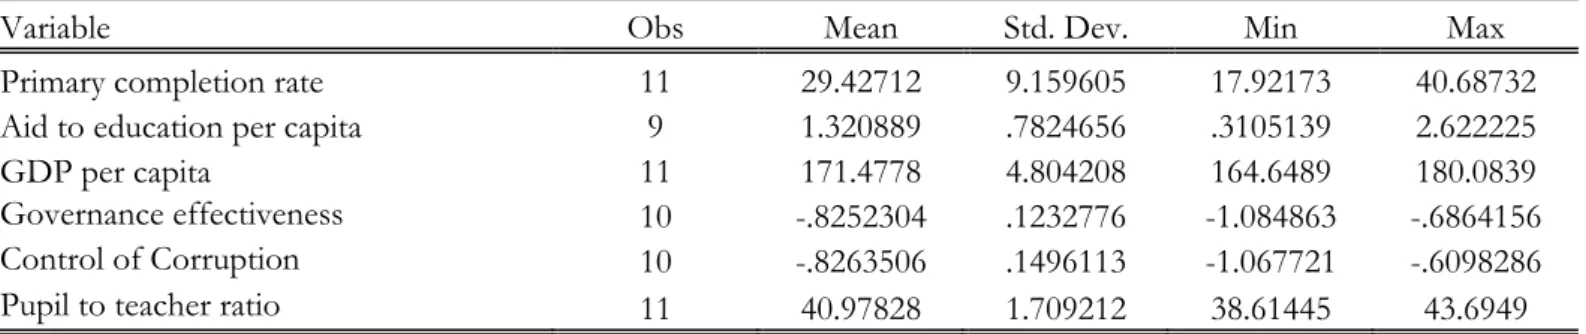
The Figure shows that the efficiency is unevenly distributed across countries. The most efficient countries are Botswana, Kenya and Togo while the less efficient are Rwanda, Burkina Faso and Niger. Understanding the difference between the best performer and the worst requires taking a closer look at the specific characteristics of countries. We specifically compare Botswana which is at the top of the distribution of efficiency scores with Niger which is stuck at the bottom. As we can see in Table A4 & A5, in Botswana, which receive 0.08 USD (2005) per capita of aid, the primary completion stands at 95.04%. This is far higher than 29.42% which is observed in Niger which received over the decade 1.2 USD per capita of aid. Likewise, the GDP per capita13 of Botswana is more than twenty times the one of Niger and the former has better governance.
11
Aid is orthogonalized prior use in the dynamic programing.
12 Table A3 in appendix reports the values of the efficiency scores by country. Note that all the countries reported
belong to the final sample used in IV regression.
13 Within the sample.
BDI BEN BFA BWA CMR COG ETH GHA GIN GMB GNB KEN LBR LSO MDG MLI MOZ MRT MWI NAM NER RWA SEN SWZ TCD TGO TZA UGA TGO KEN BWA 3 3 .5 4 4 .5 Pr ima ry C o mp le ti o n ra te 0 .005 .01 .015
Orthogonalized Aid to education
16
Finally, the number of pupils per teacher is 51 in Niger while it is 26 in Botswana. Although they were not at the same initial level in 200014, all those facts suggest that the level of GDP per capita, the level of governance and the pupil to teacher ratio may have played an important role in explaining the difference between the two countries. In order to have more insight about the potential predictors of efficiency, we run a naïve Tobit model using as controls: the initial level of education measured by the primary completion rate at year 2000, the urban population, the quality of the regulation as a measure of governance, a one zero dummy to capture the potential effects of conflicts, the level of GDP per capita and the initial level of aid to education. We suspect that countries with low initial level of education may lack skilled people to manage aid disbursement efficiently. On contrary, we expect a positive effect of urban population on efficiency. In fact, urban population is more open to the world and more able to adopt new ideas and practices. Since better governance implies efficient use of resources, we expect a positive effect of the quality of regulation. Likewise richer countries have more and better infrastructure that catalyze the effect of aid. Finally, we expect that countries which have experienced recent conflict exhibit low level of efficiency. Table 7 presents the results of the Tobit model.
14 We acknowledge the fact that probably the better way to compare countries is to take quite similar countries which
17
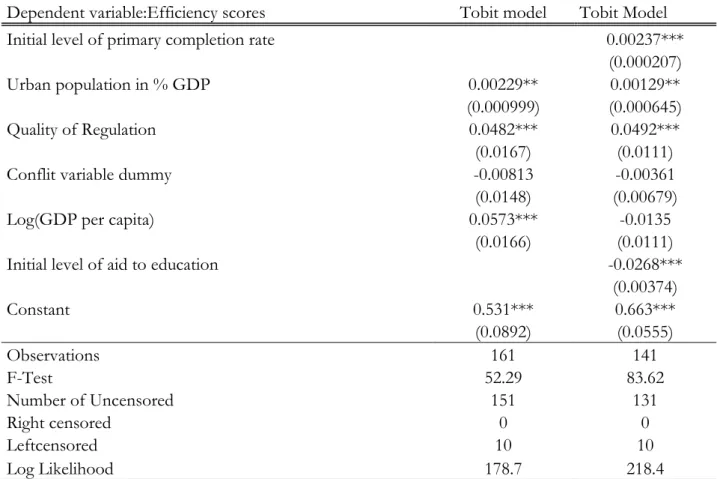
Table 7: Determinants of the efficiency in the use of aid, Tobit model
Dependent variable:Efficiency scores Tobit model Tobit Model
Initial level of primary completion rate 0.00237***
(0.000207)
Urban population in % GDP 0.00229** 0.00129**
(0.000999) (0.000645)
Quality of Regulation 0.0482*** 0.0492***
(0.0167) (0.0111)
Conflit variable dummy -0.00813 -0.00361
(0.0148) (0.00679)
Log(GDP per capita) 0.0573*** -0.0135
(0.0166) (0.0111)
Initial level of aid to education -0.0268***
(0.00374) Constant 0.531*** 0.663*** (0.0892) (0.0555) Observations 161 141 F-Test 52.29 83.62 Number of Uncensored 151 131 Right censored 0 0 Leftcensored 10 10 Log Likelihood 178.7 218.4
Note: Robust standard errors are in parentheses. *** p<0.01, ** p<0.05, * p<0.1.
We adopt two specifications: in the first one the efficiency is positively correlated with the urban population, the quality of the regulation and the level of GDP. In the second specification, we add the initial level of education and the initial level of aid. We find that the efficiency is positively correlated with the initial level of education while it is negatively correlated with aid.
Overall, the empirical analysis suggests that aid to education has a positive and significant effect on the primary completion rate is Sub-Saharan Africa. Moreover, some countries use aid more efficiently than others. Finally, the main drivers of the efficiency are namely the size of urban population, the quality of regulation, the initial level of education and the initial level of aid.
18
6. Conclusion
The issue of aid effectiveness has always been a major concern in the literature of international development. While some studies find no correlation between aid and economic growth, others observe that it has helped to enhance some factors of growth in Africa and that more could be done if aid resources were allocated to pro-poor sectors.
In this paper, we assess the effectiveness of sector specific aid for 35 SSA countries over the period 2000-2010, with the education millennium goal as a target. In addition, we evaluate the efficiency of the use of aid resources within the Data Envelopment Analysis Framework. The results suggest that higher aid to education significantly increases primary completion rate. This result is robust to the use of various methods of estimation, the inclusion of instrument to account for the endogeneity of aid and the set of control variables included in regressions. Besides, this paper shows that there is strong heterogeneity in the efficient use of aid. Especially, countries like Botswana, Togo and Kenya are at the top of the distribution of efficiency scores while Burkina Faso, Niger and Rwanda do not make an efficient use of aid to education. Finally, the paper shows that the efficient use of aid is positively correlated with the size of urban population, the level of development, the quality of governance and the initial level of education.
These results follow the findings of previous studies according to which aid is effective in building human capital in developing countries.
These findings imply that initiatives toward an increase of aid devoted to education should be encouraged. This is especially relevant for SSA whom aid to basic education declined by 7% between 2010 and 2011.
19
Appendix
Table A1: Descriptive statistics
Variable Obs Mean Std. Dev. Min Max
Primary completion rate 157 57.15931 18.6187 19.99717 102.2704
Aid in % of GDP 155 17.15925 21.82607 0.4125504 222.6818
Aid to primary education in % of GDP 157 0.5542791 0.5121493 0.0004156 2.428168
Aid to education% of GDP 157 0.5477999 0.4976255 0.0004156 2.421705
Log(GDP per capita host countries) 157 9.368681 0.9442343 7.478229 10.6151
Saving in % of GDP 157 15.7828 11.77537 -40.215 56.11615 FDI in % of GDP 157 4.889647 6.735664 -4.302265 46.8288 GDP per capita 157 637.0532 825.9532 83.09156 4160.078 Democracy index-Polity4 157 1.872611 5.168601 -9 8 Governance effectiveness 157 -.6230389 0.5100728 -1.773713 0.7272455 Control of Corruption 157 -.509133 0.5127171 -1.430168 1.249669
Pupil to teacher ratio 157 46.18039 12.02089 19.26821 82.79789
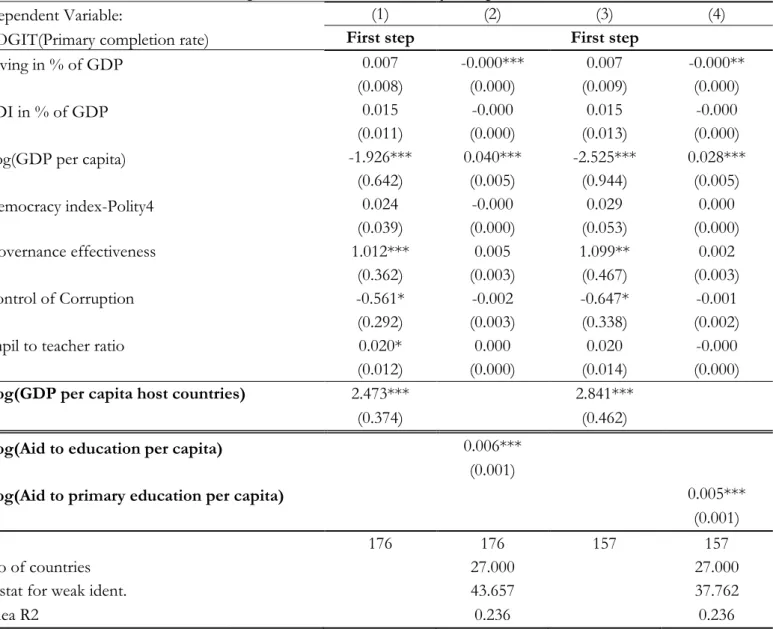
Table A2: Robustness check, with Logit transformation of Primary Completion Rate
Dependent Variable: (1) (2) (3) (4)
LOGIT(Primary completion rate) First step First step
Saving in % of GDP 0.007 -0.000*** 0.007 -0.000**
(0.008) (0.000) (0.009) (0.000)
FDI in % of GDP 0.015 -0.000 0.015 -0.000
(0.011) (0.000) (0.013) (0.000)
Log(GDP per capita) -1.926*** 0.040*** -2.525*** 0.028***
(0.642) (0.005) (0.944) (0.005) Democracy index-Polity4 0.024 -0.000 0.029 0.000 (0.039) (0.000) (0.053) (0.000) Governance effectiveness 1.012*** 0.005 1.099** 0.002 (0.362) (0.003) (0.467) (0.003) Control of Corruption -0.561* -0.002 -0.647* -0.001 (0.292) (0.003) (0.338) (0.002)
Pupil to teacher ratio 0.020* 0.000 0.020 -0.000
(0.012) (0.000) (0.014) (0.000)
Log(GDP per capita host countries) 2.473*** 2.841***
(0.374) (0.462)
Log(Aid to education per capita) 0.006***
(0.001)
Log(Aid to primary education per capita) 0.005***
(0.001)
N 176 176 157 157
No of countries 27.000 27.000
F-stat for weak ident. 43.657 37.762
Shea R2 0.236 0.236
20
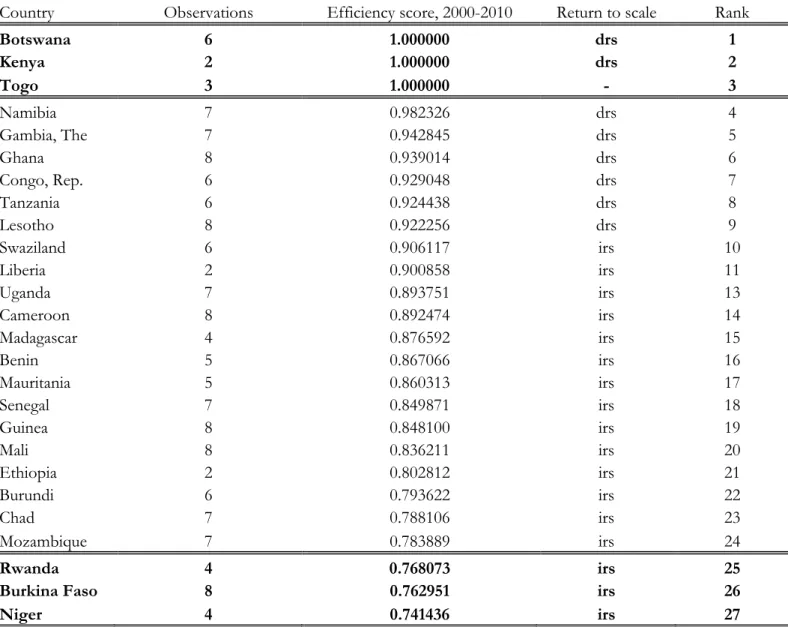
Table A3: Efficiency scores
Country Observations Efficiency score, 2000-2010 Return to scale Rank
Botswana 6 1.000000 drs 1 Kenya 2 1.000000 drs 2 Togo 3 1.000000 - 3 Namibia 7 0.982326 drs 4 Gambia, The 7 0.942845 drs 5 Ghana 8 0.939014 drs 6 Congo, Rep. 6 0.929048 drs 7 Tanzania 6 0.924438 drs 8 Lesotho 8 0.922256 drs 9 Swaziland 6 0.906117 irs 10 Liberia 2 0.900858 irs 11 Uganda 7 0.893751 irs 13 Cameroon 8 0.892474 irs 14 Madagascar 4 0.876592 irs 15 Benin 5 0.867066 irs 16 Mauritania 5 0.860313 irs 17 Senegal 7 0.849871 irs 18 Guinea 8 0.848100 irs 19 Mali 8 0.836211 irs 20 Ethiopia 2 0.802812 irs 21 Burundi 6 0.793622 irs 22 Chad 7 0.788106 irs 23 Mozambique 7 0.783889 irs 24 Rwanda 4 0.768073 irs 25
Burkina Faso 8 0.762951 irs 26
Niger 4 0.741436 irs 27
Note: Final sample from 2SLS. Note that drs: decreasing return to scale, irs: increasing return to scale Table A4: Descriptive statistics, Botswana
Variable Obs Mean Std. Dev. Min Max
Primary completion rate 8 95.04062 2.228748 90.95621 98.98571
Aid to education per capita 9 .0869176 .0593788 .015311 .2001466
GDP per capita 11 3815.366 357.0072 3204 4219.646
Governance effectiveness 10 .5834893 .0721504 .5102532 .7272455
Control of Corruption 10 .9244983 .1920662 .6060068 1.249669
21
Table A5: Descriptive statistics, Niger
Variable Obs Mean Std. Dev. Min Max
Primary completion rate 11 29.42712 9.159605 17.92173 40.68732
Aid to education per capita 9 1.320889 .7824656 .3105139 2.622225
GDP per capita 11 171.4778 4.804208 164.6489 180.0839
Governance effectiveness 10 -.8252304 .1232776 -1.084863 -.6864156
Control of Corruption 10 -.8263506 .1496113 -1.067721 -.6098286
Pupil to teacher ratio 11 40.97828 1.709212 38.61445 43.6949
Table A6: List of countries
Country Observations Benin 7 Botswana 8 Burkina Faso 10 Burundi 9 Cameroon 9
Central African Republic 7
Chad 9
Congo, Dem. Rep. 4
Congo, Rep. 7 Ethiopia 10 Gabon 1 Gambia, The 7 Ghana 10 Guinea 10 Guinea-Bissau 2 Kenya 2 Lesotho 10 Liberia 2 Madagascar 6 Malawi 10 Mali 10 Mauritania 6 Mozambique 9 Namibia 9 Niger 6 Nigeria 5 Rwanda 6 Senegal 9 Sudan 7 Swaziland 8 Tanzania 7 Togo 5 Uganda 8 Zambia 8 Zimbabwe 3
23
References
Aiglepierre, R. and L. Wagner (2010), “Aid and Universal Primary Education”, CERDI, Etudes et Documents, E 2010.22.
Bermeo, S. and leblang, D. (2014), “Migration and Foreign Aid”, Forthcoming Internal Oganization, available at http://fds.duke.edu/db/attachment/2633
Christensen, Z., Homer, D. and Nielson, D.L. (2011), “Dodging Adverse Selection: How DonorType and Governance Condition Aid’s Effects on School Enrollment”, World
Development, 39:2044-2053
Clemens, Michael A. ( 2004) “The Long Walk to School: International Education Goals in Historical Perspective”. Center for Global Development Working Paper 37. Washington, D.C. Combes, J.-L., & Ebeke, C. (2011), “Remittances and household consumption instability in developing countries”. World Development, 39, 1076–1089.
Combes, J.L., Ebeke, C., Maurel, M. and Yogo, T. (2014), “Remittances and Working Poverty”, Journal of Development Studies, DOI:10.1080/00220388.2014.940912
Dreher, A., Nunnenkamp, P. & Thiele, R. (2008), “Does Aid for Education Educate Children? Evidence from Panel Data”, World Bank Economic Review, 22 (2), p. 291-314.
Fielding, David, Mark McGillivray, and Sebastian Torres. (2005), “Synergies between Health, Wealth, Education, Fertility and Aid: Implications for Achieving the Millennium Development Goals.”, World Institute for Development Economics Research, Helsinki.
(
www.wider.unu.edu/research/2004-2005/2004-2005-1/mdg-papers/fielding-mcgillivray-torres-160805.pdf).
Fuchs, A., Dreher, A and Nunnenkamp, P. (2014), “Determinants of Donors Generosity: A Survey of Aid Literature”, World Development, 56:172-199
Michaelowa, K., and A. Weber (2007). ‘Aid Effectiveness in the Education Sector: A Dynamic Panel Analysis. In S. Lahiri (ed.). Theory and Practice of Foreign Aid, Amsterdam: Elsevier, 357–85.
Rajan, R.G., and A. Subramanian (2008), “Aid and growth: what does the cross-country evidence really show?”, The Review of Economics and Statistics, 90(4): 643–665.
Riddell, A. (2012). ‘The Effectiveness of Foreign Aid to Education: What Can Be Learned?’. WIDER Working Paper 2012/75. Helsinki: UNU-WIDER.
Staiger, Douglas, and James H. Stock. (1997). “Instrumental Variables Regression with Weak Instruments.” Econometrica 65(3):557–86.