HAL Id: cea-02016635
https://hal-cea.archives-ouvertes.fr/cea-02016635
Submitted on 12 Feb 2019
HAL is a multi-disciplinary open access
archive for the deposit and dissemination of
sci-entific research documents, whether they are
pub-lished or not. The documents may come from
teaching and research institutions in France or
abroad, or from public or private research centers.
L’archive ouverte pluridisciplinaire HAL, est
destinée au dépôt et à la diffusion de documents
scientifiques de niveau recherche, publiés ou non,
émanant des établissements d’enseignement et de
recherche français ou étrangers, des laboratoires
publics ou privés.
A study of feasibility for genome-wide haplotype
association of complex traits in imaging genetics
Slim Karkar, Yann Le Guen, Cathy Philippe, Claire Dandine-Roulland,
Morgane Pierre-Jean, Jean-François Mangin, Edith Floch, Vincent Frouin
To cite this version:
Slim Karkar, Yann Le Guen, Cathy Philippe, Claire Dandine-Roulland, Morgane Pierre-Jean, et al..
A study of feasibility for genome-wide haplotype association of complex traits in imaging genetics.
BIBM 2018 - Proceedings of The IEEE International Conference on Bioinformatics and Biomedicine,
Dec 2018, Madrid, Spain. �cea-02016635�
A study of feasibility for genome-wide haplotype association of complex traits in
imaging genetics
Slim Karkar1, Yann Le Guen1, Cathy Philippe1, Claire Dandine-Roulland2, Morgane Pierre-Jean2, Jean-Franc¸ois Mangin1,
Edith Le Floch2 and Vincent Frouin1
Abstract— Imaging-genetics cohorts allow to find associations be-tween genotyped variants and brain imaging features. They are invaluable tools to evaluate the part of genetics and environment in the brain characteristic variance observed in normal and pathological populations. The present analyses were conducted using the 2018 UK Biobank (UKB) data release, and included 15,040 subjects for which sulcal opening, a measure of sulcus width, are extracted for 126 sulci using BrainVisa/Morphologist pipeline. Based on genetic maps, continuous blocks of high-confidence phase are extracted using the haplotype dataset of UK Biobank. The feasibility study analyzes 13,942 haplotypes of 1,756 blocks on chromosome 21, obtained with a stringent block definition, and shows that block-based test seems underpowered compared to haplotype-based association test.
INTRODUCTION TOIMAGING-GENETICS STUDIES
Imaging-genetics cohorts allow to find associations between genotyped variants and brain imaging features. They are invaluable tools to evaluate the part of genetics and environment in the brain characteristic variance observed in normal and pathological populations. Over the past years, studies using thousands of subjects like the one available from the Human Connectome Project (HCP) showed a strong genetic control over numerous cortical structures. Recently, measures of sulcal root position, sulci depth and grey matter thickness were shown by our group to be highly heritable [1], [2]. Traditional GWAS have shown a few new markers associated with these phenotypes [3].
Genetic basis of complex traits in neurosciences
Heritability studies have shown that the genetic basis for complex traits spans across the whole genome and we expect that causal variants will show only small size effects in the association [4]. Hence, research consortia in imaging-genetics have built cohorts of expanding size, from HCP (≈ 1, 200 subjects) and IMAGEN (≈ 2, 000 subjects) to UKB (≈ 20, 000 subjects to this day) and even more sensitive association methods have been sought actively. Haplotype association studies in neurosciences
The search for early biomarkers for pathologies like neurodegen-erative diseases requires to better know the non-pathological vari-ability and associated causal variants in control subjects to rapidly identify valuable biomarker candidates of a disease. In the case of psychiatric syndromes, the quantitative, complex traits derived from imaging data show a continuum with no clear borders between normal and pathological values. These examples are incentives to develop even more sensitive methods to detect associations in large cohorts of control subjects.
In this work, we aim to investigate the properties of association methods between complex phenotypes extracted from imaging data and genome-wide haplotypes, as defined by a block of contiguous markers of high-confidence phase.
1Neurospin, Institut Joliot, CEA, Universit Paris-Saclay, Gif-sur-Yvette,
France
2CNRGH, Institut Jacob, CEA, Universit Paris-Saclay, Evry, France
I. MATERIAL ANDMETHOD
The present analyses were conducted under UK Biobank data application number 25251. The UK Biobank is a health research resource of about 500,000 people aged between 45 and 73 years old, that were recruited in the general population across Great Britain. In this work, we used the last release of imaging data of UKB, consisting of 20,060 subjects with a T1-weighted MRI and genotyping data [5]
A. Imaging data
Using BrainVisa/Morphologist pipeline [6], [7], 126 sulci were automatically extracted from T1-weighted images. For each sulcus, several features such as sulcal width, cortical thickness, and pits (sulcal root) depth [1].
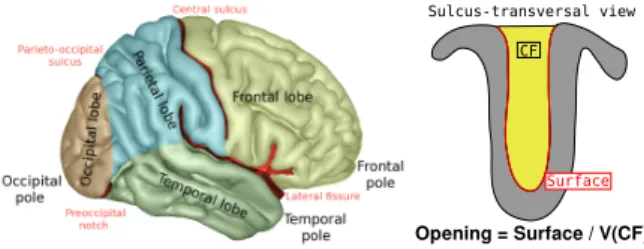
Sulci opening: We consider in this study the opening of a sulcus
- a measure of its width - computed as the ratio of the volume of the cerebrospinal fluid it contains and the surface of the sulcus. In brain imaging, sulci widening is a phenotype used to study aging and can serve for example as a proxy for premature aging. Sulcal opening values observed on the UKB sample we used exhibit a log-normal distribution across all ages with few extreme values. Hence, opening values were log-transformed, and outliers were removed using interquartile range methods.
CF
Sulcus-transversal view
Surface
Opening = Surface / V(CF)
Fig. 1. (left) Main brain structures : Sulci are the main furrows. For example, Central Sulcus is separating Frontal and Parietal lobes. (right) Sulcus opening, a measure of the sulcus width, is computed as the ratio of the volume of cerebrospinal fluid and the surface of the sulcus.
B. Genetic data
We used UKB genotype data of January 2018 release, that contains 658,720 SNPs spanning across the 22 autosomal chromo-somes. We excluded from our analysis subjects with low QC index, first degree related individuals or sex mismatches. In total and out of the 20,060 subjects with neuroimaging, we retained 15,251 subjects with approximately 48% of males and 52% of females (see [2]). From this release, we used the phase information as computed by SHAPEit, made available for all genotyped SNPs in March 2018 release.
We define blocks of high confidence phase over the 22 autosomal chromosomes using the GRCH37 genetic recombination map in centimorgan (cM), based on the 1000 Genomes project. In order to
keep block with high confidence phases, we retained in each block the SNPs being in linkage disequilibrium (LD) exclusively. In the approach proposed in [8], the genome is divided in overlapping blocks of fixed span of 0.25 to 1 cM on the genetic map. Here, we propose to define non-overlapping blocks. The end-SNP and the start-SNP of two consecutive blocks are separated by at least ∆ cM. This procedure guarantees that two consecutive SNPs in the same block are separated by less than ∆ cM. We investigate the effect of ∆ cM by using six various values ranging from 0.001 to 0.025 cM in Figure 2.
We proposed three different ad-hoc procedures for genome-wide haplotype association implemented in R.
Block-test using likelihood ratio test: In the first procedure,
referred to as ”block-test” hereafter, we use a linear regression of the phenotypes Y over the covariates X and all the haplotypes
hi observed in a given block collated in a design matrix H.
Each column hi contains codes from 0, 1, 2 in order to study the
additive effects of the haplotype. The significance of the block-test association is estimated using a Likelihood Ratio Test for nested Linear Models for Y : (i) the linear model that contains
only the covariates Y ∼ βX(X), and (ii) the block model Y ∼
βX,H(X, H) that contains covariates and the design matrix .
Complete-test using a χ2 test of the coefficients: A second
procedure, referred to as ”complete-test”, uses the same linear
model regression Y ∼ βX,H(X, H) as in the block-test. For
this procedure, we compute a standard two-sided p-value of the t-statistic of the regression coefficient associated with each column
hi∈ H in the block.
Independent haplotype-test considering haplotypes as
indepen-dent variables: Finally, we propose a third procedure, referred to as
”Independent haplotype-test”, where each haplotype is considered as an independent variable and is tested successively. In a similar way as the previous procedure, we use a linear modeling Y ∼
βX,hi(X, hi) where hi is the additive effect of haplotype i. We
compute a standard two-sided p-value of the t-statistic of the
regression coefficient associated with the additive effect of hi.
This procedure is similar to the quantitative linear association test implemented in PLINK for the SNPs.
The study of the properties of the proposed procedures was assessed using haplotype data from chromosome 21 and the opening of the Central Sulcus.
II. RESULTS
A. Genome-wide distribution of haplotype block
We explored six values of ∆ from 0.001 to 0.025 cM which defined six families of haplotype blocks. We studied the overall distribution of the genomic length L[h] of the blocks in the six configurations. These distributions present a log-normal shape as shown in Figure 2. The distribution median value is sensitive to ∆, and presents a heavy tail for lower values of ∆. For the most stringent criterion ∆ = 0.001, the distribution of L[h] seems homogeneous across all chromosomes. We chose this most conservative value because it ensures SNPs in LD in the block and this value was used for the following feasibility study of haplotype association.
B. Feasibility of genome-wide association studies for haplotypes Across chromosome 21, we obtained 1,756 blocks of high confidence phase using ∆ = 0.001. These blocks led to 13,942 haplotypes. Selected blocks had a span on the genetic map of length ranging from 9.4e-07 to 1.2e-02 cM, with a median value of 6.7e-04 cM, gathering from 2 to 63 consecutive SNPs, with a
L[h] L[h] (cM)
Fig. 2. (left) Distribution of block span on the genetic map, L[h], as defined by the genetic distance between bordering markers, in cM, over 22 autosomal chromosomes. ∆ is the parameter that accounts for the maximal length in cM between two consecutive SNPs in the same haplotype. (right) Distribution of haplotypes’ span, L[h], across each autosomal chromosome. Using the most conservative value ∆ = 0.001, Distribution of blocks span appears homogeneous across the 22 autosomal chromosomes.
maximum length on the chromosome of 126 kbp. We ran the three procedures to study haplotype association with opening values of the Calacrine Fissure. Previous univariate GWAS using genotyped data did not report any hit between this phenotype and chromosome 21. In the absence of association, we expect the p-values of the tests to be uniformly distributed between 0 and 1 and the empirical Cumulative Distribution Function to follow a linear trend with a slope of 1. We also expect the lowest p-value to be close to
1/NT where NT is the number of test. We compared the observed
p-values distribution obtained with the three procedures with a null distribution as ”expected” values using Quantile-Quantile plots (QQ-plot) reported in left panels of Figures 3, 4 and 5 presented further in this section.
association test p-values
Fig. 3. (left) QQ-plot for p-values obtained for 1,756 blocks of chromosome 21 with an ANOVA test with one p-value per block. (right) p-value distributions for 4 classes of L[h], the length of the span of the blocks on the genetic map, in cM.
1) ”block-test” procedure: The block-test procedure produced
1,756 p-values for each block of high confidence phase along chromosome 21. The QQ-plot indicates a poor fit of the observed
vsexpected p-value distribution, with most significant p-values less
significant than their expected values (see left panel of Figure 3). Defining 4 classes of blocks according to the length they span across the genetic map, we could not distinguish a particular trend for p-values.
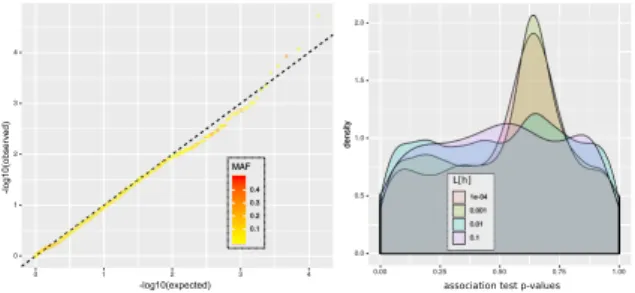
2) ”complete-test” procedure: The complete-test produced
13,942 p-values from 1,756 linear model regressions. In the QQ-plot on Figure 4, p-values seem to fit the null distribution and seem also independent of the minor allele frequency (MAF) of the haplotypes as suggested by the MAF information on the QQ-plot. However, the p-value distribution seems influenced by the length in
-log10(expected)
-log1
0(obse
rved)
association test p-values
Fig. 4. (left) QQ-plot for p-values obtained for 13,942 haplotype associ-ation tests using 1,756 linear model regressions; Color of points represent frequency f f of haplotypes. (right) p-value distribution for 4 classes L[h], the length of the span of the blocks on the genetic map, in cM.
cM that haplotypes span over the genetic map. More precisely, the distribution of p-values seems less uniform with decreasing genetic length.
-log10(expected)
-log1
0(obse
rved)
association test p-values
Fig. 5. (left) QQ-plot for p-values of association test for 19,930 haplotypes, considered as independent variables, using linear regression (similar to PLINK quantitive association test). Color of points corresponds to the frequency of the corresponding haplotype. (right) p-value distribution for 4 classes of L[h], the length of the span of the blocks on the genetic map, in cM.
3) ”independent haplotype-test” procedure: The independent
haplotype-test produced 13,942 p-values for each haplotype on chromosome 21, with one linear model fitted independently for each haplotype. In Figure 5, p-values seem to fit the null distribution on the Q-Q plot, also seem independent of the MAF, and the p-value distributions seem to be homogeneous across classes of increasing genetic length. .
III. DISCUSSION
In this study we used the most conservative value for ∆ in order to enforce as much as possible the high confidence of the phase of the markers along the block. Despite the unbalanced distribution of genetic length L[h] for the chosen ∆, we detected no effect on our analysis however. If this length would come to be an explanatory variable, one probably wants a more balanced distribution. Higher values of ∆ seems to produce distribution closer to the log-Normal form.
Regarding the procedures for testing association, the independent haplotype test seems to produce the most uniform distribution of p-values across all 4 classes of haplotype length on the genetic map, while the block-test seems more conservative, which might be explained by the high number of degrees of freedom of this test. As for the complete test procedure, it might not be the most suitable since it does nor produce uniform distribution of p-values for haplotypes of 2 to 4 or 5 SNPs in strong LD. For this study, we did not propose any correction for the p-values since we were not looking for significant associations, that is, we focused on finding the right null distribution.
CONCLUSION AND FURTHER WORK
In the context of imaging genetics, we proposed a study to test for association between haplotypes and quantitative traits relative to brain structures. A limitation of this work is the effect of haplotypes with low frequencies that could appears on larger scale. It is still unclear how haplotypes frequencies influence the results. Further work should include a procedure to filter out low-frequency haplotypes or alternatively, to filter out low-frequency SNPs.
Further work will define a procedure to correct p-values for multiple testing. The Bonferroni correction for the number of tests seems to be a too naive correction for p-values. However, [8] propose to correct by the estimation of the number of independent haplotypes. For the complete-test, that number should range be-tween the number of blocks and the number of haplotypes. Finally, we could plan an extension of the complete-test using a mixed linear model.
ACKNOWLEDGMENT
This work was funded by Fondation Pour la Recherche Medicale, FRM grant number DIC20161236445 awarded to J-F Mangin ”Conception dun dictionnaire des motifs du plissement cortical pour la d´etection danomalies d´eveloppementales”
REFERENCES
[1] Y. Le Guen, G. Auzias, F. Leroy, M. Noulhiane, G. Dehaene-Lambertz, E. Duchesnay, J.-F. Mangin, O. Coulon, and V. Frouin, “Genetic influence on the sulcal pits: On the origin of the first cortical folds,” Cerebral Cortex, vol. 28, no. 6, pp. 1922–1933, 2018.
[2] Y. Le Guen, C. Philippe, D. Riviere, H. Lemaitre, A. Grigis, C. Fischer, G. Dehaene-Lambertz, J.-F. Mangin, and V. Frouin, “eqtl of kcnk2 regionally influences the brain sulcal widening: evidence from 15,597 uk biobank participants with neuroimaging data,” bioRxiv, 2018. [3] Y. L. Guen, F. Leroy, G. Auzias, D. Riviere, A. Grigis, J.-F. Mangin,
O. Coulon, G. Dehaene-Lambertz, and V. Frouin, “The chaotic mor-phology of the left superior temporal sulcus is genetically constrained,” NeuroImage, vol. 174, pp. 297 – 307, 2018.
[4] R. Plomin, C. M. A. Haworth, E. L. Meaburn, T. S. Price, W. T. C. C. C. 2, and O. S. P. Davis, “Common dna markers can account for more than half of the genetic influence on cognitive abilities,” Psychological Science, vol. 24, no. 4, pp. 562–568, 2013, pMID: 23501967. [5] C. Bycroft, C. Freeman, D. Petkova, G. Band, L. T. Elliott, K. Sharp,
A. Motyer, D. Vukcevic, O. Delaneau, J. O’Connell, A. Cortes, S. Welsh, A. Young, M. Effingham, G. McVean, S. Leslie, N. Allen, P. Donnelly, and J. Marchini, “The UK Biobank resource with deep phenotyping and genomic data,” Nature, vol. 562, no. 7726, pp. 203– 209, 2018.
[6] D. Riviere, D. Geffroy, I. Denghien, N. Souedet, and Y. Cointepas, “Brainvisa: an extensible software environment for sharing multimodal neuroimaging data and processing tools,” NeuroImage, vol. 47, p. S163, 2009, organization for Human Brain Mapping 2009 Annual Meeting. [Online]. Available: http://www.sciencedirect.com/science/article/pii/S1053811909717203 [7] J.-F. Mangin, D. Rivi`ere, A. Cachia, E. Duchesnay, Y. Cointepas,
D. Papadopoulos-Orfanos, P. Scifo, T. Ochiai, F. Brunelle, and J. R´egis, “A framework to study the cortical folding patterns.” NeuroImage, vol. 23 Suppl 1, pp. S129–38, jan 2004. [Online]. Avail-able: http://linkinghub.elsevier.com/retrieve/pii/S1053811904003854 http://www.ncbi.nlm.nih.gov/pubmed/15501082
[8] D. M. Howard, L. S. Hall, J. D. Hafferty, Y. Zeng, M. J. Adams, T.-K. K. Clarke, D. J. Porteous, R. Nagy, C. Hayward, B. H. Smith, A. D. Murray, N. M. Ryan, K. L. Evans, C. S. Haley, I. J. Deary, P. A. Thomson, and A. M. McIntosh, “Genome-wide haplotype-based association analysis of major depressive disorder in Generation Scotland and UK Biobank,” Translational Psychiatry, vol. 7, no. 11, p. 1263, nov 2017. [Online]. Available: http://www.nature.com/articles/s41398-017-0010-9 http://dx.doi.org/10.1038/s41398-http://www.nature.com/articles/s41398-017-0010-9

![A 4th order continuous-time [Delta] [Epsilon] ADC with VCO-based integrator and quantizer](data:image/gif;base64,R0lGODlhAQABAIAAAP///wAAACH5BAEAAAAALAAAAAABAAEAAAICRAEAOw==)