HAL Id: cea-02394077
https://hal-cea.archives-ouvertes.fr/cea-02394077
Submitted on 21 Feb 2020
HAL is a multi-disciplinary open access
archive for the deposit and dissemination of
sci-entific research documents, whether they are
pub-lished or not. The documents may come from
teaching and research institutions in France or
abroad, or from public or private research centers.
L’archive ouverte pluridisciplinaire HAL, est
destinée au dépôt et à la diffusion de documents
scientifiques de niveau recherche, publiés ou non,
émanant des établissements d’enseignement et de
recherche français ou étrangers, des laboratoires
publics ou privés.
Activation computation for MINERVE cleanup and
dismantling
G. Ritter
To cite this version:
G. Ritter. Activation computation for MINERVE cleanup and dismantling. RRFM (European
Re-search Reactor Conference) – IGORR 2019 (International Group Operating ReRe-search Reactors), Mar
2019, Amman, Jordan. �cea-02394077�
Activation computation for MINERVE cleanup and dismantling
G. RITTER
*CEA,DEN, SPRC, F - 13108 St Paul-lez-Durance
* Tel: +33 (0) 442 254 180, Email: [email protected]
ABSTRACT
MINERVE was a French nuclear reactor mock up facility operated by the French Atomic Energy Commission, CEA. It is now facing decommissioning and dismantling which requires an assessment of activation
Activation computations are based on a realistic model of the reactor including the main components of civil engineering.
The computations were performed with CEA code TRIPOLI4® for neutron transport and CEA DARWIN 2.3 reference evolution package for activation. Nuclear data came from EAF and JEFF3.1.1.
The neutron transport was made in two consecutive steps. First a criticality calculation to determine the leakage off the core and second a shielding calculation to propagate neutrons towards structural materials.
Eventually, the activation and decay process, computed with CEA DARWIN package, helped determine activities around the core.
The core power was limited to 100 W and the water layer between core and peripheral structural materials thick enough so that activities after 40 years of operations remain limited.
1. Introduction
MINERVE was a nuclear reactor mock up facility, mostly dedicated to the experimental characterization of PWR’s and BWR’s [1]. It started operations in the sixties and is now ready for retirement.
The French Atomic Energy Commission, CEA, managed operations during the initial 50 years and is now facing decommissioning and dismantling. This new phase requires an assessment of activation, so that doses to personnel and activated inventories be evaluated and help take decisions in order to organize the project. For instance, some of the results may support decisions about keeping some parts of the facility or sending it to the waste disposal.
Activation computations are based on a realistic geometrical model of the reactor including reflectors and the main components of civil engineering.
The computations were performed with CEA Monte-Carlo TRIPOLI4® [2]for neutron transport and CEA DARWIN 2.3 [3] reference evolution package for activation.
The goal of this study is to present the means to compute neutron activation in the civil engineering of MINERVE. It has been used in the safety case for dismantling.
Dose rates are not evaluated here.
A synthesis of the study is given into the conclusion.
2. Reactor general description
MINERVE is located at the Cadarache Laboratory of CEA, in the south of France. It operated in the Experiments Section, Reactor Studies Department, Nuclear Energy Division of CEA, the French Atomic and Alternative Energies Commission.
The MINERVE facility [1] operated in the field of experimental Light Water Reactor (LWR) neutron physics. The maximum power was set to 100 W.
It first reached criticality in 1959 at Fontenay-Aux-Roses laboratory of CEA. Then it was moved to Cadarache, where a new campaign started in 1977.
It’s a pool type reactor cooled by natural convection, as the core is located 3 m below the surface of water. The total water height in the pool is about 4.5 m. The core is made of an outer neutron feed zone with enriched uranium plates and an inner experimental area with various set ups. The feed zone itself is surrounded by a bit more than 100 graphite reflectors in aluminum casing, with various sizes.
On the axis of the central zone, a so-called ″oscillator″, carries several types of samples (inert materials, fissile compounds with a range of actinides or neutron poisons) in order to improve the validation of basic nuclear data (e.g. cross sections ).
Eventually, it has also been used as a training tool for students and core control operators all across CEA.
3. Methods
A computation scheme consists in defining a sequence of operations with one or several computer codes in order to characterize targeted physics features of a type of system.
Here is a first attempt to assess activation in MINERVE. In the long term, a computer package dedicated to decommissioning and dismantling issues is to be developed and used for better predictions [4] [5]. This computer scheme includes the 3 following steps, with associated computer codes and specific data sets :
Core characterization, including outgoing neutron source term : Monte Carlo Neutron Transport with TRIPOLI4 ®
Source transport from core periphery to the outmost possibly activated regions of the facility : Monte Carlo Neutron Transport with TRIPOLI4 ®
Materials activation with DARWIN-2.3
A further step should ultimately be included to the scheme with propagation of sources. This last step also uses TRIPOLI4, so that to evaluate dose rates in any point of the model, starting from spectra due to activation in each material. It will be useful to optimize operations scenarios when dismantling starts.
3.1 Assessment of core outgoing neutrons source term
The TRIPOLI4® data set operated with version 10 and corresponding to MINERVE reference core has been used to solve a criticality problem. This input deck was elaborated previously and dedicated to the validation of elementary nuclear data [1] and reactor Physics deterministic computation codes, like APOLLO2 [6].
The feed core is independent from the experimental area. So that, whatever the program inside, neutrons leaking the core will keep the same spectrum.
Transport computations have been achieved with the following resources : Dell Precision Tower 7810 with Linux 3.16.0-4-amd64 #1 SMP Debian 3.16.43-2 x86_64 GNU/Linux equipped with 8 processors type Intel(R) Xeon(R) CPU E5-2637 v3 @ 3.50GHz and 32 Gb RAM. The computation duration is 100 h for 108 histories.
This refined data set allows for a fine characterization of core physics. However, the associated model has outer boundaries at the location where core physics is no longer sensitive to further geometrical refinements.
It corresponds to the pool region, several 10cm outside the core and even beyond reflector (cf. Figure 1 below).
At this level, the computation scheme adds a fictitious frontier all around the core. This new volume bears a cylindrical shape (pink in Figure 1 below) and will later allow recording for all outbound leaking particles () their distinctive features (Nature / Position / Direction / Energy / Statistical Weight). In TRIPOLI4 ®, this operation is called STORAGE and can be further used in a so-called ″surface restart″. Such features are the most representative of core physics as it comes from the most refined core model, the one dedicated to computer schemes validation and comparisons with experiments.
Figure 1 : MINERVE refined geometrical model
Figure 2 below shows a flux distribution in elevation and in a horizontal plane cut in the MINERVE fine core model.
Figure 2 : Indicative flux distribution in the MINERVE fine core model (scale in n/cm².s)
Figure 2 shows neutron ″storage″ in the graphite reflector (large blocks outside the core) and how it is quick attenuated in the pool water around.
The energy deposited in the whole model is determined with a DEPOSITED_ENERGY response and the LOCAL_ENERGY_DEPOSITION score integrated over all volumes.
The computation yields 82.2 MeV/n, which is necessary to normalize the source intensity to the proper power.
This energy per neutron result will also be helpful to normalize the source intensity in the second phase ″surface restart″ computation.
It would not be realistic achieving the same level of refinement in the civil engineering over the whole facility as in the core first phase model, as it would take too much design effort. On top of that, the second phase source propagation transport would be much slower if the second model included every nuts and bolts, as in the core.
As a consequence, the idea is to stop computations at the boundary between a very accurate model of the core and a more global description of the rest of the facility. At this frontier point, all particles are frozen and stored, then, a new computation starts towards a more adapted geometrical model, while it is still representative of the building. This second phase is called a ″surface restart″, as frozen particles are generated and launched from the very surface where it was last frozen at the end of the first phase. At the end of the first criticality computation phase, a Particles Storage File (PSF) has been generated and stored for each neutron coming across the limit.
In the case of this computation, the restart surface is made of a cylinder, all around the core. It has three faces : The upper and lower plates and the outer peripheral ferrule (cf. pink part of Figure 1).
On each face of the restart frontier, initial neutron characteristics are stored and can be used for the second phase computation.
3.2 Source restart and propagation in the building
A first neutron transport criticality computation in a most refined model was performed to characterize outgoing neutrons at its boundaries. The corresponding neutron distribution is now going to be used for their propagation with a so-called ″surface restart″ into a larger geometrical model that describes the facility.
Figure 3 : First and second computation geometrical models
Figure 3 above shows the first geometrical model with its outer purple frontier* and the core, in dark blue. It also shows the second geometrical model with the same common inner frontier* in purple and the water around this boundary and eventually the concrete beyond.
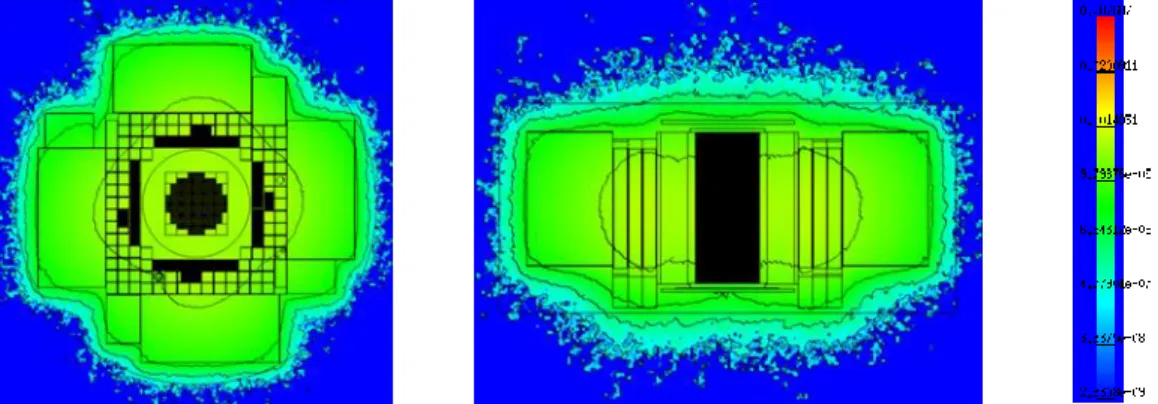
At the frontier level, the restart intermediate neutron source has the location and energy distribution shown in Figure 4 below. This figure aims at giving a qualitative illustration of the source distribution in phase space and broadly shows a cylinder, which corresponds to the geometrical limits of the frontier.
Figure 4 : Intermediate restart neutron source distribution (cm, MeV heat map)
This restart source, recorded at the boundaries of each geometrical model, corresponds to neutrons leaking outwards the core region.
Core physics analysis geometrical models are designed to characterize what happens inside the core and outgoing neutrons leakage is minimal.
For instance, among 2108 initial histories (~200 h cpu), only ~4.3106 neutrons (2.175%) remain at the boundary.
So that in order to have the same number of neutron histories coming to the edge of the second broad model, with civil engineering, and considering neutrons remain in the same compact cloud as in the core (which is optimistic, beyond more than 50 cm of water), about 1/0.01275≈80 more cpu power would be required.
The last hypothesis is not coherent as the computation goal during the second phase is no longer criticality but shielding transport, outside of a multiplication lattice, where neutrons will be dissipated in construction materials.
As a consequence, using directly the outgoing source, even with intermediate PSF files, could be misleading, either because the file would not contain as many neutrons as needed or because it would require more computation power, which is not compatible with the project needs, in terms of operational reactivity.
Then, rather than using a source with limited features, it was decided to extract its distribution in phase space. It meant separating direction, energy and location parameters at the boundary. It concerned a neutron population of ~4 106 neutrons, coming out of the upper or lower plate or from the peripheral side of the cylinder.
Effective number of neutrons across the restart surface for 2108 initial histories 4,300,000 Share of neutrons leaking through the upper plate 33% Share of neutrons leaking through the lower plate 51 %
Share of neutrons leaking through the ferrule 16 %
Table 1 : Restart source surface characteristics
A dedicated python2 script tool was developed in order to discretize each source neutron component in phase space (direction, energy and location). It was operated on each face (upper plate, lower plate and ferrule) of each MINERVE source. It was also used to check wether the second computation source parameters were in agreement with those extracted from the first computation, to prevent any syntax error when typing these parameters.
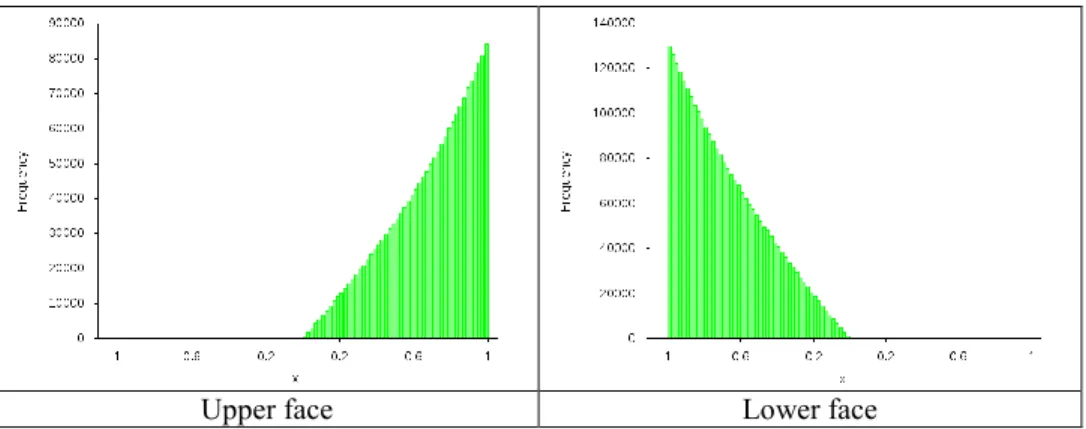
Figure 5 below shows a distribution of directions for upper and lower plate sources. This figure confirms that neutrons leaking through the upper plate are essentially oriented towards the top (0.<w<1.), while those leaking through the bottom plate are essentially oriented towards the ground (-1.<w<0.).
Upper face Lower face
Figure 5 : Direction distributions according to Z for upper and lower faces of the frontier
The statistical weight for leakage neutrons W is also looked after, as Figure 6 below shows. Source processing shows 0,8 < W < 1,0, which is in agreement with expectations.
Figure 6 : Statistical weight for leakage neutrons (104 n sample)
The location distribution is determined beyond a given axial level (base or top of the cylinder) as a function of radius and, between both previous levels for a cylinder radius, as a function of the axial level and azimuth (cf. Figure 7 below).
Figure 7 : Azimuthal location of sources around the cylinder
The azimuthal distribution around the cylinder (Figure 7 above) lets reflector blocks edges appear more clearly, as can also be seen on Figure 2.
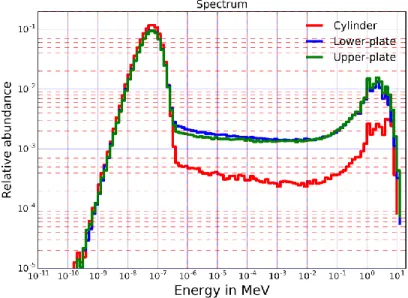
Eventually in Figure 8 below, the energy distribution for each source component is determined in a 100 group constant lethargy increment binning. It basically corresponds to energy with a log scale.
Figure 8 shows intermediate sources spectra. It corresponds to the energy distribution of neutrons leaking through the upper and lower plate, as well as across the cylinder.
It shows the maxwellian part of the spectrum is more important around the cylinder, from a qualitative standpoint, than above and below. It can be explained by a source frontier that is located in the pool, closer to the core above and below (in other words with less moderation) and closer to the graphite reflector (slightly more moderation) around the cylinder. Energy distributions above have each been averaged over one among three faces of each source frontier. In the second phase of the computation, it is then inserted as an independent source in the new global model.
And in this new model, each source keeps its original features (Location, Direction and Energy), as described previously. The source is discretized according to each dimension of phase space. In the end, 100 groups have been selected in each dimension (Location, Direction and Energy).
As a consequence, a direct sampling has been performed at the end of the first computation and then used in the second step for propagation of the restart surface source.
Restart sources sampled from PSF’s generated by initial refined criticality computations are then propagated into a shielding type of computation in the building geometrical model. This model is no longer restricted to the technological description of the core but now includes structural pieces of the building like walls, slabs and the pool steel liner. The building geometrical model will be described further, but before, a precision is given below on the process of checking sources.
3.3 Checking sources
This part describes how the restart surface source is checked for each configuration. The goal of this process is to make sure the initial source sampling is correct and the parameters for the second phase computation are such that the restart source sticks to the PSF.
In other words, it means that sampling the restart source must give the same distribution as for the PSF.
As a consequence, the idea is to make sure the source generated in the second phase is basically a copy of that extracted in the first phase (PSF). It corresponds to the following two keywords in TRIPOLI4®, STORAGE and STORE_SOURCES_IN_FILE. It prevents mistakes occurring during sampling as well as when typing the second source.
This verification is successful as all distributions (Energy, Direction and Location) of both the initial sampling and the second source for all three surfaces (upper and lower plate as well as peripheral cylinder) stick one to the other.
It is also possible to take advantage of the restart surface location. This interface is located in open water, where neutron transport conditions are just identical. It then helps double checking the transport beyond that location as a PSF can be stored at the first interface and at another one further off the core. Sampling PSF’s at both interfaces in the first and second restart computation also proves the method preserves neutron transport physics.
This operation was performed with fewer statistics at the second interface in the first computation, as for the same initial number of histories, even less neutrons can reach such remote frontiers. In the second computation, the source was closer, so that the statistics had to be better.
The results show that the source used in the global geometrical model (that including the building) is in agreement with the PSF extracted from the initial refined computation at the level of the restart surface. Such results also validate the applied methodology as it proves, by similarity between distributions measured at the level of the second storage surface for first and second computations that neutron transport in between is identical.
As a consequence, the two step transport methodology, that helps saving a factor of several 100 in computation power is also validated from the Physics standpoint.
The following part extends the computation scheme description, providing details on the geometry where activation is determined.
3.4 Physics hypotheses
The volumes assembled in the geometrical model are a consistent reproduction of the actual civil engineering, and compositions for the corresponding materials are also described.
3.4.1 Geometrical model
This part gives a description of the geometrical model designed to determine the activation of civil engineering in the facility. It was built using the geometry surface syntax of TRIPOLI4® and depicted with its T4G module. This geometrical model is based on plans taken from the safety case.
Only four materials are used in this simpler model : The source core block, pool water, ordinary concrete and the pool steel liner.
The pool has a square, instead of a rectangular, cross section for simplification and conservatism. The concrete comes in contact of the pool steel liner, just as if there was no intermediate layer. The 4 scoring zones for the determination of spectra correspond to a 5 cm thick layer in concrete and to the whole thickness of the pool vessel. It is located in front of the source core region, with either the same hight or the same diameter.
The 5 cm thickness is determined by the following criteria : It is technologically representative, as it corresponds to the protection for structural steels (although steel is diluted into the whole volume of the numerical model), it is large enough to record enough events with best convergence criteria and it is not too thick, so that to avoid scraping one or several local peaking effects.
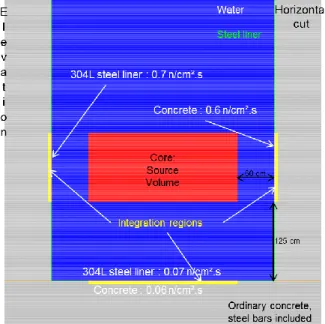
Dimensions are given on Figure 9 below.
Elevation across core axis Plane cut at core mid plane Safety case plane cut
Figure 9 : Elevation and plane cut view
3.4.2 Materials compositions
This part presents hypotheses taken to enter materials compositions for all volumes of above geometrical models.
Concrete is the most abundant material in civil engineering. Several assumptions were made before selecting the figures that seem closest to the actual construction compositions.
For instance, it would have been too complicated and useless to enter an explicit description of structural steels in concrete. As a consequence, this composition was homogenized according to the specific steel volume fractions in the model.
In concrete, impurities often include some traces of heavy nuclides (~ 1ppm U and ~ 2 ppm Th) that have been removed from actual compositions as their natural decay adds a fictitious increment to activity while it is not caused by human activity (exposure to neutron flux).
Similarly the permanent natural activity due to initial 40K and 87Rb, mostly in concrete, is also removed as the computation only accounts for a balance between final and initial activity.
Those compositions combine two lists per material. The list of elements sufficient for neutron transport with TRIPOLI4® and the longer list of elements used for evolution computations with DARWIN 2.3.
The actual composition for concretes in civil engineering has not been recorded during construction. As a consequence, some assumptions were done. The reference concrete composition came from analytical chemistry measurements previously performed on the French RAPSODIE reactor dismantling experience as this fast breeder experimental reactor facility started decommissioning earlier in Cadarache as well.
This choice was determined by the observation that MINERVE and RAPSODIE concretes were produced locally, possibly with the same cement and aggregates from the same quarry, and at least during the same period of time (1960’s).
The study considered the ordinary concrete sample of RAPSODIE corresponded to the mineral part of MINERVE concrete composition, and it was complemented with the adequate volume fraction of structural steel bars, so that the overall density is 2.42.
The pool steel liner was considered a stainless 304L type with a density of 7.96.
3.5 Source Propagation : flux distribution towards civil engineering
The TRIPOLI4® geometrical model includes all the facility, with outbound leakage boundary conditions. Instead, the source core region is considered a neutron black body (N(3He)=1010 at/b.cm)), so that neutrons entering this region are lost, ″body and soul″, for the computation.
MINERVE SHIELDING computations with 50109 histories last ~70 h wallclock. The convergence is poor as only very few particles reach scoring regions (60 cm off radially and 125 cm off axially).
These computations were performed with the following resources: 2 nodes type DELL Power Edge C6320 with 20 Intel Xeon E5-2660 v3 processors operating at 2,6Ghz with 128 Gb RAM and 4 nodes type Bull R424-E4 with 28 Intel Xeon E5-2680 v4 processors operating at 2.40GHz with 256 Gb RAM.
The sum of all source intensities is normalized to a total (fission and other nuclear reactions) power of 100 W and is worth 2.17% of 7.60 1012n/s, as the energy deposited per history neutron in the refined core model is 81,37 MeV (2.17% is neutron leakage off the core).
In all integration zones, the scores are recorded with a TRIPOLI4® 315 groups energy binning, which is specific to activation computations.
3.6 Characterizing evolution
This part aims to show how the flux distribution evaluated in the past chapter will be used to assess the activation of specific materials in both facilities.
The evolution computation method will be described and the hypotheses on irradiation history will be presented.
3.6.1 General description of the evolution computation
315 group fluxes generated by TRIPOLI4® [2] are extracted for each scoring zone and inserted in DARWIN 2.3 [3], CEA reference package for isotopic evolution assessment.
Then it uses the INTERPEP and PEPIN2 modules of DARWIN 2.3 that generate 1 group reaction rates and solve the Bateman equation with a RK4 solver. In the end, it produces activities 3 years after shutdown, when clean up can begin.
Nuclear data (M, EY …) libraries are based on the JEFF3.1.1 evaluation [7] for transport and
on EAF [8] for activation.
Materials’ compositions include up to 60 elements in the evolution computation, whereas there are only 10 to 20 for TRIPOLI4® neutron transport. The reason is neutron transport is sensitive only to the major compounds, and except specific isotopes, like e.g. B or Hf, adding traces would only cost useless delays to this part of the computation. On the contrary, it is essential that evolution brings a comprehensive characterization of activation, meaning even the thinnest traces, that can add a significant contribution, must be included. For instance, it is the case of Co in steel or Cl in graphite.
On top of that, some materials, like concrete, may already contain naturally radioactive elements, like 40K, 87Rb, U and Th, from the beginning of construction. And such isotopes do not contribute to the artificially added activity. This study only accounts for activity increments caused by exposure to neutron flux.
The comparison of added activity for a U-Th composition when exposed to the operations history or not exposed to neutron flux (× 10-15) shows it is identical, meaning natural decay is the only cause for appearance of new radioactive isotopes, so that irradiation is not concerned.
3.6.2 Irradiation history
The irradiation history between the beginning on 09/1977 and the end in 12/2017 is a sequence of several active phases, with exposure to neutron flux, followed by decay periods.
A three years cooling phase is added at the end of operations, after reactor final shutdown on December 31st 2017. It leads to activities on January 1st, 2021. Three years is the minimum duration prior to start active dismantling.
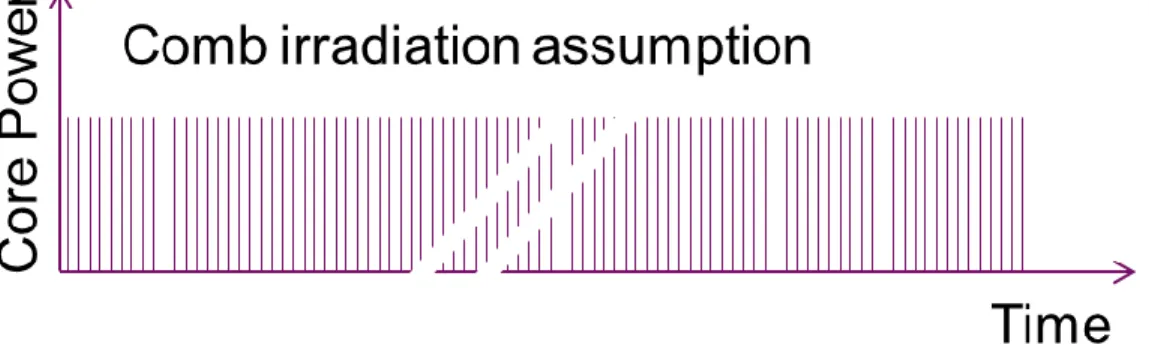
Then, a first attempt to obtain more realistic results consisted in simulating a fictitious operations history, called a ″comb″, and corresponding to
30 minutes operations / day
20 days operations / month followed by 10 days ″cooling″
12 months / year
40 years of operation
The result is 9700 more refined steps.
Figure 10 below gives a schematic illustration of this "comb" approach :
Figure 10 : Refined history (comb) assumption
This approach is certainly conservative as 100 W was the maximum power limit set by the safety case. It is probable that experiments were performed at a lower power.
Moreover, there have been maintenance and upgrade periods, when the reactor was not available for several months, so that the 12 months/year availability is envelope.
4. Results
This chapter gives a synthesis of activation results obtained on MINERVE. The first part is about flux distributions. The second one is about activities.
4.1 Flux distributions from TRIPOLI4
®The Monte-Carlo neutron transport computations were performed with TRIPOLI4® and based on JEFF3.1.1 nuclear data. It corresponds to the second phase with surface source restart. The results for the first phase are given in Figure 2. Spatial distributions are integrated over energy (1 bin) and energy spectra between 10-11 MeV and 20 MeV correspond to the 315 groups binning of TRIPOLI4® for activation. The flux distribution in MINERVE is very much attenuated in water, so that pool liner and concrete activation is almost negligible.
4.1.1 Neutron energy spectra
Figure 11 below shows neutron spectra in the concrete wall around the pool and steel liner around the pool too. It shows the flux level for 100 W fission power in the core is extremely low. It is even lower at the bottom of the pool (steel liner and concrete base). This figure also shows the uncertainty is not negligible due to poor statistics in such remote scoring regions.
Figure 11 : Neutron spectra in the facility, beyond the core
The thermal maxwellian part of the spectrum is obviously the main component of both spectra It is similar in both materials.
4.1.2 Flux spatial distribution
50109 neutron histories were simulated and figures were generated with T4G, the graphics module of TRIPOLI4®.
The flux distribution was observed on the floor and on the vertical sides of the pool.
Figure 12 below shows the relative flux distribution on a log scale from TRIPOLI4® computation in plane cut (right) or in elevation (left) in the pool, steel liner and concrete.
Figure 12 : Indicative flux distribution in the pool (Log scale)
Figure 12 above shows the very important flux attenuation in pool water (the heatmap is a log scale). It self explains why the activation in the steel liner and concrete is so low.
The log scale gives flux level values between 0 n.cm-2.s-1 (blue) and 1.21010 n.cm-2.s-1 (red).
4.2 Activity from DARWIN 2.3
This part is relative to the assessment of activity from fluxes computed with TRIPOLI4® and the irradiation history described in § 0.
Figure 13 below shows the flux level at the location of main integration zones in MINERVE for a total power of 100 W.
Figure 13 Flux levels (100 W)
Four integration zones can be seen on Figure 13 above. Two steel and two concrete, corresponding to the base and wall of the pool.
Steel bottom Concrete base Concrete wall Vertical steel liner
FE_55 7,5E-07 60% FE_55 9,4E-06 60% SM147 4,1E-04 91% SM147 4,1E-04 91% CO_60F 3,1E-07 25% CO_60F 4,0E-06 25% RE187 1,6E-05 4% RE187 1,6E-05 4%
NI_63 1,7E-07 14% NI_63 2,3E-06 14% LA138 1,4E-05 3% LA138 1,4E-05 3% MN_54 6,1E-09 0,5% MN_54 1,2E-07 1% LU176F 1,1E-05 2% LU176F 1,1E-05 2% NI_59 1,6E-09 0,13% NI_59 2,1E-08 0,1% PT190 3,9E-07 0,1% PT190 3,9E-07 0,1% _C_14 3,6E-10 0,03% _C_14 4,6E-09 0,03% TE123F 1,7E-07 0,04% TE123F 1,7E-07 0,04% NB_93M 6,0E-11 0,00% _H__3 1,3E-09 0,01% ND144 1,5E-07 0,03% ND144 1,5E-07 0,03% MO_93F 7,3E-12 0,00% NB_93M 4,9E-10 0,00% _H__3 1,4E-07 0,03% SM149 2,0E-08 0,00% SB125 7,2E-12 0,00% CO_58F 5,4E-11 0,00% FE_55 1,0E-07 0,02% _H__3 1,5E-08 0,00% CO_58F 3,2E-12 0,00% MO_93F 4,5E-11 0,00% AR_39 2,1E-08 0,00% IN115F 1,2E-08 0,00%
Total 1,2E-06 1,6E-07 Total 1,6E-05 6,5E-06 Total 4,5E-04 1,9E-04 Total 4,5E-04 5,7E-05
Bq/cc Bq/g Bq/cc Bq/g Bq/cc Bq/g Bq/cc Bq/g
Such activities are very low and anyhow much lower than the natural activity due to 40K (~0.3Bq/cc) or 87Rb (0.04Bq/cc) in concrete. The bottom is about 100 times less active than vertical sides.
This is due to a low reactor power and a water layer thicker than at least 50 cm between core and steel liner.
5
Conclusion
This study presents the computation scheme developed in order to characterize the activation of MINERVE civil engineering.
It shows the hypotheses and protocol applied to TRIPOLI4® neutron transport and DARWIN2.3 evolution reference packages of CEA.
It justifies a necessary two step treatment for the neutron source.
It shows flux and activity results for both concrete and steel around the reactor pool. Fluxes and activities are very low.
Such results were used to determine accidental release scenarios. The maximum activity increment is lower than 6 10-5 Bq/g.
6
References
[1] A. Santamarina, P. Leconte, D. Bernard et G. Truchet, «Reactivity Worth Measurement of Major Fission Products in MINERVE LWR Lattice Experiment,» NUCLEAR SCIENCE AND ENGINEERING, vol. 178, n° %14, pp. 562 - 581, 2014.
[2] E. Brun, F. Damian, C. Diop, E. Dumonteil, F.-X. Hugot, C. Jouanne, Y. Lee, F. Malvagi, A. Mazzolo, O. Petit, J.-C. Trama, T. Visonneau et A. Zola, TRIPOLI-4 CEA, EDF and AREVA reference
Monte-Carlo code, 2015.
[3] L. San-Felice, R. Eschbach et P. Bourdot, «Experimental validation of the DARWIN2.3 package for fuel cycle applications,» chez PHYSOR 2012, Knoxville, Tennessee, USA, 2012, April 15-20.
[4] M. Soulard, G. Ritter, C. Le Loirec, R. Eschbach et O. Sérot, «Source Term Computation for reactor dismantling operations,» chez DEM 2018, Avignon (France), 2018.
[5] C. LE LOIREC, M. SOULARD, G. RITTER et Y. PENELIAU, «Benchmark study of tripoli-4® for decommissioning purposes,» chez DEM 2018, Avignon, France, 2018.
[6] J. Vidal, P. Blaise et A. Calloo, «Qualification of APOLLO2.8-JEFF3.1.1. For the calculations of plutonium recycling PWRs using the EPICURE-UMZONE experiment,» chez PHYSOR 2010, Int Conf
on the Physics of Reactors, Pittsburgh (USA), 2010.
[7] A. Santamarina et D. Bernard, «The recommended JEFF3.1.1 file and corresponding CEA2005V4.1 library for accurate calculations. NT SPRC/LEPH/08/002.,» 2008.
[8] J.-C. Sublet, L. W. Packer, J. Kopecky, R. A. Forrest, A. J. Koning et D. A. Rochman, «The European Activation File: EAF-2010 neutron-induced cross section library,» CCFE, Abingdon, 2010.