HAL Id: hal-02370327
https://hal.archives-ouvertes.fr/hal-02370327
Submitted on 19 Nov 2019
HAL is a multi-disciplinary open access
archive for the deposit and dissemination of
sci-entific research documents, whether they are
pub-lished or not. The documents may come from
teaching and research institutions in France or
abroad, or from public or private research centers.
L’archive ouverte pluridisciplinaire HAL, est
destinée au dépôt et à la diffusion de documents
scientifiques de niveau recherche, publiés ou non,
émanant des établissements d’enseignement et de
recherche français ou étrangers, des laboratoires
publics ou privés.
ANALYSIS OF THE RAINBOW SCATTERING BY
HOMOGENEOUS AND INHOMOGENEOUS
DROPLETS IN LIQUID-LIQUID SYSTEMS
Fabrice Onofri, Mariam Ouattara, Yosri Haddad, Fabrice Lamadie
To cite this version:
Fabrice Onofri, Mariam Ouattara, Yosri Haddad, Fabrice Lamadie. ANALYSIS OF THE RAINBOW
SCATTERING BY HOMOGENEOUS AND INHOMOGENEOUS DROPLETS IN LIQUID-LIQUID
SYSTEMS. 12th international conference series on Laser-light and Interactions with Particles (LIP),
May 2018, College Station, TX, United States. �hal-02370327�
A
NALYSIS OF THER
AINBOWS
CATTERING BYH
OMOGENEOUS ANDI
NHOMOGENEOUSD
ROPLETS INL
IQUID–L
IQUIDS
YSTEMSFabrice R.A. ONOFRI1, Mariam OUATTARA1,2, Yosri HADDAD1,2, Fabrice LAMADIE2
1 Aix-Marseille Université, CNRS, IUSTI, UMR 7343, 13453, Marseille, France
2 CEA, DEN, DMRC, SA2I, F-30207 Bagnols-sur-Cèze, France
*Corresponding author: fabrice.onofri@univ-amu.fr, fabrice.lamadie@cea.fr
Abstract
This communication deals with the optical
characterization of droplets and fluids parameters that are relevant for liquid-liquid extraction processes, and notably, for nuclear fuel reprocessing. In immiscible liquid–liquid dispersions, i.e. droplets with a homogeneous but low value relative refractive index, the first order rainbow is localized in the near forward to sideways region. It exhibits also an unusual higher contrast for a parallel polarization illumination. Nevertheless, it is possible, considering appropriate light scattering models and inverse methods, to derive from its analysis the droplets’ size and composition. When a mass transfer occurs, the refractive index of the
droplets and the surrounding fluid become
inhomogeneous. In a pure molecular diffusion regime, the rainbow patterns can still be interpreted as well, allowing the estimation of relevant properties for chemical engineering processes, like molecular diffusivities or the distribution constant.
1 Immiscible systems – homogeneous droplets
We first consider that the extraction process is already completed or has not yet started [1]. The composition of the single or cloud of droplets is thus homogeneous. For obvious safety reasons, simulant and mixing fluids (TPH and Marcol) were used in this study in place of the real fluids involved in nuclear fuel reprocessing. TPH is the diluent employed in the actual process, while Marcol is a saturated hydrocarbon liquid with a higher refractive index than TPH but with comparable viscosity and surface tension. In the same way, for the continuous phase, demineralized water (HPLC-grade) replaces the nitric aqueous solution used in the process.
1.1 Rainbow characteristics and inversion
In a recent work [1], the present authors have shown that the rainbows produced by droplets with a low relative refractive index m exhibits two major differences regarding the classical rainbow patterns. Although for liquid droplets in gas, the first order rainbow is localized in
the near-backward scattering domain (e.g.,
137.8 165.0
r
q » - ° for respectively m»1.332 -1.60 ), for
liquid–liquid droplets it is localized in the near-forward to sideways regions (e.g., qr»27.9 113.6- ° for m»1.01-1.20). Furthermore, in the latter case the rainbow qr and the
Brewster 1
( )
12 tan
b m
q = -
scattering angles match for
1.0001 1.1005.
m» - Therefore, the rainbow’s ripple
structure is weaker for the parallel polarization.
240 255 (a) Mean diameter, D [µm] 450 600 Mode 2
Mode 1 Mode 1 & 2
Mode 2 (b) Mode 1 700 800 (c) 100 102 104 106 1000 1050 Number of droplets (d) 15 30 Standard deviation, sD [µm] 40 75 150 100 102 104 106 25 50 Number of droplets Number of droplets 1.4250 1.4255 Refractive index, m1 1.4250 1.4255 1.4250 1.4255 101.42500 102 104 106 1.4255 LMT Airy GOA Expected value
Figure 1 Numerical evaluation of the mean value and standard deviation on the parameters retrieved with the Monte Carlo inverse method [1] when the LMT, the Airy approximation, or a GOA are used to inverse rainbow patterns produced by an increasing number of homogeneous droplets (ensemble averaging mode).
To the best of our knowledge’s, all previous studies dealing with the rainbow produced by liquid-liquid systems were based on the Airy theory of the rainbow [2-3]. The relevance of this model for the inversion, as well as those of Geometrical Optics Approximations (GOA) and the Lorenz-Mie Theory (LMT) have been evaluated numerically by using a single scattering approximation [1]. To estimate the particle size distribution (PSD), two classical inversion methods were implemented. They both minimize, in the least square sense, the difference between the recorded (or synthetic) pattern and its direct simulation. For the regularization, the first method uses an analytic PSD model (one, two or three-modal) while the second relies on
LASER-LIGHT AND INTERACTIONS WITH PARTICLES MARCH 5TH-9TH, 2018,
COLLEGE STATION,TEXAS
a Monte Carlo scheme [1]. As an illustrative example of the resolution achieved, Figure 1 shows a comparison between the mean diameter and standard deviation retrieved for four mono or bimodal PSD with nominal moments: (a)
250
D= µm , sD=10µm ; (b) D1=450µm,sD,1=40µm,
2 600 ,
D = µm sD,2=25µm ; (c) D=750µm, sD=155µm ,
and (d) D=1000µm, sD=20µm versus the number of droplets (from 10 to 106) taken into account for the ensemble averaging process. 1.425 1.426 1.427 1.428 1.429 1.430 1.431 1.432 1.433 500 750 1000 1250 1500 500 750 1000 1250 1500 1.424 1.426 1.428 1.430 1.432 1.424 1.426 1.428 1.430 1.432
Nominal dilutions - Concentration in Marcol, CM [%]
0 3 6 9 12 0 3 6 9 12 Mean (D S-DSRD): 14µm STDEV (D S-DSRD): 11µm m1 [-] Color coding Raw data y=x y=x±5% SRD, D SRD [µm] Shadowgraph - Diameter, DS [µm] (b) Mean(m1,A-m1,SRD)» 3.9 10-4 STDEV(m1,A-m1,SRD)» 1.6 10 -4 (a) Raw data y=x DT=±1°C DCM=1% SRD, m 1,SRD [-]
Abbe refractometer - refractive index, m1,A[-] 600.0 800.0 1000 1200 DS [µm] Color coding y=x 1400 SRD, C M, SRD [%]
Figure 2 Single droplets - Comparisons of the (a) refractive indices and (b) sizes measured in the Standard Rainbow Diffractometry (SRD) mode, with values obtained with an Abbe refractometer and shadowgraph respectively [1].
This process was repeated 100 times to obtain a good evaluation of the mean and standard deviation on the retrieved moments. All synthetic signals were simulated with the LMT for droplets of constant (pure TPH with absolute refractive index m1= 1.4254
)
as well as for droplets with variable composition (mixing between TPH and Marcol considering an absolute refractive index of the surrounding medium is kept constant, m2= 1.3354, with2/ 1
m=m m ). Regarding the inversions, direct calculations
were performed with the LMT, Airy and GOA. As proved in Figure 1, about 104 to 105 droplets are necessary to reach the best resolution onto the PSD’s moments, even if for #103 to 104 droplets (or even less for narrow distributions) the resolution remains acceptable for some applications. With the Airy theory, the this resolution decreases with the droplet size (this was already known for liquid–gas systems) and when the complexity of the PSD increases, especially for the bimodal case. The results obtained with the GOA are more difficult to interpret. In our view, it could be due to difficulties in the truncation of the scattering
diagrams in the vicinity of the fold caustic. Thus, in what follows, LMT is exclusively used.
1.2 Experimental results and discussion
Experiments were performed within a rectangular tank, equipped with four optical glass windows and a droplet generator located at the bottom. Nine solutions of TPH-Marcol mixtures were prepared to generate free rising droplets in water. Their volume fraction in Marcol was in the range 0 to 12%, leading to changes in their relative index at 20°C from m=1.0681 to 1.0720 respectively. For our operating conditions and droplet sizes (600–1550 µm), the droplet Eötvös and Reynolds numbers are in the range of #1.2 10-1 to 2.6 10-2 and #6.4 to 90.2, ensuring the high sphericity of the droplets. The optical-setup to record and analysis the rainbow patterns is essentially a diffractometer operating in the first rainbow angle region. Its pixel-to-angle calibration is typically of D » 3.4 10q -3 deg/pix over the range q» 65–77 degrees [1].
1.424 1.426 1.428 1.430 1.432 1.424 1.426 1.428 1.430 1.432 -20 -10 0 10 20 -20 -10 0 10 20 STDEV(m 1,A-m1,GRD)< 1.3 10 -4 9 12 3 0 GRD, C M, GRD [%] Mean(m 1,A-m1,GRD)< 3.9 10 -5
Nominal dilutions - Concentration in Marcol, CM [%]
Monomodal Bimodal Monte Carlo y=x DT= ±1° GRD, m 1,GRD [-]
Abbe refractometer - refractive index, m1,A[-]
(a)
0 3 6 9 12 6 STDEV, (sD, S -sD, GRD )/ sD, S [%] Mean diameter, (DS-DGRD)/DS [%](b)
Monomodal (mean & STDEV: 0.6±3% & 1.0±8% ) Bimodal (mean & STDEV: 1.2±2% & 14±4% ) Monte Carlo (mean & STDEV: 0.9±3% & 12±5% )
Monte Carlo:
Figure 3 Cloud of droplets - Comparison of the (a) refractive indices and difference between the size parameters measured in Global Rainbow Diffractometry (GRD) mode, with those measured with an Abbe refractometer and shadowgraph [1].
All data reported here are corrected from changes in the mean temperature of the experimental room, from 17±0.5 to 23±0.5°C. Figure 2 compares the diameters and refractive indices obtained when analysing the patterns of 5700 single droplets, with those obtained using shadowgraph and Abbe refractometer measurements. The global agreement on the size of 5% is within the uncertainty of the shadowgraph set-up and image-processing algorithm. Despite the good resolution achieved on the refractive index value, one can notice that in-line measurements with the
LASER-LIGHT AND INTERACTIONS WITH PARTICLES MARCH 5TH-9TH, 2018,
COLLEGE STATION,TEXAS
SRD exhibit a slight shift compared to Abbe’s refractometer measurements. It is mostly due to the uncertainty in the temperature control. The resolution of 1.6 10-4 obtained on the refractive index corresponds to a deviation of 0.8% of Marcol within the droplets. Figure 3 summarizes the results obtained on six clouds of different mixture fractions and size distributions (maximum size range » 120–900) by GRD. For each case, the statistics corresponds to 1400 to 2100 droplets, which is rather weak according to the results presented in Figure 1. However, the refractive index measurements are very convincing, as well as the mean diameter. The lower agreement on the standard deviation is quite difficult to interpret. After a more careful analysis, we found that the PSD obtained with the shadowgraph exhibits time to time a small population of droplets around 120 µm never retrieved with the GRD. Obviously, this small and distant population has a stronger influence on the estimation of the standard deviation non-visible on the mean diameter. Two plausible explanations for this small shift are: (i) the GRD systematically underestimates the number of small droplets due to some limitation in the signal dynamic, (ii) these small droplets (probably satellite droplets) are not passing through the probe volume of the GRD system which is smaller.
2 Dynamic extraction and inhomogeneous droplets
For basic extraction studies, we used the triplet: water, acetone and toluene that is well documented in the literature. The acetone is the component to be extract when water and toluene are respectively the organic and aqueous phases. In what follows, we restrict ourselves to the case where the extraction is performed from the surrounding media, also call feed phase (initially composed of water and acetone) toward the droplet (initially composed of pure toluene), called solvent phase. A distribution ratio [4] between solvent phase and feed phase of Ddistti=0.86 is expected.
2.1 Models and inversion
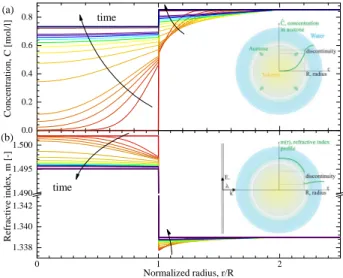
The literature on the modelling of liquid-liquid extraction is abundant, and more particularly for the single molecular diffusion regime (i.e. other effects are neglected) [4]. To describe this regime several models exists. They differ by many aspects which relevance is not in the scope of the present conference. However, in brief, they all solve Fick's laws of diffusion in both media with various simplifying assumptions on the steady or quasi steady state nature of the process, the boundary conditions at the interface and at infinite, the time and concentration dependency of the physical constants, etc. As an illustration, Figure 4 (a) shows the temporal evolution of the concentration profiles in acetone inside and outside a pure toluene droplet, with an initial radius of 500µm, placed initially in a liquid mixture of water (95% in mass) and acetone (5%). Theses simulations were performed with a time dependant radial model with constant thermophysical
properties [4]. Figure 4 (b) shows the corresponding refractive index gradients which evolve rapidly prior to stabilize slowly, i.e. it takes only 10 seconds to extract 50% of the acetone, while for the remaining 49% it takes 200s more. 0.0 0.2 0.4 0.6 0.8 0 1 2 1.338 1.340 1.342 1.490 1.495 1.500 (a) Concentration, C [mol/l] time (b) Refractive index, m [-] Normalized radius, r/R time
Figure 4 Evolution of the (a) concentration in acetone and (b) refractive index inside and ouside a droplet for different extraction times.
The scattering properties of this scatterer (i.e. droplets and surrounding environment) can no longer be simply characterized by the refractive index discontinuity occurring at the droplet interface. The influence of the internal and external refractive index gradients has to be taken into account. This can be done with the Generalized Lorenz-Mie for multi-layered spherical particles [5]. In doing this, there are two difficulties to manage: the large size parameters and the huge number of layers necessary to discretize the refractive index profiles. We have developed an accurate and robust code which can handles particles of a few millimetre in diameter (size parameter of several tens thousands) and several tens thousands of layers. However, to minimize the computational time that is so critic for inverse methods, the number of layers (L) has to be optimized by analysing the derivative of the radiation profiles. In practice, a refractive index layer
k
is introduced only when the refractive index increases, with respect to the layerk
-1, from a quantity e0:( )
{
1}
0 | r r r r k m r dr k k k e -=ò
= (1)In a similar way, the radius rL of the outer layer is
defined as: rL=
{
r m rL,( )
¥ -m r( )
L <e0}
with in allcircumstances 6 5
0 10 10 .
e = - -
-Intensive numerical simulations were conducted to evaluate the influence of the parameters of the extraction process on the rainbow patterns. Visually, as it is observed experimentally (see Figure 5), the main effect of the gradients is to shift the whole pattern, except at short times were the rainbow patterns appears to be distorted. At the moment, like for homogeneous droplets, our inversion
LASER-LIGHT AND INTERACTIONS WITH PARTICLES MARCH 5TH-9TH, 2018,
COLLEGE STATION,TEXAS
procedure is simply based on a parametric minimization of the L2 norm of the difference between the rainbow patterns directly simulated (with the molecular diffusion and light scattering models) and the ones recorded experimentally. From a general point of view, the unknown parameters are numerous, e.g. the initial concentrations (two are independent values), the thermodynamics constants (diffusivities and distribution ratio), the droplet diameter, the time delay between the droplet injection and the experimental first acquisition, etc. In practice, it is assumed that some of these parameters can be inferred (from the properties of initial solutions) or deduced by other means (shadowgraph imaging for instance).
88 90 92 94 0.0 0.2 0.4 0.6 0.8 1.0 0 10 20 30 40 50 60 90 91 92 93 94 (b) Time
Rainbow intensity profile [A.U] Scattering angle, q [deg]
t=8s t=21s t=45s t=60s t=68s Shift 1mm (a)
Extraction ends (5% d'acétone)
Initial concentration
1% 5%
Position first fringe [deg]
Time [s]
Before extraction
Extraction ends ( 1% d'acétone)
Figure 5 Experimental results: evolution of the rainbow patterns during the extraction process: (a) intensity profiles (for an initial concentration in acetone of 5%) and (b) angular position of the first fringe (for two initial concentrations in acetone).
2.2 Experimental results and discussion
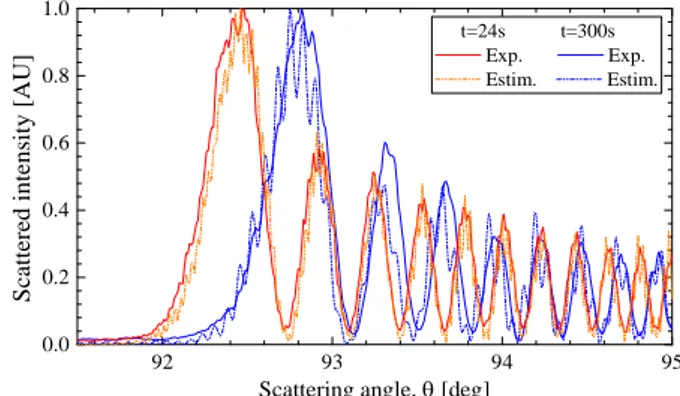
To further simplify the problem and be consistent with the hypotheses of the diffusion model, the experiments were performed on fix droplets with the sessile drop technique. Figure 5 (a) shows typical images of a millimetre sized droplet and its corresponding rainbow pattern, with some rainbow intensity profiles recorded all along the extraction process. Like it was observed on numerical simulations, the main effect of the gradients seems to be a shift of the rainbow pattern. Figure 5 (b) shows the evolution of the angular position of the first fringe, when the initial concentration in acetone of the droplet is set to 1 or 5%. As an illustration of the resolution that can be obtained, Figure 6 compares two experimental intensity profiles measured 24 and 300s after the beginning of the extraction process, with those retrieved by the inverse procedure when only four unknowns are considered: the initial concentration in acetone in the two phases ( 1
0 C in
water and 2
0
C in toluene), the distribution ratio Ddist and
the droplet initial diameter .R The agreement between the profiles is qualitative. However, the estimations of the parameters of interest are quite satisfactory, see Table 1.
All these results, that will be detailed in our presentation, open up interesting perspectives for the characterization of mixing and extraction processes as well as the determination of the related basic thermodynamics constants. 92 93 94 95 0.0 0.2 0.4 0.6 0.8 1.0
Scattered intensity [AU]
Scattering angle, q [deg]
t=24s t=300s Exp. Exp. Estim. Estim.
Figure 6 Comparison of two experimental rainbow profiles with their estimation.
C10=1%
1
0 5%
C =
Param. Expected Estim. Expected Estim.
[ ]
R mm 1.40 1.325 1.28 1.20[ ]
2 0 % C 0.00 0.00 0.00 0.00[ ]
1 0 % C 1.00 0.50 5.00 5.00[ ]
dist D - 0.86 0.90 0.86 0.80Table 1 Initial parameters retrieved from the analysis of the rainbow scattering patterns for two initial concentrations.
3 Acknowledgements
This work was supported by the Nuclear Energy Division of the CEA (DISN/PAREC program) and partly supported by the French National Research Agency (Grant Nos. ANR-13-BS09-0008-02, ANR-11-LABX-0092, ANR-11- IDEX-0001-0).
4 References
[1] Ouattara M., Lamadie F., Sentis M.P.L, Onofri F.R.A., Droplet sizing and mixture fraction measurement in liquid–liquid flows with rainbow-angle diffractometry, Appl. Opt. 56:8109-8120 (2017)
[2] Schombacher E.H., Bauckhage K., Determination of concentrations and concentration gradients of droplets within ternary liquid/liquid-systems by rainbow refractrometry. Chemische Technik: 49(3):125-131 (1997).
[3] Vetrano M.R., van Beeck J.P.A.J., Riethmuller M.L., Global rainbow thermometry: improvements in the data inversion algorithm and validation technique in liquid–liquid suspension. Appl. Opt. 43(18): 3600-7 (2004).
[4] Crank, J., The mathematics of diffusion (Oxford university press, Oxford, 1979)
[5] Onofri F., Grehan G., Gouesbet G., Electromagnetic scattering from a multilayered sphere located in an arbitrary beam. Appl. Opt. 34(30):7113-7124 (1995).
![Figure 1 Numerical evaluation of the mean value and standard deviation on the parameters retrieved with the Monte Carlo inverse method [1] when the LMT, the Airy approximation, or a GOA are used to inverse rainbow patterns produced by a](https://thumb-eu.123doks.com/thumbv2/123doknet/12982092.378395/2.892.457.802.378.804/numerical-evaluation-standard-deviation-parameters-retrieved-approximation-patterns.webp)
![Abbe refractometer - refractive index, m 1,A [-]](https://thumb-eu.123doks.com/thumbv2/123doknet/12982092.378395/3.892.100.426.322.683/abbe-refractometer-refractive-index-m-a.webp)